Plant Growth, Yield, and Biochemical Composition of Solanum macrocarpon and Corchorus olitorius under Varying Temperatures
Sustained global climate change and shift in growing seasons have led to the introduction of various tropical crops in temperate regions but the impact on their chemical composition is unknown. A controlled-environment study was conducted in growth chambers (GC) to evaluate the response of two tropical leafy vegetables namely, gboma (Solanum macrocarpon L) and jute mallow (Corchorus olitorius L) at day/night temperature regimes of 32°/27°C (GC32), 20°/15°C (GC20), 15°/10°C (GC15), and greenhouse average temperature of 24°/21°C (GH24). The results demonstrated that temperature variability had significant (p<0.05) impact on the two plants species. Relative plant growths of gboma and jute mallow were markedly higher in GH24 and GC32, respectively, compared to the other temperatures. The gboma and jute mallow plants grown in GC32 had the highest leaf length. The gboma plants grown in GC24 recorded a significantly (p<0.05) higher number of leaves, which was approximately 36% higher compared their counterparts grown in the GC32. Jute mallow plants grown in the GC32 significantly (p<0.05) recorded the highest number of leaves, plant height, stem diameter and leaf area. Gboma plants grown in GC24 had significantly (p<0.05) the highest maximum quantum efficiency (Fv/Fm) compared to all the other treatments. For the jute mallow, the GC32 environment gave a significantly (p<0.05) higher maximum quantum efficiency (Fv/Fm), chlorophyll content, transpiration rate, and stomatal conductance compared to the other growth conditions. Gboma and jute mallow plants grown in the GC15 chamber significantly (p<0.05) produced higher plant tissue contents of phenolics, flavonoids, and proline. The present study shows that gboma and jute mallow can grow well at temperatures between 20o to 32°C. Further studies should be conducted to assess the mechanism of low temperature adaptation, and proximate composition.
Introduction
Climate change is one of the main global challenges of the 21st century. According to Calvin K, et al. [1], the emission of greenhouse gases by human activities is the principal cause of global warming, with global surface temperature reaching
1.1°C in 2011 to 2020. Canada’s annual average temperature over land since 1948 has increased by approximately 1.7°C, which is roughly double the global average level of warming. This high temperature has led to heatwaves, changes in rainfall patterns, reductions in snow and ice cover, shrinking and thinning arctic sea ice, thawing permafrost, and changes in streamflow [2, 3]. These climate hazards have exposed millions of people to acute food insecurity [1]. Moreover, adaptation of new crops can be beneficial to the growing immigrant populations in Canada and other places in the temperate regions.
Typically, gboma (Solanum macrocarpon L.) and jute mallow (Corchorus olitorius L.) are important indigenous vegetables of Africa Kwarteng AO, et al. [4] that can be introduced into different regions of the world in the fight against malnutrition to achieve the Millennium Development Goals. The introduction of these new crops will provide an alternative source of leafy vegetables and dietary diversification for the indigenous people. This will also diversify agricultural production, which will have a positive economic impact. The demand for tropical vegetables by the European Union and the United States has increased remarkably in the last few decades Irfan M, et al. [5] mainly due to their high nutritional profile.
Gboma and jute mallow grow more easily in certain ecological environments when compared to other temperate vegetables such as cabbage (Brassica oleracea), kale (Brassica oleracea var. sabellica), or spinach (Spinacia oleracea) [6]. Temperature influences growth and development, and physiological processes such as photosynthesis, and transpiration rate in crops [7]. They reported that each crop species has a specific temperature range referred to as minimum, maximum and optimum temperatures. For instance, the optimum temperature required for cool-season vegetable ranges between 15° to 20°C Ghaafar C, et al. [8] while gboma and jute mallow thrive well in warmer regions with optimum temperature above 25°C [4]. Temperatures below 6°C and above 45°C can be lethal to many crops including gboma and jute mallow. Temperatures above 10°C allow some crops such as cabbage (Brassica oleracea), and kale (Brassica oleracea var. sabellica), to thrive well [9, 10]. Tomatoes (Solanum lycopersicum) and lettuce (Lactuca sativa) subjected to low temperature accumulated antioxidants such as carotene, phenolics, and lycopene [11, 12]. When gboma and jute mallow are introduced into the temperate regions, their growth conditions might change due to stress. It was therefore hypothesized that the successful introduction and growth performance of gboma and jute mallow will be dependent on the planting date, which will vary with variation in temperature. Therefore, the present study determined the variations in growth, yield, and chemical composition of gboma and jute mallow under different temperature regimes; namely growth chamber day/night temperature regimes of 32°/27°C (GC32), 20°/15°C (GC20), 15°/10°C (GC15), and greenhouse average temperature of 24°/21°C (GH24).
Materials and Methods
Study Area, Plant Materials and Growth Conditions
The study was conducted at the Department of Plant, Food, and Environmental Sciences, Dalhousie University, NS from March to June 2023. Seeds of gboma and jute mallow were initially soaked in water for 24 h and sown in a 32-cell pack trays. The seedlings were transplanted after two weeks into 11-inch pots filled with Pro-Mix® BX mixed soilless media. NPK fertilizer (20-20-20 Miracle Gro®) obtained from Canadian Tire, Truro, NS was applied at the manufacturer’s recommended rate of 6 mL/L at 7 days intervals until final harvest at five weeks after transplanting (WAT). All plants were watered regularly to field capacity until final harvest.
Experimental Treatments and Design
The plants were grown in varying temperatures in growth chambers (GC) with 150 µmol m-2 s-1 light intensity at 12 h photoperiod. The day/night temperature regimes were 32°/27°C (GC32), 20°/15°C (GC20), and 15°/10°C (GC15). A greenhouse environment (GH24) was used as the control at an average temperature of 24°/21°C and light intensity of 277 µmol m-2 s-1 with 12 h photoperiod. The gboma and jute mallow plants were arranged in a completely randomized design with six replications. The optimum temperature for growing gboma and jute mallow rangeds between 27° and 32°C [13]. In the temperate regions the average maximum temperature could be 15° to 20°C, and minimum temperature of 10° and 15°C. These assumptions were used to design the present experiment. The experimental treatments GC32, GC20 and GC15 and GH24 were not adequately replicated in space and time. However, there were 6 plants for each species which were randomly placed in each treatment condition. Thus, pseudo-replication was adopted by re-arranging the experimental pots on weekly basis to offset any unpredictable occurrence due to variations in environment [14, 15].
Plant Growth and Yield
Plant growth parameters were measured at 5WAT. Plant height was measured from the collar of the stem to the tip of the highest leaf with a ruler and the diameter of the main stem was measured at the collar with a digital Vernier caliper. The total numbers of leaves were recorded per plant for each treatment. Leaf area was assessed by LI-3100 leaf area meter (LI-COR Inc. Lincoln, Nebraska, USA). Relative growth rate and leaf elongation were assessed by measuring the height and leaf length of each plant every three days using a ruler. Total plant above-ground (i.e., leaves and shoot) fresh weight was determined using a Ohaus navigator® portable balance (ITM Instruments Inc., Canada).
Leaf Greenness and Chlorophyll Fluorescence Indices
Leaf greenness was used to estimate chlorophyll content on four fully expanded leaves per plant using a SPAD 502- plus chlorophyll meter (Spectrum Technologies, Inc., USA).
Chlorophyll fluorescence indices i.e., maximum quantum efficiency (Fv/Fm) and potential photosynthetic capacity (Fv/Fo) were measured on the same leaves with a Chlorophyll fluorometer (Optical Science, USA). Net photosynthetic rate, transpiration rate, intracellular carbon dioxide concentration, and stomatal conductance were measured from the same four leaves using LCi portable photosynthesis system (ADC BioScientific Ltd, UK) using the manufacturers protocol.
Biochemical Analysis
At final harvest, gboma and jute mallow leaves were sampled and immediately frozen in liquid nitrogen. The frozen samples were ground into fine powder and stored in a -80°C freezer for further analysis.
Chlorophylls a, b, and Carotenoid Assay
Leaf tissue chlorophylls a and b and carotenoids were
determined as described by Linchtenthaler HK [16]. A 0.2 g of
ground samples were transferred into a sterile 2 mL eppendorf
tube and 1.5 mL of 80% acetone was added. The mixture was
vortexed for 1 min and centrifuged at 12,000 x g for 15 min.
A 200 µL sample of the supernatant was transferred into a
microplate and the absorbance (A) was measured at 646.8
and 663.2 nm with a UV-vis spectrophotometer against 80%
acetone as blank. The concentrations of chlorophylls (chl) a
and b were calculated using the formula:
( )
ì g mL =12.25*A663.2
$$ C h l b \left(\mathrm {i g} / \mathrm {m L}\right) = 1 2. 2 5 * \mathrm {A 6 6 3. 2} - 2. 7 9 * \mathrm {A 6 4 6. 8} $$ ( )
ì g mL =21.50*A646.8
$$ C h l b \left(\mathrm {i g / m L}\right) = 2 1. 5 0 * \mathrm {A 6 4 6. 8} - 5. 1 * \mathrm {A 6 6 3. 2} $$ The chlorophylls were expressed as -1 ì gg FW . For the carotenoid, the absorbance was measured at 470 nm and calculated using the formula: Carotenoid ( ) ( ) ì g mL = 1000*A470-1.8*chla-85.02*chlb 198 The total carotenoid content was expressed as -1 ì gg FW .
Total Phenolics Content
Total phenolics content (TPC) was determined by the Folin–Ciocalteu assay as described by Ainsworth EA, et al. [17] with slight modification. A 0.2 g of the ground sample per treatment was homogenized in 1.5 mL in ice-cold 95% methanol and incubated in the dark at room temperature for 48 h. The mixture was centrifuged at 15,000 x g for 15 min and 100 µL of supernatant was transferred into a new eppendorf tube. A 200 µL of 10% Folin-Ciocalteau reagent was added and vortexed for 5 min. A 800 µL of 700 mM sodium carbonate was added to the mixture, vortexed for 1 min and incubated at room temperature for 2 h. The absorbance of the resultant mixture was measured at 765 nm. Total phenolic content was estimated using gallic acid equivalents standard curve and was expressed as mg gallic acid equivalents per g of the sample.
Total Flavonoids Content
Total flavonoid content was determined as described by Chia-Chi C, et al. [18] with some modifications. A 0.2 g of the ground sample was homogenized in 1.5 mL of 95% methanol. The mixture was centrifuged at 15,000 x g for 15 min and 500 µL of the supernatant was transferred into a new tube. To each tube, 1.5 mL of 95% methanol, 0.1 mL of 10% aluminum chloride, 0.1 mL of 1 M potassium acetate, and 2.8 mL of distilled water were added. The mixture was vortexed and incubated for 30 mins at room temperature and the absorbance was measured at 415 nm against a blank. Flavonoids content was estimated using a quercetin standard curve. Total flavonoids content was calculated using the formula:
Flavonoid (µg/g) = (flavonoids)(µg/ml) x total volume of methanolic extract (mL)/ mass of the extract.
Proline Content
Proline content was estimated following the procedure described by Bates LS, et al. [19]. A 0.1 g of the ground leaf sample was mixed in 3 mL of 3% sulfosalicylic acid and centrifuged at 16,000 x g for 5 min. A 400 μL of the supernatant was added to a reaction mixture containing 400 μL of 3% sulfosalicylic acid, 800 μL glacial acetic acid, and 800 μL acidic ninhydrin. The tubes were sealed, vortexed for 30 s, and the mixture was incubated in a water bath at 96°C for 1 h. After cooling at room temperature on ice, 3 mL of toluene was added and vortexed for 30 s to extract red chromophore. The absorbance was measured at 520 nm using toluene as a blank. The free proline content was determined using L-proline standard curve and expressed as mg/g FW.
Statistical Analysis
All data obtained were subjected to one-way analysis of variance (ANOVA) using Minitab version 21 (Minitab, Inc., State College, Pennsylvania, USA). Tukey’s honestly significant difference post-test was used to separate treatment means when the ANOVA indicated p ≤ 0.05. MS Excel was used to plot graphs.
Results and Discussion
Plant Growth and Yield
Plant growth is an irreversible increase in plant size followed by a quantitative change in plant biomass. The
growth and development of plants are completed within a time frame determined by environmental conditions where temperature, nutrient, light, and moisture are the limiting factors for the potential expression of plant genes [20]. Visual observations of the plants under the different temperature treatments are represented in Figure 1. It was demonstrated that both gboma and jute mallow can be affected by varying temperatures. As such, the growth, development, and yield of both plant species under different climatic conditions can vary due to changes in plant metabolic processes.
The low temperatures of 15°C in the GC15 and 20°C in the GC20 growth chambers had the most negative impact on the growth parameters of gboma (left photo) and the jute mallow (right photo) including the number of leaves, leaf area, plant height and leaf chlorophyll content (Figure 1). These two plant species are typical tropical plants that grow well in high temperature environments Kwarteng AO, et al. [4], which was proven by the plants grown at an average daily temperature of 32°C in GC32 compared to plants grown at an average temperature of 20°C in GC20 and 15°C in GC15. The growth chambers were more controlled compared to the greenhouse, and the average daily greenhouse temperature of 24°C also negatively affected both plant species but the growth performances of the plants were better than those in the GC15 and GC20 environments (Figure 1). Visually, plants grown in GC32 had dark green leaves (desired by consumers) compared to the discolored leaves of plants grown in GC15, GC20 and GH24.
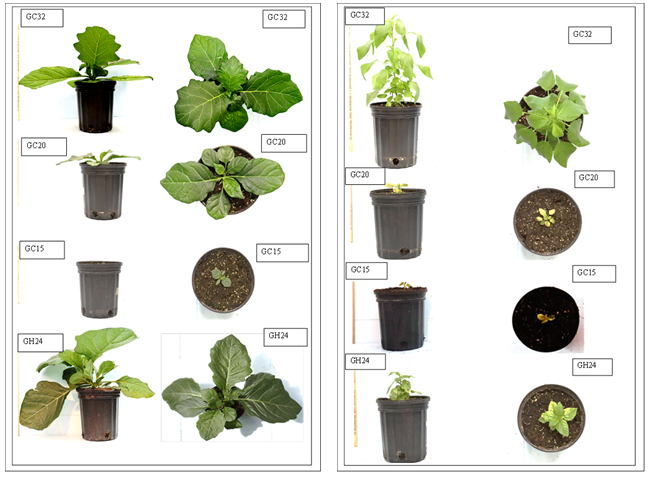
Figure 1: Left – Gboma (Solanum macrocarpon L.) and Right – jute mallow (Corchorus olitorius L.) plants grown under varying temperatures. GC32, GC20, and GC 15 represent day/night temperature regimes at 32°/27°C, 20°/15°C and 15°/10°C, respectively; and GH24 represents greenhouse environment (control) at an average temperature of 24°/21°C. Quantitatively, the results of the present study showed that the variation in temperature remarkably altered the relative growth rate (RGR) of both gboma and jute mallow plants (Figure 2).
The RGR of gboma and that of the jute mallow in GC15 did not significantly (p>0.05) change up to day 18 and day 12, respectively (Figure 2A-2B). The RGRs of both gboma and jute mallow were differentially altered under GH24, GC32, and GC20. For gboma plants, the GC20 recorded the second lowest RGR (Figure 2A). For the jute mallow grown in the GC15, the RGR increased on day 3 then plateaued for the rest of the days (Figure 2B). Therefore, this suggests that different plants respond differently to different temperature regimes, and this may vary from species to species [21, 22]. The results showed that the GC32 had negative effect on gboma plant as time went by. However, for the jute mallow, it was clear that RGR increased with an increase in temperature from 10° to 32°C (Figure 2B). In addition, leaf elongation (LE) of the gboma and the jute mallow plants were altered differently with the variations in temperature. Like the RGR, the GC15 for gboma plants, and GC15 and GC20 for jute mallow led to the least LE. For gboma, it was clear that LE increased with an increase in temperature from 10° to 32°C (Figure 2C). This suggests that different species differ in their physiological responses to different temperature regimes [21].
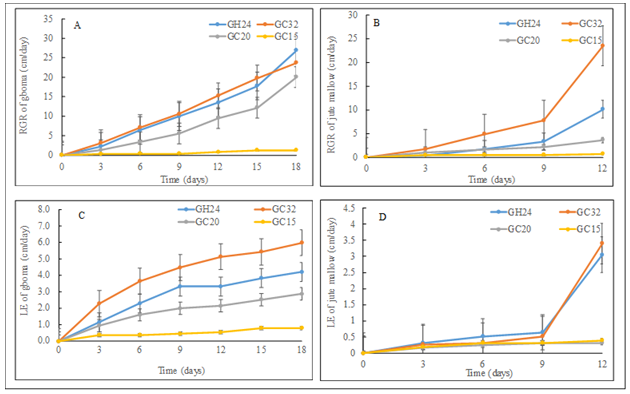
Figure 2: Temperature effect on (A) - relative growth rate (RGR) of gboma (Solanum macrocarpon), (B) - relative growth rate (RGR) of jute mallow (Corchorus olitorius), (C) - leaf elongation (LE) of gboma and (D) leaf elongation (LE) of jute mallow. Vertical bars represent error bars (N=4). GC32, GC20, and GC 15 represent day/night temperature regimes at 32°/27°C, 20°/15°C and 15°/10°C, respectively; and GH24 represents greenhouse environment (control) at an average temperature of 24°/21°C.
Comparatively, gboma plants grown in GH24 showed a significant (p<0.05) increase in the number of leaves and stem girth, followed by GC32 (Table 1). On the other hand, gboma plants grown in the GC32 showed a significant (p<0.05) increase in plant height and leaf area, followed by plants grown in the GH24 (Table 1). These two conditions consequently produced higher above-ground biomass, although the fresh weight of plants grown in the GH24 was significantly higher than that of the GC32 (Figure 3A). In addition, GC32 significantly (p<0.05) increased the number of leaves, plant height, stem girth, and leaf area in jute mallow plants Table 2, although considerable growth was observed in plants grown in the GH24 condition. For above-ground fresh weight, GC32 plants had a (p<0.05) higher value compared to the plants in the other temperature conditions (Figure 3B).
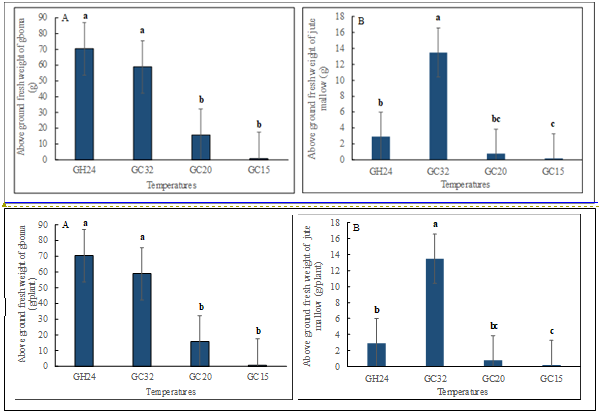
Figure 3: Effect of temperature on plant fresh weight of (A) gboma (Solanum macrocarpon) and (B) jute mallow (Corchorus olitorius). Vertical bars represent error bars (N=4), different alphabetical letters mean significant difference between treatment means (N = 4) by Tukey’s honestly significant difference (HSD) test at p ≤ 0.05. GC32, GC20, and GC 15 represent day/night temperature regimes at 32°/27°C, 20°/15°C and 15°/10°C, respectively; and GH24 represents greenhouse environment (control) at an average temperature of 24°/21°C.
The results of the present study indicate that understanding the effects of temperature variation on the growth and productivity of plants is of vital importance as it can have both positive and negative effects. Within the acceptable temperature range for plants, warmer temperatures are known to promote faster growth rates and increased productivity. This observation is consistent with how both the gboma and the jute mallow plants responded differently to varying temperature conditions in the present study. This suggests that variation in temperature may affect nutrient uptake, assimilation, and utilization by plants, and thereby affecting the overall plant growth and productivity.
| Temperatures | Number of leaves | Plant Height (cm) | Stem Diameter (mm) | Leaf Area (cm2) |
|---|---|---|---|---|
| GH24 | 25.00 ± 1.50a | 27.25 ± 1.94a | 6.12 ± 1.34a | 160.13 ±89.4ab |
| GC32 | 18.00 ± 1.50b | 30.25 ± 1.56a | 5.33 ± 0.62ab | 258.23 ± 73.9a |
| GC20 | 9.00 ± 1.29c | 14.95 ± 3.18b | 4.29 ± 0.65b | 55.28 ± 38.9bc |
| GC15 | 6.00 ± 0.58d | 3.18 ± 0.59c | 2.57 ± 0.64c | 5.57 ± 0.83c |
| p - value | 0 | 0 | 0.001 | 0 |
Table 1: Morphological Response of Gboma (Solanum Macrocarpon) to Different Temperatures.
Values are means ± standard deviation of four replicates and different letters indicates significant (p < 0.05) difference according to Tukey’s honestly significant difference post-test. Table 1: Morphological Response of Gboma (Solanum Macrocarpon) to Different Temperatures.
| Temperatures | Number of Leaves | Plant Height (cm) | Stem Diameter (mm) | Leaf Area (cm2) |
|---|---|---|---|---|
| GH24 | 31.00 ± 8.18b | 10.25 ± 2.90b | 2.59 ± 0.63b | 7.53 ± 2.30b |
| GC32 | 72.00 ± 7.23a | 36.38 ± 3.40a | 4.75 ± 0.27a | 21.88 ± 9.34a |
| GC20 | 10.00 ± 4.27c | 4.25 ± 1.66b | 1.76 ± 0.64b | 4.01 ± 0.63b |
| GC15 | 3.00 ± 0.82c | 2.93 ± 0.53c | 1.08 ± 0.11b | 2.92 ± 1.30b |
| p - value | 0 | 0 | 0.001 | 0.003 |
Table 2: Morphological Response of Jute Mallow (Corchorus olitorius) Plants to Different Temperatures.
Values are means ± standard deviation of four replicates; different alphabetical letters indicate significant (p < 0.05) difference according to Tukey’s honestly significant difference post-test at α = 0.05. Table 2: Morphological Response of Jute Mallow (Corchorus olitorius) Plants to Different Temperatures.
The trend in the total plant fresh weights, which was used to estimate yield, for both gboma and jute mallow can be linked to the influence of temperature variations on stomatal conductance and efficiency of light absorption by chlorophyll molecules and electron transfer that increased photosynthetic efficiency and assimilate production [23]. Both gboma and jute mallow plants exhibited high stomatal conductance in GC32 but were low in GC15 (Tables 3 & 4).
| Temperatures | Fv/Fo | Fv/Fm | SPAD value | A (μmol m-2 s-1) | E (mol m-2 s-1) | Ci (μmol mol -1) | gs (mol m-2 s-1) |
|---|---|---|---|---|---|---|---|
| GH24 | 4.24 ± 0.32a | 0.81 ± 0.01a | 49.70 ± 3.80a | 14.56 ± 2.21a | 6.47 ± 0.52a | 266.25 ± 13.11c | 0.31 ± 0.04a |
| GC32 | 3.58 ± 0.26b | 0.78 ± 0.01a | 48.15 ± 3.30a | 14.59 ± 2.94a | 7.30 ± 2.12a | 329.38 ± 19.11b | 0.38 ± 0.18a |
| GC20 | 3.6 ± 0.20b | 0.78 ± 0.01a | 47.00 ± 2.82a | 3.42 ± 0.39b | 2.17 ± 0.27b | 397.25 ± 12.28a | 0.19 ± 0.05ab |
| GC15 | 1.57 ± 0.22c | 0.60 ± 0.03b | 43.46 ± 12.29a | 1.57 ± 0.64b | 0.60 ± 0.22b | 349.13 ± 30.70b | 0.03 ± 0.01b |
| p - value | 0 | 0 | 0.621 | 0 | 0 | 0 | 0.001 |
Table 3: ** Physiological Response of Gboma (Solanum macrocarpon) to different Temperatures.
Fv/Fo, potential photosynthetic capacity, Fv/Fm, maximum quantum efficiency, A, photosynthetic rate; E, transpiration rate; Ci, Sub-stomatal CO2; gs, stomatal conductance. Values are means ± standard deviation of four replicates and different letters indicates significant (p < 0.05) difference according to Tukey’s honestly significant difference post-test at α = 0.05. Table 3: Physiological Response of Gboma (Solanum macrocarpon) to different Temperatures.
The reduction in the stomatal conductance in the lowest temperatures was an adaptive mechanism used by the crops to minimize water loss [24]. In addition, abiotic stress factors such as extreme high or low temperatures affect common plant physiological responses including reductions in transpiration and photosynthesis rates, stomatal conductance and leaf water content that can lead to a reduction in relative growth rate [25]. Chlorophyll fluorescence reflects the overall level of photosynthetic reaction processes such as light energy absorption, excitation energy transfer, and photochemical reaction [26]. It is an important indicator of plant photosynthesis and stress where Fv/Fm value greater than 0.78 can be associated with healthy plant [27]. It can be deduced from the present study that gboma and jute mallow were healthier in GH24 and GC32, respectively (Tables 3&4). Fv/Fo and Fv/Fm were reduced under adverse conditions Kim D, et al. [28], which can explain the trend shown in the present study.
| Temperatures | Fv/Fo | Fv/Fm | SPAD value | A (μmol m-2 s-1) | E (mol m-2 s-1) | Ci (μmol mol -1) | gs (mol m-2 s-1) |
|---|---|---|---|---|---|---|---|
| GH24 | 2.52± 0.24b | 0.71 ± 0.02ab | 11.88 ± 5.15b | 3.03 ± 1.24c | 3.23 ± 1.10b | 347.25 ± 11.78b | 0.14 ± 0.06b |
| GC32 | 4.16 ± 0.22a | 0.81 ± 0.01a | 31.76 ± 2.66a | 12.46 ± 1.49b | 8.60 ± 0.41a | 333.13 ± 10.80b | 0.32 ± 0.03a |
| GC20 | 1.83 ± 0.75b | 0.62 ± 0.11b | 10.00 ± 6.61b | 0.51 ± 0.46d | 0.59 ± 0.26c | 402.50 ± 22.2a | 0.03 ± 0.01c |
| GC15 | 0.21 ± 0.10c | 0.17 ± 0.07c | 10.45 ± 4.15b | 28.48 ± 0.33a | 0.14± 0.11c | 242.25 ± 0.50c | 0.01 ± 0.02c |
| p - value | 0 | 0 | 0 | 0 | 0 | 0 | 0 |
Table 4: ** Physiological response of jute mallow (Corchorus olitorius) plants to different temperatures.
Fv/Fo, potential photosynthetic capacity, Fv/Fm, maximum quantum efficiency, A, photosynthetic rate; E, transpiration rate; Ci, Sub-stomatal CO2; gs, stomatal conductance. Values are means ± standard deviation of four replicates and different letters indicates significant (p < 0.05) difference according to Tukey’s honestly significant difference post-test. Table 4: Physiological response of jute mallow (Corchorus olitorius) plants to different temperatures.
Plant Biochemical Composition under Different Temperature Regimes
Chemical Composition of Gboma: Chlorophyll a in gboma plants was higher and statistically (p>0.05) the same for plants grown in GH24, GC32 and GC20, but was low for plants in GC15 (Figure 4A). Plants grown in GC32 and GC20 had significantly (p<0.05) higher chlorophyll b than those in the GH24 and GC15 (Figure 4B).
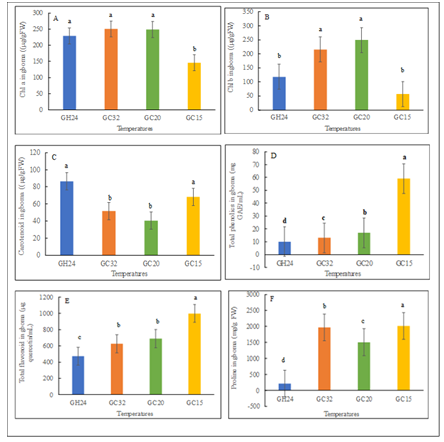
Figure 4: Phytochemical content of gboma (Solanum macrocarpon) were influenced with variation in temperature; different alphabetical letters mean significant difference between treatment means (N = 4) by Tukey’s honestly significant difference (HSD) test at p ≤ 0.05. Vertical bars represent error bars (N=4). GC32, GC20, and GC 15 represent day/night temperature regimes at 32°/27°C, 20°/15°C and 15°/10°C, respectively; and GH24 represents greenhouse environment (control) at an average temperature of 24°/21°C.
Chlorophylls a and b are crucial pigments of the plant photosystem. Chlorophyll a is the primary photosynthetic pigment that helps to produce energy in plants and its concentration is 2-3 times higher than chlorophyll [29]. The present results revealed that plants grown in the GH24 and GC15 had significant (p<0.05) higher carotenoids content compared to their counterparts in the GC32 and GC20 (Figure 4C). Carotenoids are lipophilic pigments essential for the health of humans [30]. This suggests that the biosynthesis of these pigments may be affected by different growing temperatures [31]. The total phenolics, flavonoids and proline contents were significantly (p<0.05) higher in the gboma plants in GC15 as compared to plants under the other temperatures (Figure 4D-4F). Total phenolics of GC15 plants increased by approximately 2.5-, 3.5- and 4.9-folds compared to plants grown in GC20, GC32, and GH24, respectively (Figure 4D). Similarly, total flavonoids of plants in GC15 plants was increased by about 0.4-, 0.6- and 1.1-folds compared to GC20, GC32 and GH24, respectively (Figure 4E). The proline content of gboma plants in GC15 was significantly (p<0.05) increased by approximately 0.02- , 0.3-, and 8.5-folds compared to GC32, GC20, and GH24, respectively (Figure 4F).
Chemical Composition of Jute Mallow: The GC32 significantly (p<0.05) exhibited higher chlorophylls a, b, and carotenoid contents in jute mallow than the other temperatures (Figure 5A-5C). Similarly, jute mallow plants in the GC15 significantly (p<0.05) exhibited higher total phenolics of about 0.6-, 1.4-, and 2.2-folds compared to GH24, GC32, and GC20 respectively; flavonoids by approximately 0.7-, 0.4, 1.4-fold compared to GH24, GC32, and GC20 respectively; and proline by approximately 3.0-, 1.7-, and 1.6-folds compared to GH24, GC32, and GC20, respectively (Figures 5D-5F). Phenolic compounds are the most abundant chemical compounds in dietary and medicinal plants [32]. Therefore, the quantification of phenolic compounds in plants is crucial for the selection and development of cultivars with good traits
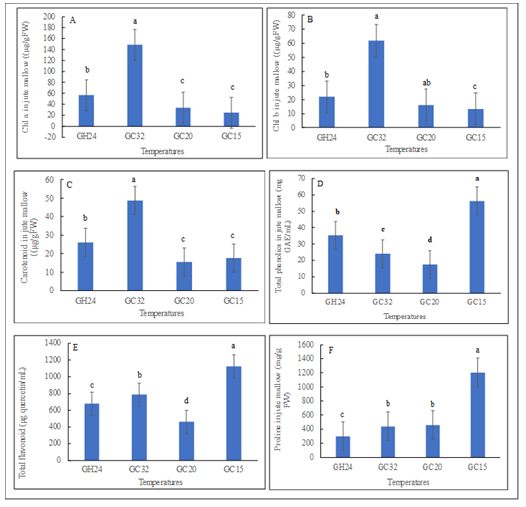
Figure 5: Phytochemical content of jute mallow (Corchorus olitorius) were influenced with variation in temperature; different alphabetical letters mean significant difference between treatment means (N = 4) by Tukey’s honestly significant difference (HSD) test at p ≤ 0.05. Vertical bars represent error bars (N=4). GC32, GC20, and GC 15 represent day/night temperature regimes at 32°/27°C, 20°/15°C and 15°/10°C, respectively; and GH24 represents greenhouse environment (control) at an average temperature of 24°/21°C.
Sánchez-Rangel JC, et al. [33], there are 16 classes of phenolic compounds. However, the essential phenolic compounds for human diet include phenolic acids, flavonoids, lignans, stilbenoids, and tannins [34]. Phenolic compounds have several health benefits including neuroprotective, anti-bacterial, anti-ageing, anti-cancer, anti-diabetic and, cardioprotective activities [34, 35]. Phenolics are also categorized as secondary metabolites and are typically involved in plant defense and environmental communication [36]. In addition, they are associated with plant color, taste, and aroma and play key protective roles by providing defense against abiotic and biotic stresses [37, 38]. In the present study, the gboma and jute mallow plants produced more phenolics and flavonoids at the least temperature of 15°C in the GC15. Proline is another stress response compound, a proteinogenic amino acid, which is responsible for the survival of plants under diverse stress conditions. It has various roles in stress conditions including maintaining cell turgor, source of carbon and nitrogen, chelation of metals, and as a signalling molecule [39]. Findings in the present study suggested that stress was more prominent with plants subjected to the least temperature (GC15), which produced more proline [40, 41].
Conclusion
The complex association between temperature and plant growth, development, and productivity highlights the need for this present study before the introduction of any crops into a new environment. The study contributes to the understanding of how variations in temperature, i.e., low to high temperature, impact the growth, yield, and chemical composition of the harvest gboma and jute mallow fresh produce. It was found that gboma and jute mallow plants can grow well at temperatures between 20° to 32°C. This temperature range optimizes the number of leaves of plants, plant height, stem diameter, and leaf area, which resulted in high yields compared to their counterparts under low temperature. These warm-season tropical vegetables can, therefore, be introduced into temperate regions and grown under a controlled environment or grown in the summer for good yield and quality. The results can be extended to the potential growth responses of other tropical plants under varying temperature regimes. It is recommended that further studies should investigate the mechanism of low temperature adaptation, and to assess proximate composition of these vegetables under varying temperature regimes.
References
-
Calvin K, Dasgupta D, Krinner G, Mukherji A, Thorne PW, et al. (2023) IPCC, 2023: Climate Change 2023: Synthesis Report. Contribution of Working Groups I, II and III to the Sixth Assessment Report of the Intergovernmental Panel on Climate Change, IPCC, Switzerland.
-
Council of Canadian Academies (2019) Canada’s Top Climate Change Risks the Expert Panel on Climate Change Risks and Adaptation Potential.
-
Government of Canada (2019) Canada’s Changing Climate Report.
-
Kwarteng AO, Amoah RA, Nyadanu D, Nyam CK, Ziyaaba JZ, et al. (2018) Core collection of two important indigenous vegetables; Gboma eggplant (Solanum macrocarpon L.) and Jute mallow (Corchorus olitorius L.) in Africa: An important step for exploitation of existing germplasm and development of improved cultivars. Australian Journal of Crop Science 12(9): 1398-1409.
-
Irfan M, Kumar P, Ahmad MF, Siddiqui MW (2023) Biotechnological interventions in reducing losses of tropical fruits and vegetables. Current Opinion in Biotechnology 79: 102850.
-
Ndlova J, Afolayan AJ (2008) Nutritional Analysis of the South African Wild Vegetable Corchorus olitorius. Asian Journal of Plant Sciences 7(6): 615-618
-
Hatfield JL, Prueger JH (2015) Temperature extremes: Effect on plant growth and development. Weather and Climate Extremes 10: 4-10.
-
Ghaafar Abdel C, Sameer Asaad S, Salh Mohammad D (2016) Minimum, optimum, and maximum temperatures required for germination of Onion, Radish, Tomato, and Pepper. International Journal of Farming and Allied Sciences.
-
Andrews CJ (1987) Low-Temperature Stress in Field and Forage Crop Production An Overview. Canadian Journal of Plant Science 67(4).
-
Dahlquist RM, Prather TS, Stapleton JJ (2007) Time and Temperature Requirements for Weed Seed Thermal Death. Weed Science 55(6): 619-625.
-
Dumas Y, Dadomo M, Di Lucca G, Grolier P (2003) Effects of environmental factors and agricultural techniques on antioxidant content of tomatoes. In Journal of the Science of Food and Agriculture 83(5): 369-382.
-
Oh MM, Carey EE, Rajashekar CB (2009) Environmental stresses induce health-promoting phytochemicals in lettuce. Plant Physiology and Biochemistry 47(7): 578- 583.
-
Hyde PT, Setter TL (2022) Long-day photoperiod and cool temperature induce flowering in cassava: Expression of signaling genes. Frontiers in Plant Science 13.
-
Schank JC, Koehnle TJ (2009) Pseudoreplication is a Pseudoproblem. Journal of Comparative Psychology 123(4): 421-433.
-
Abbey L, Rao SA (2017) Differential response of plant species to greenhouse microclimate created by design technology and ambient conditions. Canadian Journal of Plant Science 98(2): 300-308.
-
Linchtenthaler HK (1987) Chlorophylls and carotenoids: Pigments of photosynthetic biomembranes. Methods in Enzymology 148: 350-382.
-
Ainsworth EA, Gillespie KM (2007) Estimation of total phenolic content and other oxidation substrates in plant tissues using Folin-Ciocalteu reagent. Nature Protocols 2(4): 875-877.
-
Chia-Chi C, Ming-Hua Y, Hwei-Mei W, Jiing-Chuan C (2002) Estimation of Total Flavonoid Content in Propolis by Two Complementary Colorimetric Methods. Journal of Food and Drug Analysis 10(3): 178-182.
-
Bates LS, Waldren RP, Teare ID (1973) Rapid determination of free proline for water-stress studies. Plant Soil 39(1): 205-207.
-
Dambreville A, Lauri PÉ, Normand F, Guedon Y (2015) Analysing growth and development of plants jointly using developmental growth stages. Annals of Botany 115(1): 93-105.
-
Angert AL (2006) Growth and leaf physiology of monkeyflowers with different altitude ranges. Oecologia 148(2): 183-194.
-
Slot M, Winter K (2017) In situ temperature response of photosynthesis of 42 tree and liana species in the canopy of two Panamanian lowland tropical forests with contrasting rainfall regimes. New Phytologist 214(3): 1103-1117.
-
Li R, He Y, Chen J, Zheng S, Zhuang C (2023) Research Progress in Improving Photosynthetic Efficiency. In International Journal of Molecular Sciences 24(11).
-
Ofoe R, Qin D, Gunupuru LR, Thomas RH, Abbey L (2022) Effect of Pyroligneous Acid on the Productivity and Nutritional Quality of Greenhouse Tomato. Plants 11(13).
-
Nephali L, Piater LA, Dubery IA, Patterson V, Huyser J, et al. (2020) Biostimulants for plant growth and mitigation of abiotic stresses: A metabolomics perspective. Metabolites 10(12): 1-26.
-
Chen L, Li S, Li Y, Zhang Y, Bai Y, et al. (2023) Comparative Study of Cypripedium Plant Photosynthetic Characteristics from Changbai Mountain. Horticulturae 9(3).
-
Zou T, Zhang J (2020) A new fluorescence quantum yield efficiency retrieval method to simulate chlorophyll fluorescence under natural conditions. Remote Sensing 12(24): 1-23.
-
Kim DH, Son S, Jung JY, Lee JC, Kim PG (2022) Photosynthetic characteristics and chlorophyll content of Cypripedium japonicum in its natural habitat. Forest Science and Technology 18(4): 160-171.
-
Revatipadale R, Mulay JR (2019) Estimation of Chlorophyll Content in Young and Adult Leaves of Some Selected Plants in Non-Polluted Areas. International Journal of Botany and Research 9(1): 21-32.
-
Young AJ, Lowe GL (2018) Carotenoids—antioxidant properties. Antioxidants 7(2).
-
Shin YK, Bhandari SR, Lee JG (2021) Monitoring of Salinity, Temperature, and Drought Stress in Grafted Watermelon Seedlings Using Chlorophyll Fluorescence. Frontiers in Plant Science 12.
-
Cruz-Carrión Á, Ruiz de Azua MJ, Muguerza B, Mulero M, Bravo FI, et al. (2023) Organic vs. Non-Organic Plant- Based Foods—A Comparative Study on Phenolic Content and Antioxidant Capacity. Plants 12(1).
-
Sánchez-Rangel JC, Benavides J, Heredia JB, Cisneros- Zevallos L, Jacobo-Velázquez DA (2013) The Folin- Ciocalteu assay revisited: Improvement of its specificity for total phenolic content determination. Analytical Methods 5(21): 5990-5999.
-
Tarasov A, Stozhko N, Bukharinova M, Khamzina E (2023) Biosensors Based on Phenol Oxidases (Laccase, Tyrosinase, and Their Mixture) for Estimating the Total Phenolic Index in Food-Related Samples. Life 13(2).
-
Kumari S, Manohar S, Kumari P, Krishnan V, Maheshwari C, et al. (2023) The Role of Major Phenolics in Apple to Total Antioxidant Capacity.
-
Hartmann T (2007) From waste products to ecochemicals: Fifty years research of plant secondary metabolism. Phytochemistry 68(22-24): 2831-2846.
-
Van Loon LC, Rep M, Pieterse CMJ (2006) Significance of inducible defense-related proteins in infected plants. In Annual Review of Phytopathology 44: 135-162.
-
Daglia M (2012) Polyphenols as antimicrobial agents. Current Opinion in Biotechnology 23(2): 174-181.
-
Liang X, Zhang L, Natarajan SK, Becker DF (2013) Proline mechanisms of stress survival. In Antioxidants and Redox Signaling 19(9): 998-1011.
-
Hurlbert SH (1984) Pseudoreplication and the Design of Ecological Field Experiments. Source: Ecological Monographs 54(2): 187-211.
-
Millar RB, Anderson MJ (2004) Remedies for pseudoreplication. Fisheries Research 70(2-3): 397-407.
- Enhancement of Vegetative Growth and Fruit Yield in Cucumber (Cucumis sativus L.) via Spiritual Blessing (Biofield) Energy Intervention
- Production of Açaí (Euterpe oleracea Mart.) under Different Agroforestry System Management Intensities in Amazonian Floodplain (Varzea) Forests
- Coffee and the Production Region: What is the Secret to the Expression "Quality"?
- Experiential Agripreneurship Training in Sub-Saharan Africa: Integrating a Business Incubator into Postgraduate Livestock Education at the University of Buea
- Advances in Agricultural High-Quality Development
- Linking Compost Residue to ABAGE in Plants - a Short Note