Biomathematical Modeling in Evaluation Scheme for Large Scale Innovation Competition
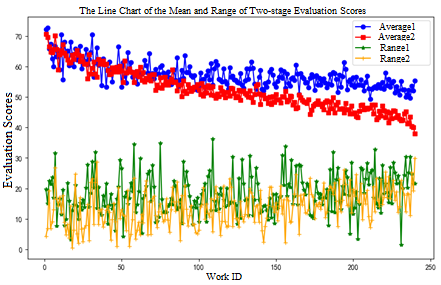
This paper discusses the research on the allocation plan between experts and works in large-scale innovation competitions, establishes 0-1 planning model, Z-score evaluation model, PCA evaluation model, fuzzy evaluation model, "range" model, and difference perception evaluation model. It mainly uses linear programming algorithm and PCCs correlation coefficient to obtain the optimal plan for the allocation of experts and works. We use the method of linear programming to establish a 0-1 planning model with the goal function of maximizing the coverage rate of review experts to participating teams and the number of cross reviews, and sets the constraint condition that each work can be reviewed by 5 different review experts, each expert can review 120 different works, all variables are non-negative integers. An optimal solution is obtained, and the average distance between the review experts and works is calculated as 1439.29893, at this time, the comparability of the review plan is strong. Through analysing the relationship between the original scores of experts and awards for works, the three evaluation models are redesigned: Z-score evaluation scheme, PCA evaluation scheme, fuzzy evaluation scheme. The correlation coefficients between the three plans and the original plan are calculated as 0.94, 0.86, and 0.89 respectively. Therefore, it can be seen that the Z-score evaluation scheme is better than the other two schemes. We have designed a new standard score calculation formula to better reflect the level of an article in the overall work, to calculate the ranking of scores, and analyzed it with the actual ranking of award-winning papers agreed upon by multiple experts. The correlation is 96.32%, indicating that the new standard score formula is reliable. By calculating and analysing the average score and range of two stages of reviews, it is found that the average score and range of the first stage are significantly higher than those of the second stage. The reason may be that the experts in the second stage require stricter standards, and their evaluations are more uniform, which can more accurately evaluate works and eliminate differences in scores among different experts. Therefore, it is more reasonable to adopt two stages for review. For those works with excessively large range outside the low range, this paper establishes a "range" model so that these works can be processed programmatically. Through this model, it is concluded that works with large range values have a connection with awards. Based on the method of differential decisionmaking, we established a complete innovation competition evaluation model - difference perception evaluation model. This model innovatively integrates the characteristics of multiple reviews and the differences between expert judges, can quickly output the final results, and calculates MSE as 0.24 and R² as 0.99 by evaluating and testing the model. The results show that the model can effectively improve the quality and efficiency of the review. At the same time, it makes a preliminary comparison and analysis of current review methods and provides suggestions and ideas for future review methods and processes
Introduction
Innovation competitions can stimulate students’ team spirit, problem-solving skills, and scientific thinking. However, in the judging process, there are many challenges such as the large number of works, the uneven quality, and so on. The significance of the research on the evaluation scheme of the innovation competition [1] First, it provides innovative ideas and methods for evaluation experts to minimize the scoring error. Secondly, it can provide the organizer with new evaluation standards, provide fair and transparent evaluation results, and enhance the credibility of the event. Provide new data and models for research related to innovation competitions [2], and promote the development of innovation competitions.
To address challenges of large-scale innovation competitions, researchers have proposed various evaluation strategies. In the early stages, subjective judgment methods were mainly used. This approach saves time during the evaluation process but may be influenced by individual preferences. On this basis, standardized evaluation rules were introduced to reduce some subjectivity. Currently, competitions are optimizing their own evaluation plans and attempting to use various integration strategies to improve evaluation quality. Xu Z, et al. [3] used multi-attribute decision-making methods to consider factors such as expert reviewer numbers and submission quality, weighting each factor to enhance fairness in the evaluation. Zhuang S, et al. [4] employed hierarchical analysis (AHP) [5] and fuzzy evaluation methods to prove that increasing the number of reviewers and submissions has a positive impact on evaluation results. Wang F, et al. [6] proposed a data-driven evaluation method [7] using data analysis to assist decision- making. Although these current evaluation methods have made progress, they still face significant challenges in optimizing the evaluation plan for large-scale innovation competitions [8].
The purpose of the evaluation scheme of the large- scale innovation competition is to evaluate the quality and innovation of the works of different reviewers fairly and scientifically [9]. To achieve these goals, the following models are established: the 0-1 plan model, the comprehensive review model, the “scope” model [10, 11, 12], and the difference perception evaluation model.
Methods
We have employed four methods to address different issues in evaluating large-scale innovative competitions, and method two contains three sub-methods [13]. The following is the model analysis corresponding to each method.
0.1 Programming Model Analysis
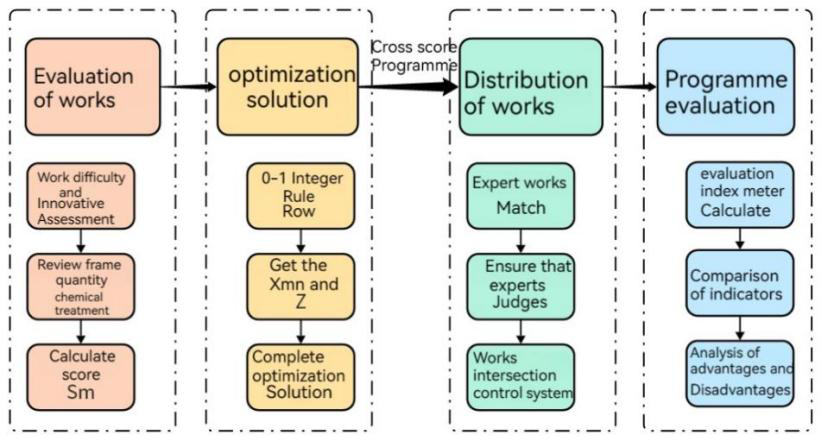
We can first set an optimization goal for the evaluation plan, such as minimizing the scoring differences among evaluation experts or maximizing the intersection of evaluations by experts [14]. Next, we can use linear [15, 16, 17] programming algorithms to find the optimal or approximate optimal evaluation plan in the feasible solution space. Finally, we can design relevant indicators.

Comprehensive Review Model will affect the optimization of 0-1 Programming Model’s “cross distribution” plan. We can select two or more evaluation plans, such as Z-score evaluation [18], PCA evaluation [19, 20], and fuzzy evaluation [21, 22, 23] and analyse the distribution characteristics of each expert’s original scores, adjusted scores, and the characteristics of work rankings under different plans using the data in the attachment. Furthermore, we can compare these plans based on the analysis results and design a new standard score calculation model [24].
“Range” Model analysis: In addressing “Range” Model, it is important to note that while range is an important indicator to measure rating differences and innovation, it cannot solely determine the quality of works based on its magnitude [25].

Difference Perception Review Model Analysis: Addressing Difference Perception Review Model requires consideration of the completeness and systematicity of innovative competition evaluations [26].

Model Assumptions
Based on the issues raised in this paper and the analysis above, we have made the following model assumptions:
- It is assumed that the data provided are reliable and accurate
- It is assumed that the evaluation levels of the experts involved are comparable
- It is assumed that the experts are evaluating in the same environment without any external factors interfering with their evaluation
- It is assumed that the experts’ evaluations are relatively objective, unaffected by other factors, and only related to the quality and innovation of the work
Symbol Description
The commonly used symbols are shown in the following table, and other symbols are described in each chapter of the paper.
| Parameter symbols | Parameter Meaning |
|---|---|
| Z ij | Standardized scoring |
| X std | The standard deviation between the original score and the standard score in the first evaluation |
| I | Indicator function |
| S ij | Original rating matrix |
| PCA | principal component analysis |
| σ i | Standard deviation of the first reviewer |
| ω | Rating weight of evaluation experts |
| µ( x) | Membership degree |
| A | fuzzy set |
| B | Comprehensive fuzzy set |
| R j | Extremely poor performance of the j-th work |
| T j | Comprehensive rating of the first work |
| P j | Ranking of the j-th work |
| S i | Average score of the first evaluation expert |
| α | Extreme threshold |
| β | Threshold for comprehensive evaluation |
| Score | Comprehensive standard score |
| R* i | Adjusted range |
| T* j | Adjusted comprehensive score |
| γ | Adjusted proportion |
| MSE | Mean square error |
| R2 | Coefficient of determination |
| r | Pearson correlation coefficient |
Table 1: Symbol Description Table.
Experiments
In this section, we model and solve the four methods through experiments, which are divided into four subsections.
0-1 Programming Model
We should firstly deal with the number of intersections of works and the comparability of scores under the fixed number of participating teams, judges, and the number of judges for each work [27, 28, 29, 30]. A 0-1 programming model is established to optimize the intersections of works among judges [31, 32]. This subsection mainly focuses on the establishment, solving, and analysis of the 0-1 programming model.
Establishment of the 0-1 Programming Model: The objective of this model is to optimize the intersections of works among judges, that is, to make the intersections of works as large as possible and to increase the comparability of scores. The constraints are:
Each work is judged by exactly judges:
1 # n mn x D = = ∑ (1)
125 Where = 1, 2, ...,3000. Each judge must judge exactly C works:
1 # m mn X C = = ∑ (2)
3000 Where = 1, 2, ...,125. If the set of works judged by the nth and the q-th judges have an intersection, then Ynq=1,otherwise Ynq=0, that is { } : 1,2, ,3000 nq mn mq Y max X X m = = … (3) Where n,q = 1, 2, ...,125, n≠q.
Solution and Analysis of the Model Design of Calculation Methods and Determination of Parameters
- Design of Calculation Methods:
- Review Coverage Rate: The proportion of experts who have been reviewed for each work, that is, the higher this indicator, the more review opinions each work receives, and the higher the fairness.
# 125 D × (4) • Review Overlap Rate: The ratio of the intersection between the works reviewed by each expert and the works reviewed by other experts, that is, the higher this indicator, the more intersections between the reviewed works and the higher the comparability of ratings.
# 125 125 2 Z × × ÷
(5) • Evaluation Balance: The balance between the difficulty and innovation of the works reviewed by each expert, i.e.
125 3000 2 1 1 1 1 ( ) # 125 mn m n m X S S C = = − ∑ ∑ (6)
Where it refers to the score of difficulty and innovation for the m-th work, and the average score of difficulty and innovation for all works.
# m S S × (7) Modeling this problem as a combinatorial optimization problem [33, 34], using the linear programming algorithm to solve the 0-1 integer programming problem, the steps are as follows: • Determination of key variables: Define a binary variable that represents the review expert number and the work number.
( ) ( ) , , # x n m nmnmx n m nm× (8)
• Add Constraint Conditions: Limit the maximum number of works that can be reviewed by each review expert: for all of these constraints, ensure that each review expert does not exceed the maximum number of works.
( ) , # e m x n m en × ≤ × ∑ (9)
• Each work needs to be reviewed by a peer reviewer: The following constraints can be used to ensure that all works are reviewed by peer reviewers.
( ) , # f n x n m fmf × = × ∑ (10)
• Parameter Determination: xmn as a 0-1 variable, it represents the status of the m-th work being reviewed by the nth expert, where m = 1,2, 3000, n = 1, 2, 125. Ynq as a 0-1 variable, represents the intersection state of the collection of works reviewed by the nth and q-th experts, where n, q = 1,2, 125, n ≠ q. Z as an integer variable represents the total number of intersections of all expert reviewed work collections, i.e.
# nq n m Z Y < = × ∑ (11)
C as a constant, it represents the number of works reviewed by each expert, i.e.
3000 5 120 # 125 C × = = × (12)
D as a constant, it represents the number of experts evaluated for each work, i.e. D=5
| Parameter Symbols | Symbol Category | Parameter Meaning | Value Range |
|---|---|---|---|
| X mn | 0-1 variable | Has the m-th work been reviewed by the nth expert | m=1, 2, …,3000; n=1,2,…,125 |
| Y nq | 0-1 variable | Is there an intersection between the collection of works reviewed by the nth and q-th experts | N, q=1, 2, ..., 125; N ≠ q |
| Z | Integer variable | The total number of intersections between the collection of works reviewed by all experts | Z =∑ Y n <m nq |
| C | constant | Number of works reviewed by each expert | 3000 ×5 C = =120 125 |
| D | constant | Number of experts reviewed for each work | D= 5 |
Table 2: 0-1 Programming Model Parameter Table.
Result Analysis
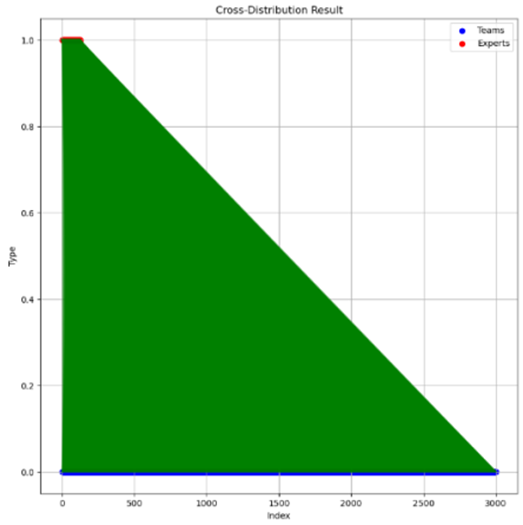
Based on the analysis of the results, the model has successfully achieved an optimal “cross-distribution” scheme. The average distance between the evaluation experts and the work is 1439.29893. We can find that each reviewer reviewed 120 works, each of which was reviewed by 5 experts, and there were no duplicate reviews.
Comprehensive Review Model
To solve the problem that the assumption of the standard score evaluation scheme may not hold, an improved comprehensive evaluation model was established [35, 36]. Data Preprocessing: This section performed corresponding processing on data 1.
Establishment of Comprehensive Review Model Z-score Evaluation Model
The raw scores were standardized, the influence of dimensions and scales on the scores was eliminated, and the scores of different evaluation experts were compared and ranked S S Z σ − = (13) ij j ij i Where Sij denotes the original score, iS denotes the average score of the i-th reviewer, σi denotes the standard deviation of the i-th reviewer, and Zij denotes the standardized score.
Then, the standardized scores of each work on each reviewer are summed up to obtain the comprehensive score:
j ij i T Z = =∑ (14)
1 # m Where Tj denotes the comprehensive score of the j-th work, Z_ij denotes the standardized score of the _i-th reviewer for the j-th work, and m denotes the number of reviewers.
According to the size of the comprehensive score, the works are sorted to determine their final ranking:
( ) 1 # m j j k i R I T T = = − ∑ (15)
where Rj denotes the ranking of the j-th work, Tj denotes the comprehensive score of the j-th work, I denote the indicator function, which takes the value 1 when the condition in the parentheses is satisfied, and 0 otherwise, and n denotes the total number of works.
PCA Evaluation Model • Data preparation: Data pre-processing obtains a raw matrix with a size of m×n, where m represents the number of works and n represents the number of experts.
( ) 1 # = + = ∑
n s ij ij j i X X X n
(16) where Xij denotes the original score of the i-th work by the j-th expert. s ij X denotes the standard score of the i-th work by the j-th expert, and i X denotes the average value calculated in the review process.
Next, calculate the highest and lowest scores of each work in the first review:
, 1 # n i max j ij X max X = = (17)
, 1 # n i min j ij X min X = = (18)
Where Xi,max denotes the meaning of the highest review score obtained by the i-th work in the review process, Xi,min denotes the lowest score of the i-th work in the review process.
Finally, calculate the range of each work in the first review process:
, , # i i max i min R X X = − (19)
Using the same calculation method, the corresponding average and range of the second review process can be calculated, and the specific calculation process is consistent with the above.
Principal component analysis: First, calculate the standard deviation of each work in the first review original score and standard score:
1 # 1 m ( )
2 std i i X X X m = = − −∑ (20)
1 Where m denotes the total number of works data, Xi denotes the score value of the i-th team’s work, X denotes the average value of all team data, and Xstd denotes the standard deviation of the work review.
Next, calculate the standard deviation of the original score and the standard score of the second review, and the specific calculation process is consistent with the method of the first review process.
Finally, according to the PCA principle [37, 38, 39, 40], calculate the principal components of the first and second reviews, to facilitate the subsequent calculation of the comprehensive standard score, and the specific calculation of the principal components is:
n = × =∑ (21)
1 1 # j j j PC w X
Where PC1 is the first principal component, and similarly, the second review result can be obtained as the second principal component for subsequent calculation and evaluation, that is, PC2 is the first principal component.
Calculate the comprehensive standard score:
1 2 # Score PC PC α β = × + × (22)
where Score is the comprehensive standard score, α and β are adjustable weight factors. • Sorting: By calculating the comprehensive standard score, reorder them in descending order to determine the final ranking of the scores.
Fuzzy Evaluation Model
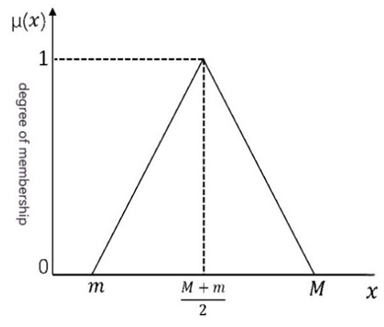
Based on the principle of fuzzy evaluation scheme, we constructed a mathematical model, which contains the following main parts: Part 1: We regard the evaluation result of each work as a fuzzy set, which is formed based on the scores of the evaluation experts [41, 42, 43, 44]. The score is x, the maximum value of the score is M, and the minimum value of the score is m:
0, x m < − + ≤ ≤ − = × − + ≤ ≤ − >
x m M m m x M m x M x M m x M M m x M
, 2 # , 2 0,
( ) µ (23) The membership function graph of the triangular fuzzy number is as follows:
If the distribution of scores is asymmetric, we can consider using the membership function of trapezoidal fuzzy numbers:
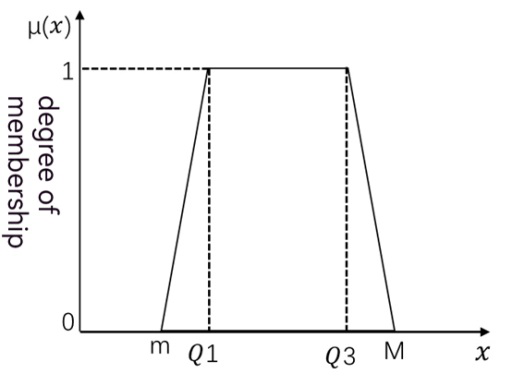
Let x be the score, M be the maximum score, m be the minimum score, Q_3_ be the upper quartile of scores, and Q_1_ be the lower quartile of scores.
x m m x Q Q m Q x Q x M x Q x M M Q x M
− < ≤ − ≤ ≤ = × − ≤ ≤ − >
, 1 1 1 , 1 3 # , 3 3 0,
(24) ( ) µ (24) Part 2: Using fuzzy mathematics [45]. The fuzzy set of the work is recorded as A, the weight of the evaluation scores given by the evaluation experts is w, and the comprehensive fuzzy set is B.
n = = × ∑ (25)
1 # i i i B w A
Part 3: Multiply the membership degrees of each rating by their respective weights, and then add them up to obtain the composite membership degree.
1 # i n w i i B A
= = × ∏ (26) Part 4: Sorting Method for Composite Fuzzy Set of Works: Using fuzzy mathematics [46], sort each work’s composite fuzzy set to determine the work’s ranking. The composite fuzzy set of the work is B, and its membership degree function is μB (x).
( ) B max x µ (27)
( ) B x X x µ ∈∑ (28)
Solution and Analysis of Comprehensive Review Model Design of Calculation Methods and Determination of Parameters
- Design of Calculation Methods for Z-Score Evaluation Model: The determination of key variables: refers to the original rating of the i-th reviewer on the j-th work, refers to the standardized rating of the i-th reviewer on the j-th work, refers to the comprehensive rating of the j-th work, refers to the ranking of the j-th work, m refers to the total number of reviewers, n refers to the total number of works, refers to the average rating of the i-th reviewer, and represents the standard deviation of the i-th reviewer.
- Standardized Rating:
S S Z σ − = (29)
# ij j ij i
1 1 n n Where ( )
2 = = = = − ∑ ∑ ,
i ij i ij i j j S S S S n n σ
1 1 • Comprehensive Rating: Calculate the sum of ratings for each work on all reviewers, i.e.
j ij i T Z = = × ∑ (30)
1 # m • Ranking: Sort works based on their overall rating, i.e.
( ) 1 # n j j k k I T T R = = − ∑ (31)
Where I represents the indicator function, which takes a value of 1 when the condition in parentheses is true, otherwise it is 0.
• PCA Design of Calculation Methods
For the Fuzzy Evaluation Model, convert the scores of each evaluation expert into fuzzy numbers, establish a fuzzy evaluation matrix, determine the weight vector of evaluation indicators, calculate the fuzzy evaluation vector, and finally sort the works based on the size of the fuzzy numbers.
For the Z-Score Evaluation Model, the parameters are determined as follows:
- Number of review experts m: m = 8.
- The total number of works n: n = 352. (Works entering the second round)
- Original score: The original score is an 8 × The matrix of 352, where each element takes an integer value between 0 and 100, represents the i-th evaluation expert’s rating of the j-th work. Sij
- Ranking: Sort works based on their overall rating, i.e.
( ) 1 # n j j k k I T T R = = − ∑ (32)
Where I is 0 or 1
| Parameter Symbols | Symbol Category | Parameter Meaning | Value Range |
|---|---|---|---|
| M | Integer variable | Total number of review experts | m=8 |
| N | Integer variable | Total number of works | n=351 |
| S ij | matrix | The original rating was an 8 × Matrix of 351 | Values for each element range from 0 to 100 |
| Rj | Integer variable | ranking | R =∑n I (T −T ) j k =1 j k |
| I | 0-1 constant | Indicator function | 0 Or 1 |
| σ i | variable | Refers to the standard deviation of the i-th evaluation expert | Greater than or equal to 0 |
| T j | variable | Refers to the standardized rating of the j-th work by the i-th evaluation expert | =∑m T Z , j i=1 ij |
Table 3: Z-Score Evaluation Model Parameter Information Table.
| Parameter symbols | Parameter Meaning | |
|---|---|---|
| X mn | Has the first work been reviewed by the first expert | |
| Y nq | Is there an intersection between the collection of works reviewed by the nth and q-th experts | |
| Z | The total number of intersections between the collection of works reviewed by all experts | |
| C | Number of works reviewed by each expert | |
| D | Number of experts reviewed for each work | |
| X | Original data matrix, size, where represents the number of works and represents the number of experts | |
| X ij | Original score of the first work rated by the first expert | |
| Xs ij | The standard score for the first work rated by the first expert | |
| X i | The average of the original and standard scores for the first review of the work | |
| X i,max | The highest score for the first review of the first work | |
| X i,min | Lowest score for the first review of the first work | |
| R i | The first review of the first work was extremely poor | |
| X std | The standard deviation between the original score and the standard score for the first evaluation of all works | |
| PC 1 | The first principal component | |
| PC 2 | Second principal component | |
| α | Weights for the first review | |
| β | Weights for the second review | |
| Parameter Symbols | Parameter Meaning | Value Range |
| µ( x) | Membership degree | 0-1 |
| m | Minimum score | 0<m<M |
| M | Maximum score | m<M |
| x | score | Greater than 0 |
| ω | Rating weight of evaluation experts | 0-1 |
| A | fuzzy set | 0-1 |
| B | Comprehensive fuzzy set | B=∑n w A i=1 i i |
Table 4: PCA Evaluation Model Parameter Information Table.
Result Analysis • Z Score Evaluation Solution: Based on the original rating, calculate the average rating and standard deviation for each reviewer, and then calculate the standardized rating for each work.
. ij i ij i S S Z σ (33)
Calculate the comprehensive rating for each work based on standardized ratings.
# ij j Z T × (34)
Calculate the ranking of each work based on the comprehensive rating.
# j j T R × (35)
• Fuzzy Evaluation Solution According to the fuzzy evaluation vector, the evaluation objects are sorted according to the size relationship of the fuzzy number, and the final order of the evaluation objects is obtained.
# Bq × (36)
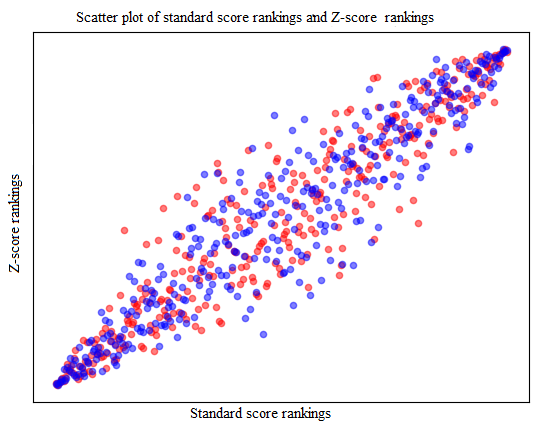
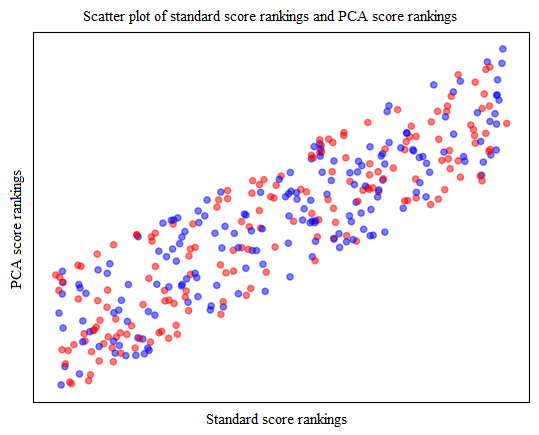
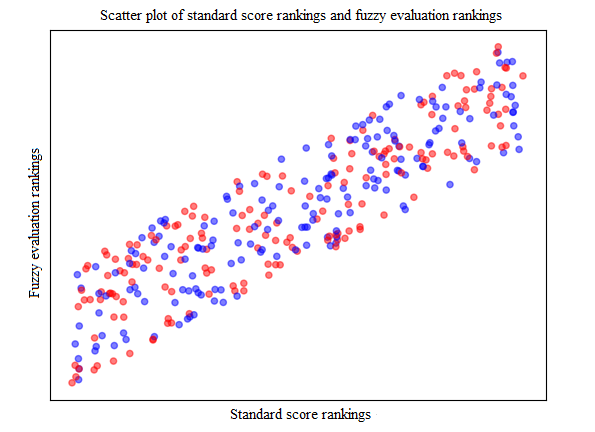
By calculating the rankings of the Z-score model, PCA model, and fuzzy evaluation scheme, and comparing them with the traditional standard score evaluation scheme, as shown in Figures 12,13 and Table 5, the Z-score evaluation scheme has a significantly higher correlation with the traditional standard score evaluation scheme compared to the PCA evaluation scheme and fuzzy evaluation scheme.
| Comparison Of Evaluation Plans | Correlation Coefficient (To Two Decimal Places) |
|---|---|
| Traditional Standard Score Scheme and Z-score Evaluation Scheme | 0.94 |
| Traditional standard sub scheme and PCA evaluation scheme | 0.86 |
| Traditional Standard Classification Scheme and Fuzzy Evaluation Scheme | 0.89 |
Table 5: Comparison of Evaluation Schemes.
Designing a New Standard Score Calculation Model
Firstly, we assume that each expert gives an original score for each work, representing their subjective evaluation of the quality. We use aij to represent the original score given by the i-th expert for the j-th work.
Secondly, we consider the objective evaluation of each expert on the quality of the work. We use bij to represent the objective score given by the i-th expert for the j-th work. The objective score is calculated by dividing the original score by the average original score of the expert’s evaluated works and then multiplying by the original score, expressed as:
a b a E a = × (37)
( ) # ij ij ij ij
Where E(aij) represents the expected value of the scores given by the i-th expert to all works.
Thirdly, we consider the comparability of each work among different experts, which refers to its relative position in the works evaluated by different experts. We use Cij to represent the comparable score given by the i-th expert for the j-th work. The comparable score is calculated by subtracting the minimum original score of the expert’s evaluated works from the original score and then dividing by the difference between the highest original score and the lowest original score of the expert’s evaluated works, ( ) ( ) ( ) min # max min a a c a a a − = × × − ij ij ij ij ij ij (38) Finally, we comprehensively consider the above three aspects to give a standard score for each work under evaluation by each expert. We use dij to represent the standard score given by the i-th expert for the j-th work:
( ) ( ) ( )
min max min a a a a a E a a a d
− × + × − =
ij ij ij ij ij ij ij ij ij
( ) (39)
2 We analyzed and compared this final score with the actual award-winning paper ranking agreed upon by multiple experts, and found that the rank correlation difference of this new standard score formula was 96.32%. This shows that the new standard score formula is reliable.
Range Model
To address the issue of extreme variability in large-scale innovation competitions [47, 48, 49], this section establishes a programmatic “range” model.
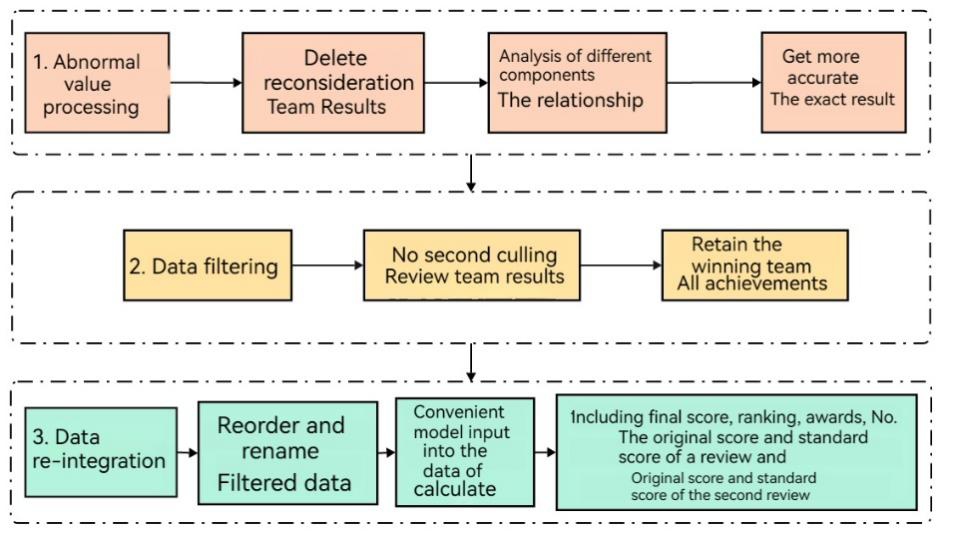
Data Preprocessing
To facilitate data reading and calculation, the first stage 5 experts rating and the second stage 3 experts rating data in data 2.1 and data 2.2 are split into separate table data.
Establishment of the “Range” Model
- Determination of key Variables: Sij denotes the original score of the i-th review expert for the j-th work, Zij denotes the standardized score of the i-th review expert for the j-th work, Rj denotes the range of the j-th work, Tj denotes the comprehensive score of the j-th work, Pj denotes the ranking of the j-th work, m denotes the total number of review experts, n denotes the total number of works, iS denotes the average score of the i-th review expert, σi denotes the standard deviation of the i-th review expert, α denotes the range threshold [50], β denotes the comprehensive score threshold.
- Standardized Score S S Z σ − = (40) ij i ij i i ij j S S n = = ∑ , 2 1 1 ( ) n Where 1 1 n i ij i j S S n σ = = − ∑
- Range: Calculate the difference between the maximum and minimum values of the scores of all review experts for each work, that is,
1 1 # m m i i ij i ij R max Z min Z = = = − × (41)
• Comprehensive Score [51]: Calculate the sum of the scores of all review experts for each work, that is, i ij i Z T = =∑
1 . m • Ranking ( ) 1 # n
j j k k P I T T = = ≥ ∑ (42)
where ‘I’ takes 0 or 1. • Classification: According to the range and comprehensive score, the works are divided into four categories, namely: high score and high range, high score and low range, low score and high range, low score and low range.
For the absolute value of the difference between the standardized score and the comprehensive score of the review expert, that is, j ij j R Z T − > (43) # 2
It is considered that the score of the review expert deviates from the score of other review experts and needs to be adjusted. Let the standardized score of the review expert approach the comprehensive score by a certain proportion, that is, ( ) * 1 # ij ij j Z Z T γ γ = − + (44) Where * ij Z represents the standardized score after adjustment, γ represents the adjustment ratio, and can try to take 0.5 first. After adjustment, recalculate the range and comprehensive score of the work. The adjusted range, that is, * * * 1 1 # m m i i ij i ij R max Z min Z = = = − (45) the adjusted comprehensive score, that is, j ij i T Z = =∑ (46) * * 1 # m Solution and Analysis of the Model Design of Calculation Methods and Determination of Parameters • Design of Calculation Methods: Calculate the average score and standard deviation of each reviewer based on the original score, and then calculate the standardized score for each work [52, 53, 54].
According to the range and comprehensive rating of the works, they are divided into four categories. For works with high scores and large range, the deviation score is adjusted by half towards the direction of the comprehensive rating according to the adjusted proportion, and the standardized score, range and comprehensive rating are obtained. Then the works are sorted according to the comprehensive rating or ranking.
- Parameter Determination: Number of evaluation experts: The number of evaluation experts in the first stage is 5, and the number of evaluation experts in the second stage is 3, that is, mm1=5, m2=3.
- Total Number of Works: (Attachment Data 2.1) nn=240. Original rating: The original rating is an 8240 matrix with elements ranging from 0 to 100, which refers to the rating of the first work by the first reviewer.
- Threshold of Range: The range threshold is set to 2, which means that when the range of the work is greater than or equal to 2, it is considered that the range of the work is too large and needs to be adjusted. αα=2
- Threshold of Comprehensive Evaluation: The threshold of comprehensive evaluation is set to 0, which means that when the comprehensive evaluation of a work is greater than or equal to 0, it is considered that the work has high innovation and belongs to a high segment. Otherwise, it belongs to a low segment. ββ=0
- Adjustment Ratio: The adjustment ratio is 0.5, which means that when the working range is too large, the deviation score will be adjusted halfway towards the direction of the comprehensive score. γγ=0.5.
| Parameter Symbols | Parameter Meaning |
|---|---|
| S ij | Refers to the original rating of the work by the first reviewer |
| Z ij | Refers to the standardized rating of the work by the first reviewer |
| R j | Refers to the extreme difference in the first work |
| T j | Refers to the comprehensive rating of the first work |
| P j | Refers to the ranking of the first work |
| M | Refers to the total number of review experts |
| N | Refers to the total number of works |
| S i | Refers to the average score of the first reviewing expert |
| σ i | Refers to the standard deviation of the first reviewer |
| α | Refers to the threshold of the range |
| β | Refers to the threshold of the comprehensive score |
Table 6: Range Model Parameter Information Table
Result Analysis
By adjusting the threshold of the comprehensive rating β and adjusted proportions γ the model was revised and the final work with a “large range” score selected by the model had an award rate of over 95%, proving the effectiveness of the model.
Difference Perception Review Model
This section mainly focuses on the establishment of the optimized complete model, as well as data preprocessing, the establishment of the difference perception review model, solving and analysing the model, and model verification.
Data Preprocessing
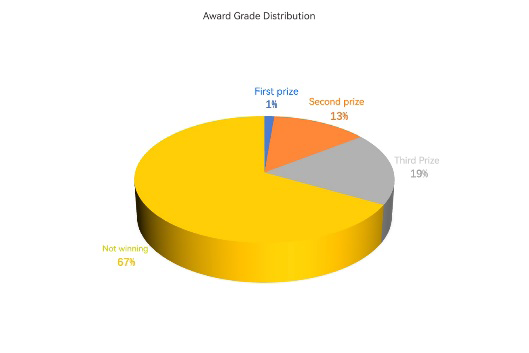
To better construct the model and train it, we conducted statistical analysis on the number of people who won each award level and the total number of teams in the original data.
Establishment of the Difference Perception Review Model: This section proposes a Difference Perception Review Model that can calculate scores and rank entries based on input raw data, outputting the final ranking results. The specific implementation steps of the Difference Perception Review Model [55, 56, 57] are as follows:
Step 1: Input the dataset to be ranked. Step 2: For the input data, first calculate the standard scores of all first review scores. The specific formula can be expressed as:
S S Z σ − = (47)
# ij j ij i
1 1 # n i ij j S S n = = ∑
(48)
1 1 # n ( )
2 i ij i j S S n σ = = − ∑ (49)
Let’s assume there are m teams in total and then we evaluate the remaining (m-n) teams. We directly evaluate the first a teams as third-place winners, and all remaining teams as unsuccessful. The parameters m, n, and a are calculated during the data statistics section.” Step 3: For the teams entering Stage 2 evaluations, we first differentiate them based on the range difference scores from Stage 2 reviews. If the range difference score is greater than a threshold δ (in our model, δ = 20), then the overall final score is equal to the weighted sum of the average score S1 from the first review, the standard scores S_2_ from the second review, and the average score S_3_ from the original scores in Stage 2. The specific process can be expressed using a formula:
1 2 3 Score S S µ S α = × + + × (50)
( ) 1 / 3 S A B C D E = + + + + (51)
2 S E F G β γ ε = × + × + × (52)
( ) 3 / 3 S M N Q = + + (53)
Step 4: In this model, A, B, C, D, and E represent the standard scores calculated by the first five experts during the first review, H, F, and G represent the standard scores calculated by the three experts during Stage 2, M, N, and Q represent the original scores given by the three experts during Stage 2. α, μ, β, γ and ε are all weight factors, and their sum is equal to 1. The specific weight values can be obtained from model training. The optimal value for alpha is 0.6, while μ, β, γ and ε are all set to 0.1. If the range difference score is greater than the threshold δ,the final score is equal to the weighted sum of the average score S1 from the first review, the standard scores S2 from the second review, and the average score S3 from the original scores in Stage 2. The specific process can be expressed using a formula:
1 4 5 Score S S µ S α = × + + × (54)
4 S H F G β γ ε = × + × + × (55)
( ) 5 / 3 S J K L = + + (56)
where J, K, and L represent the review scores given by the three experts in Stage 2.
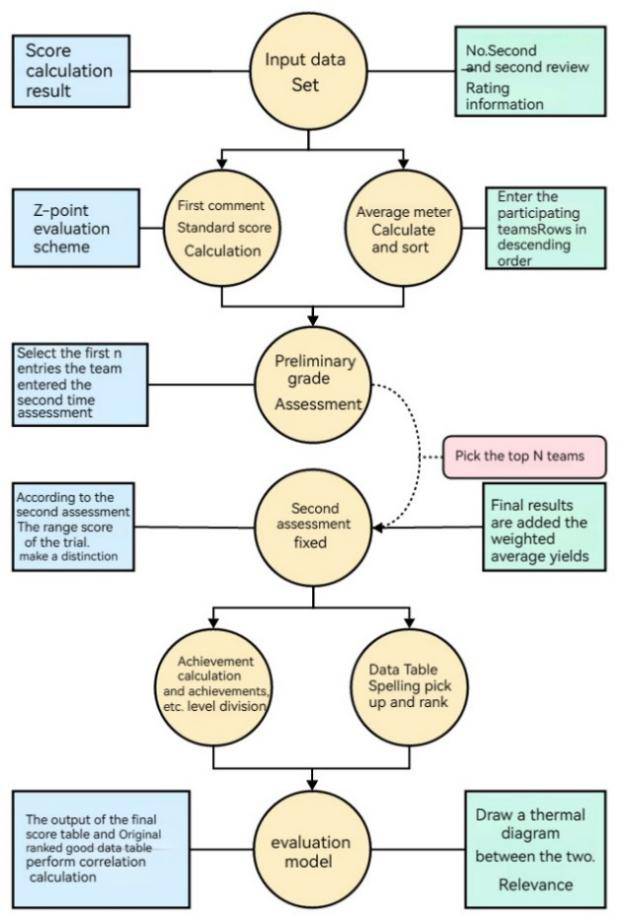
Step 5: Subsequently, the teams that will undergo the second evaluation are arranged in descending order of their final scores, and the performance grades are divided based on these scores. Each grade is then further divided by the number of teams in it. Finally, the data tables for the teams that have gone through both the first and second evaluations as well as those that only went through the first evaluation are combined into one data table, sorted, and outputted. The final score sheet for this model is also outputted. Step 6: We calculate the correlation between the output score sheet and the original data table that was arranged correctly. We then plot a heat map to visualize and evaluate the degree of correlation between them.
Solution and Analysis of the Model Design of Calculation Methods and Determination of Parameters:
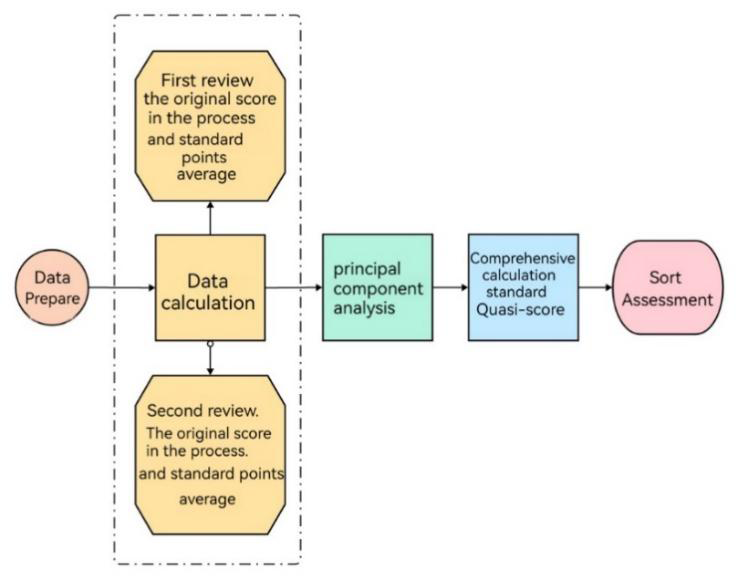
The Difference Perception Review Model mainly includes three main parts: data pre-processing, model design, and model evaluation. The specific details and ideas of model design can be seen in Figure 16.
• Parameter Determination: In the Difference Perception Review Model, the main parameters we need are expert ratings A, B, C, D, E, F, G, H, and weight parameters provided in two stages α, µ, β, γ, ε.
| Para meter Symbols | Parameter Meaning |
|---|---|
| N | Number of teams entering the second evaluation |
| M | Total participants |
| A | Number of teams directly rated as third prize |
| δ | Range scores greater than a threshold |
| S2 | Standard score given by three experts in the second stage |
| S3 | The average of the original scores in the second stage |
| A, B, C, D, E | Stage one standard score |
| H, F, G | Second stage standard score |
| M, N, Q | The second stage works original points |
| α, µ, β, γ, ε | Weighting factor |
| J, K, L | Review points given by the three experts in the second stage |
Result Analysis
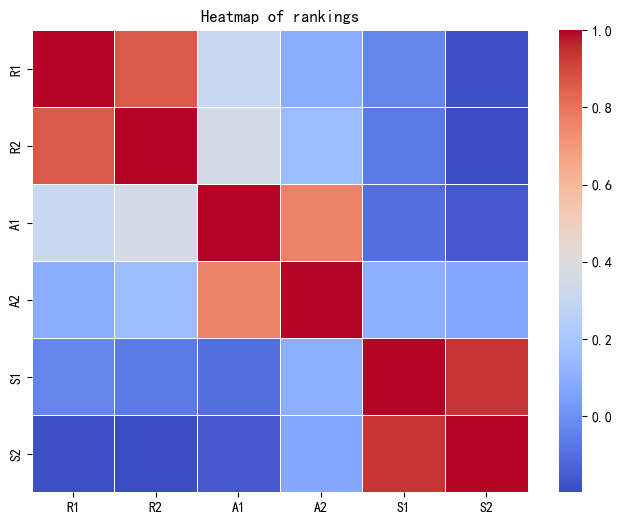
Figure 17 is a heat map drawn based on the original ranking results and some indicators of the Difference Perception Review Model. R1, A1, and S1 represent the ranking, awards, and final scores in the original results, while R2, A2, and S2 represent the ranking, awards, and final scores in the output results of the Difference Perception Review Model. Overall, the data after the original ranking has a high correlation with the output data of our model, indicating the feasibility of the calculation method adopted by the Difference Perception Review Model.
What further data needs to be collected in the future, I believe, can include the following aspects: Review the professional direction, research background, review experience and other information of the experts; more detailed information about the author of the work; a list of records for the review process; the collection of opinions after the evaluation cycle.
Model Validation
The difference perception review model is the complete review model [58]. To more comprehensively evaluate the performance of this model, this section carried out a model test.
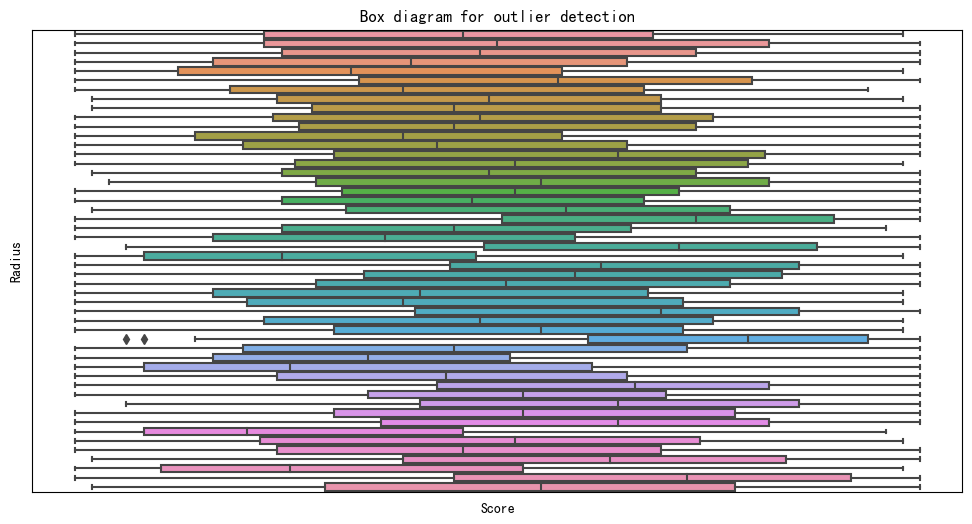
The box plot in Figure 18 shows that the distribution of data in this graph is relatively uniform, with relatively few outliers. As we know, the smaller the MSE, the better the fit of the model. The R² value can be used to measure the model’s ability to explain variance. The closer R² is to 1, the better. We calculated the mean squared error of the model and obtained a result of MSE = 0.24 and a decision coefficient of R² = 0.99 (rounded to two decimal places). Based on these results, we can find that the difference perception review model has good fitting ability and stability.
Conclusion
The main difference between the 0-1 planning model and other models is that it maximizes the intersection of works among review experts as the optimization objective, while other models usually minimize the difference in works among review experts as the optimization objective. The comprehensive review model synthesizes the advantages of Z-score evaluation models, PCA evaluation models, and fuzzy evaluation models [59, 60]. The “Range” model [61] considers factors such as difficulty, innovation, expert ratings, and evaluation criteria for a work comprehensively, compared to other models that typically focus only on work ratings and differences or expert ratings and tendencies, without fully considering the interrelationships and impacts between works and experts.Improvement directions for these models include considering data mining or data analysis methods; considering multi-objective optimization or multi-criteria decision-making methods to comprehensively consider the intersection and difference of works among review experts and their rating levels and evaluation standards [62]; considering fuzzy mathematics or uncertainty theory methods to handle rating uncertainty and fuzziness. The given text discusses the potential applications and benefits of a proposed judging scheme for large-scale innovation contests. It suggests that this scheme could lead to more equitable and accurate results in various assessments and evaluations, such as art tests, multi-level exams, and public official elections. The main advantages highlighted are the enhancement of impartiality, consistency, and objectivity.
The text also acknowledges that organizing large- scale innovation competitions is a complex task influenced by many interrelated factors. The focus of the paper is on minimizing subjective factors that affect the scoring of entries, with solutions specifically aimed at resolving issues related to controversial entries.
To draw broader conclusions and plan future works, the following steps could be considered:
- Expand the Scope of the Study: Investigate the applicability of the judging scheme to different types of contests and assessments beyond innovation contests.
- Factor Analysis: Conduct further research into additional features that may influence the outcome of competitions. This could include the impact of contest design, participant demographics, or criteria transparency.
- Improve the Judging Scheme: Continuously refine the judging scheme based on feedback and data from implemented contests to improve its effectiveness and fairness.
- Quantitative Evaluation: Perform quantitative analyses to measure the scheme’s success in enhancing impartiality, consistency, and objectivity.
- Qualitative Feedback: Gather qualitative feedback from participants, judges, and stakeholders to understand their perspectives on the fairness and transparency of the process.
- Case Studies: Develop case studies to illustrate the effectiveness of the judging scheme in various contexts, which can provide concrete examples for future organizers.
- Technological Integration: Explore how technology can be integrated into the judging scheme to streamline the process and potentially reduce bias.
- International Perspectives: Consider the cultural differences that might affect the implementation and acceptance of the judging scheme in international contests.
- Ethical Considerations: Address any ethical implications that may arise from the implementation of the judging scheme, ensuring that it upholds principles of fairness and justice.
- Longitudinal Studies: Conduct longitudinal studies to assess the long-term effects of the judging scheme on the quality and reputation of competitions.
The proposed judging scheme for large-scale innovation contests in this study offers a valuable framework that can be extended to various other assessment and evaluation scenarios, including art tests, exams, and public official elections. Its application promises greater equity, impartiality, consistency, and objectivity in the evaluation process. However, it is important to recognize that implementing and designing such competitions involve numerous interconnected factors.
While this study effectively addresses subjective biases in scoring entries and provides solutions for handling controversial submissions, there is a need for further exploration of additional factors that may influence the overall competition quality and sustainability. Future research should aim to identify and analyse these factors to develop a more comprehensive understanding of the complexities involved.
Moreover, the continuous refinement and improvement of the judging scheme are crucial to ensure its relevance and effectiveness in evolving contexts. Future works could focus on enhancing the scheme’s adaptability, scalability, and responsiveness to changing needs and challenges. By doing so, the proposed judging scheme can serve as a robust foundation for ensuring fair, accurate, and reliable assessments in large-scale innovation contests and beyond.
By pursuing these future works, researchers can not only validate and improve the proposed judging scheme but also contribute to the broader field of contest design and evaluation methodology.
Conflict of Interest
We have no conflict of interests to disclose and the manuscript has been read and approved by all named authors.
Acknowledgments
This work was supported by the Philosophical and Social Sciences Research Project of Hubei Education Department (19Y049), and the Staring Research Foundation for the Ph.D. of Hubei University of Technology (BSQD2019054), Hubei Province, China.
References
-
Rebel A, Amy D, Regina YF, Jeremy SD, Greg LR, et al. (2015) “Objective Assessment of Anesthesiology Resident Skills Using an Innovative Competition-Based Simulation Approach.” AA case reports 5(5): 79-87.
-
Chang C, Ming L (2011) Research on the Evaluation Plan of “Challenge Cup” Startup Competition. Economic Engineer 13(8): 121-124.
-
Vinogradova, Irina (2019) Multi-attribute decision- making methods as a part of mathematical optimization. Mathematics 7(10): 915.
-
Zhuang S (2000) A Comprehensive Evaluation Model Based on Analytic Hierarchy Process. Journal of Hefei University of Technology 23(4): 582-585.
-
Wei N, Zhang B, Hang Z (2019) Design of Performance Evaluation System of Financial Shared Service Center in New Environment based on Analytic Hierarchy Method. Friends of Accounting 21(5): 135-140.
-
Wang F, Han X (2014) Research on optimization of data storage model of SaaS-based general review system. Computer application research 31(7): 2067-2070.
-
Xu P, Qiang B, Han Z (2019) Construction of Data-driven User Portrait Model of Digital Library. Library and Information Service 63(3): 30-37.
-
Segev E (2020) Crowdsourcing contests. European Journal of Operational Research 281(2): 241-255.
-
Martire KA, Edmond G (2017) Rethinking expert opinion evidence. Melbourne University Law Review 40(3): 967- 998.
-
Li X, Shi Y, Li H, Wei B, Caleb CC, et al. (2021) An Experimental Study of Quantitative Evaluations on Saliency Methods. ACM SIGKDD Conference on Knowledge Discovery and Data Mining, China, pp: 3200- 3208.
-
Haruka K, Masatoshi U, Yusuke N, Nobuyuki S, Yasuo Y, et al. (2023) Off-Policy Evaluation of Ranking Policies under Diverse User Behaviour. ACM SIGKDD Conference on Knowledge Discovery and Data Mining, Japan pp: 1154-1163.
-
Rustam S, Chuanwen D (2022) A systematic review study on integrating technology-assisted intercultural learning in various learning context. Education and information technologies 27(5): 6753-6785.
-
Yiding J, Parth N, Manik S, Sumukh KA, Dhruva K, et al. (2021) Methods and Analysis of The First Competition in Predicting Generalization of Deep Learning. Conference on Neural Information Processing Systems 133: 170- 190.
-
Huang C (2016) Competition scoring system based on hybrid applications. Fujian Computer 32(12): 143-144.
-
Rahmayati R (2021) Competition Strategy in the Islamic Banking Industry: An Empirical Review. International Journal of Business, Economics, and Social Development 2(2): 65-71.
-
Zhang L, Yuan N (2010) Comparative and Selection of Standardization Methods in Indexes in Linear Comprehensive Evaluation Model. Forum on Statistics and Information 25(8): 10-15.
-
Schneider A, Gerhard H, Maria B (2010) Linear regression analysis: part 14 of a series on evaluation of scientific publications. Dtsch Arztebl Int 107(44): 776-782.
-
Curtis, Alexander E, Ziganshin BA, Elefteriades JA (2016) The mystery of the Z-score. Aorta 4(4): 124-130.
-
Mo Y, Guo Y, Mo H (2022) Study on feature selection using feature filtering and PCA dimensionality reduction method. Journal of Hangzhou Aeronautic University 27(2): 36-41.
-
Abdi H, Lynne JW (2010) Principal component analysis. Wiley interdisciplinary reviews: computational statistics 2(4): 433-459.
-
Jin JL, Yang (2005) Systematic Review Method Based on Fuzzy Priority Relational Matrix. Journal of Systems Engineering Theory and Methodology Applications 14(4): 364-368.
-
Liao Y, Shi D, Lai X (2022) Evaluation and improvement of youth entrepreneurship loan dynamics based on improved weighted dynamic fuzzy evaluation model. Modern Business and Industry 43(7): 88-90.
-
Li Q, Ni X, Song J (2018) Fuzzy evaluation of multi- dimensional performance of precise poverty alleviation in contiguous poverty-stricken areas: A case study of Dabie Mountainous Area. Anhui Province. East China Economic Management 32(3): 22-27.
-
Shan K, Shuai J, Zhang S (2016) Evaluation of oil and gas pipeline failure probability based on correction factor. China Safety Science Journal 26(1): 87-93.
-
Wu X, Xie H, Wang S (2020) Double factor stochastic conditional range model and its empirical study. Management Science Review 23(1): 47-64.
-
Zhang C, Li J (2018) Differences in project review by different types of experts and their reasons. Journal of Technology and Economics 37(5): 115-123.
-
Wang H, Kang J (2021) The application of Excel VBA in the calculation of evaluation results. Office automation 26(2): 63-64+26.
-
Kilgour DM, Gerchak Y (2004) Elicitation of probabilities using competitive scoring rules [J]. Decision Analysis 1(2): 108-113.
-
Han J, Zhao S, Dong T (2010) Stepwise modification algorithm model for competition score results. Journal of Jinan Vocational and Technical College 3(4): 67-68+83.
-
Han X, Chen Z, Dong T (2003) The offset amount correction method for competition score results. Journal of Xiangtan Institute of Technology and Science (Social Sciences Edition) 5(1): 77-80.
-
Chen C, Yu X, Wang Y (2018) Dam siting problem based on 0-1 integer programming model. Journal of Yantai University (Natural Science and Engineering) 31(1): 1-5.
-
Yan L, Liu Z, Ai Y (2017) A New Method for Optimal Configuration of PMU Measurement Points Based on 0-1 Integer Programming Algorithm. Power System Protection and Control 45(12): 101-106.
-
Diego C, Brendan J, Zongyi L, Lisa R, Sirui L (2018) Conditional Linear Regression. AAAI Conference on Artificial Intelligence 46: 30.
-
Pang H, Hui Z, Li W, Ma Y, Cui Y (2019) Linear Regression Recommendation Algorithm Based on Collaborative Filtering. Application Research of Computers 36(5): 1302-1304+1310.
-
Brian ST, Praveen C, Christine H, Fernando D (2021) Mixed Method Development of Evaluation Metrics. ACM SIGKDD Conference on Knowledge Discovery and Data Mining, USA, pp: 4070-4071.
-
Liu D, Yu Y, Gong Y, Weizhen Q, Hang Z, et al. (2021) GLGE - A New General Language Generation Evaluation Benchmark. Findings of the Association for Computational Linguistics: ACL-IJCNLP 2021, 408-420.
-
Junghyun L, Gwangsu K, Matt O, Mark H, Chang DY (2022) Fast and Efficient MMD-Based Fair PCA via Optimization over Stiefel Manifold. Proceedings of the AAAI Conference on Artificial Intelligence 36(7): 7363- 7371.
-
Aritra D, Filip H, Peter R (2019) A Nonconvex Projection Method for Robust PCA. Thirty-Third AAAI Conference on Artificial Intelligence (AAAI-19), Hawaii.
-
Perlibakas V (2004) Distance measures for PCA-based face recognition. Pattern Recognition Letters 25(6): 711-
-
Li J (2013) A Text Classification Method for Combinatorial Feature Extraction Based on PCA. Application Research of Computers 30(8): 2398-2401.
-
Bouffard JA, Taxman FS, Silverman R (2003) Improving process evaluations of correctional programs by using a comprehensive evaluation methodology. Eval Program Plann 26(2): 149-161.
-
Zuo D, Hong G, Wang C (2012) Application of Z-score comprehensive evaluation method in quality evaluation of preventive vaccination planning work in Lujiang County. Anhui Journal of Preventive Medicine 18(1): 73- 74.
-
Daffertshofer A, Lamoth CJC, Meijer OG, Beek PJ (2004) PCA in studying coordination and variability: a tutorial. Clin Biomech 19(4): 415-428.
-
Peng X, Jiawen W, Zhenwen L (2020) Priority decision of substation automation equipment maintenance based on hesitant fuzzy matrix. Power System Protection and Control 48(4): 104-109.
-
Zhang L, Jing T (2004) Research on the Evaluation Model of Projects under Equipment R&D Based on AHP and Fuzzy Mathematics. Science and Technology Management 25(4): 31-32.
-
Jing C (2021) Application of Fuzzy Mathematical Method in Tourism Attractiveness Evaluation. Journal of Zhejiang University (Science Edition) 48(1): 118-123.
-
Hu F, Zhao H, Liu C (2020) The impact of diversity of participants on the performance of network innovation competitions. Research & Development Management 32(1): 89-100.
-
Bell DR, Guskiewicz KM, Clark MA, Padua DA (2011) Systematic review of the balance error scoring system. Sports health 3(3): 287-295.
-
Xie L, Gao J (2017) Design and application of a competition scoring system based on cross-platform. Fujian Computer 33(9): 132-133.
-
Chen L (2019) In-depth discussion on range method in standard uncertainty class an evaluation. Journal of Metrology 40(2): 347-352.
-
Kheng K (2022) Novel Methods for Aggregating Analyst Estimates. IEEE International Conference on Data Engineering (2022): 3230-3235.
-
Hao Z, Zhang H, Kong X (2014) Application of Z-score- fuzzy comprehensive evaluation model in quality evaluation of coal quality laboratory interlaboratory. Thermal Power Generation 43(1): 85-89+121.
-
Wei B, Shi W, Mo J (2022) Seat fair allocation model based on overall fairness minimum range of differences. Journal of Hainan Tropical Ocean University 29(2): 64- 73.
-
Moorcroft PR, Lewis MA, Crabtree RL (1999) Home range analysis using a mechanistic home range model. Ecology 80(5): 1656-1665.
-
Anirban G, Srijeeta M, Arijit K, Soumyajit D (2021) Orchestration of Perception Systems for Reliable Performance in Heterogeneous Platforms. Design, Automation, and Test in Europe (2021): 1757-1762.
-
Jose KM, Nguyen T, MacAvaney S, Dalton J, Yates A (2021) DiffIR: Exploring Differences in Ranking Models’ Behavior. Annual International ACM SIGIR Conference on Research and Development in Information Retrieval (2021): 2595-2599.
-
Saeid TN, Pavol C, Chang BYE, Trivedi A (2018) Differential Performance Debugging with Discriminant Regression Trees. AAAI Conference on Artificial Intelligence (2018): 2468-2475.
-
Shore LM, Randel AE, Chung BG, Dean MA, Ehrhart KH, et al. (2011) Inclusion and diversity in work groups: A review and model for future research. Journal of management 37(4): 1262-1289.
-
Dong W, Weizheng C, Xiaobin X (2014) Fuzzy Membership Function Determination Method Based on Separability Measure. Control and Decision 29(11): 2089-2093.
-
Zhang Q, Xueping W (2016) Comparison of Several Types of Fuzzy Operators in Fuzzy Comprehensive Evaluation. Fuzzy Systems and Mathematics 30(3): 165-171.
-
Fusong Y, Zhaohui L (2016) A method for identifying transformer excitation inrush current based on Pearson correlation coefficient. High Voltage Apparatus 52(8): 52-56+63.
-
Yong F (2007) An Effective Software Evaluation Model. Computer Engineering and Design 28(23): 5585-5587.
- Revolutionizing Property Measurement Through Artificial Intelligence: The Journey of PropertyMeasure.ai
- AI Infused Business Model Innovation for Competitive Advantage in the Era of Big Data and Digital Transformation
- Use of CPM/PERT in the Effort to Eradicate Polio
- Integrated Multimodal Deep Learning Framework for Early Detection of Mouth Cancer Using CT Imaging and Clinical Symptom Analysis
- Artificial Intelligence in Medical Robotics and Assistance: An Overview
- Server Migration with Multipath-QUIC