Use of CPM/PERT in the Effort to Eradicate Polio
Planning, organizing, scheduling, and managing the duties associated with a polio eradication effort is the goal of this research study. Such an endeavor is carried out using the program evaluation review technique method and the critical path method (CPM/PERT). The primary conclusions of this endeavor are as follows: Since activity C is not vital, there is only one critical path in the network. Of the six initiatives to stop the spread of polio, only one is not essential. A 35-day delay in that nonessential task wouldn’t impact on the project’s overall completion time. With a normal range of 28.66 days, the attempt to stop the spread of polio would be finished in 119.34 days if all goes according to plan.
Abbreviations
CPM: Critical Path Method; PERT: Project Evaluation Review Technique; FCPM: Fuzzy Critical Path Method; FPERT: Fuzzy Program Evaluation Review Technique.
Introduction
The project will be successful if its activities are carefully planned and scheduled. When a polio eradication program is well-planned, it can lead to success and hitch-free exercise. This study aims to illustrate the practical implementation of the program evaluation review technique and the critical path method. It demonstrates that CPM/PERT [1, 2, 3, 4, 5] may be helpful tool in any situation involving linked tasks. The results of this investigation are restricted to this specific instance of polio. Such an extension would need to be redefined if further programs with numerous activities were required.
The US Navy created PERT in the late 1950s to expedite the development of the Polaris Fleet Balistic Missile [2, 3, 4].
Critical path method and program evaluation review techniques are methods used in planning, scheduling and control of projects. In their health monitoring and control program [6], employs the PERT approach. The immunization program in the Indian state of Jaipur was administered by the study using CPM/PERT. Computers were utilized for computing, and study data was collected by participating experience workers. With a variance of 102.86 and a standard deviation of 10.14, the results show that the project will be completed in 90 days, out of the 22 jobs, 9 are especially critical.
The study by Oladimeji O, et al. [7] on the usage of CPM/ PERT in the University Health Center building at the Federal University of Technology Akure in Ondo State, Nigeria, is another important case study in the field of CPM/PERT technique use. The study’s objective is to ascertain how long it will take to complete the construction of the health center. Following data analysis, all possible routes for the project’s operations were found. The location of the critical path was found. The expected length of each action was determined.
It was determined how likely it was that the task would be completed within the allocated time. The results indicate a 50% chance that the project will be completed within the allocated time.
The current work uses the Fuzzy Critical Path Method (FCPM) and the Fuzzy Program Evaluation Review Technique (FPERT) to better understand the patient flow in an emergency room at a university hospital. Fuzzy sets were included because fuzzy numbers are more effective for high-uncertainty operations, such as those in emergency rooms. The activities that affect the flow of patients through the emergency room are identified in order to establish the project network. For 1500 patients, the observed ED records the timings of each activity. The critical route, slack times, and expected project completion time are computed using the results of FCPM and FPERT [8]. A case study is carried out at the emergency room of a university hospital to gain additional insight into the patient’s flow. The activities that affect the flow of patients through the emergency room are identified in order to establish the project network. Data from 1500 patients on the periods of each activity are used in the analysis. The critical route, slack times, and expected project completion time are computed using the application case results [8].
The remaining research is arranged in the following manner: The CPM and PERT techniques’ methodologies are presented in Section 2. Data utilized in the analysis of the polio eradication campaign is presented in Section3. In section 4, the results are shown. The paper concludes at Section 5.
Methodology
The critical path method (CPM) and project evaluation review technique (PERT) are the two techniques utilized to analyze the data for the polio eradication campaign. PERT/ CPM are project planning, scheduling, and control methods [1, 9, 10]. As seen in figure 2, PERT/CPM requires the usage of network diagrams, which are the project’s graphical or diagrammatic representation. Estimating the duration of the activities is the next step in project implementation, and in PERT, the average duration of each activity is calculated by summing together three time estimates for each activity. 1. The optimistic time estimate: This is an estimate of how long an activity can be finished in the shortest amount of time. This is predicted by perfect conditions and smooth operations. The symbol for this is a. 2. The most likely time estimate: This is the approximate amount of time needed to complete a task in typical circumstances. Typically, m is used to represent this. 3. The pessimistic time estimate: This is an estimate of the maximum amount of time needed to complete a specific task under unusual circumstances. Typically, b is used to indicate this.
Using the formula, the three-time estimates are condensed into a single time estimate (anticipated time, represented by µ.
4 6 a m b µ + + =
The variance of the jobs time equals ( ) σ − =
2 b a
2 6
Total Float (TFij)
The total float is the amount of time that an activity’s start time could be postponed past its earliest feasible start time without affecting the project’s completion date.
TF LC ES D = − −
ij j i ij LC EC LS ES
= − = − j ij
ij i
Free Float (FFij)
The amount that an activity’s start time can be postponed without causing any subsequent activities to begin later than their earliest permissible start time is known as the free float.
FF ES ES D LC LC D
= − − = − =
ij j i ij j i ij
Data
Components of a Polio Eradication Campaign
Micro-Planning and Training (24 weeks before campaign)
- Situation analysis: identify high-risk areas, hard-to- reach settlements, and mobile populations.
- Mapping of communities, households, health facilities, and vaccination posts.
- Training of vaccinators, supervisors, monitors, and community mobilizers.
- Logistics: securing vaccines, cold chain, vehicles, fuel, and other mate- rials (finger markers, tally sheets, vaccine carriers).
- Advocacy and communication: engage political leaders, religious leaders, and influencers. Social Mobilization and Awareness (12 weeks be- fore campaign)
- House-to-house visits to inform caregivers.
- Radio, TV, posters, SMS, town announcers, mosque/ church messages.
- Addressing myths, rumors, and vaccine hesitancy. Vaccine Procurement & cold chain prep (37 days depending on scale) Campaign Implementation (NIDs/SNIDs) (37 days depending on scale)
- House-to-house vaccination teams: visit every household to vaccinate children under 5 years.
- Fixed and temporary posts: in markets, schools, bus stops, health facilities, border crossings.
- Transit teams: vaccinate children at bus stations, highways, and migration routes.
- Supervision: team supervisors and district coordinators ensure cover- age and resolve challenges. Monitoring & LQAS (during and after campaign, 12 weeks)
- Independent monitors assess coverage in communities.
- Lot Quality Assurance Sampling (LQAS) to check missed children.
- Review meeting with campaign managers to document lessons learned.
Follow-Up and Mop-Up Rounds (within 12 weeks after campaign)
- Conduct mop-up activities in areas where children were missed.
- Target zero-dose children, nomadic populations, or areas with resistance.
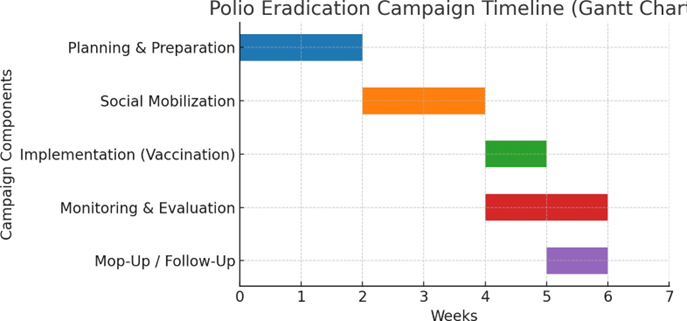
| S/N | Component | Start day | Duration (days) |
|---|---|---|---|
| 1 | Planning and Preparation | 0 | 14 |
| 2 | Social Mobilization | 14 | 14 |
| 3 | Implementation (Vaccination) | 14 | 7 |
| 4 | Monitoring and Evaluation | 28 | 14 |
| 5 | Mop-Up / Follow-Up | 35 | 1 |
Table 2: Polio Eradication Campaign Timeline.
Results
For a block in the Jimeta district, three-time estimates based on past experience were calculated for the polio vaccine campaign project, and one average or projected time estimate was calculated. The raw data from the investigation is shown in Table 2. The records that supplied the numerical data were used by the analyst to project the missing numbers.
| S/N | Activities (daily basis) | Opti- mistic (a) | Most Likely (m) | Pessi- mistic (p) |
|---|---|---|---|---|
| 1 | Micro Planning & Training | 14 | 28 | 42 |
| 2 | Social Mobilization & Awareness | 21 | 42 | 70 |
| 3 | Vaccine Procurement & Cold chain Prep | 14 | 35 | 56 |
| 4 | Campaign Implementation (NIDs/SNIDs) | 3 | 5 | 7 |
| 5 | Monitoring & LQAS | 7 | 14 | 28 |
| 6 | Follow-up Mop-up Rounds | 14 | 28 | 42 |
Table 1: Raw Data used in the analysis.
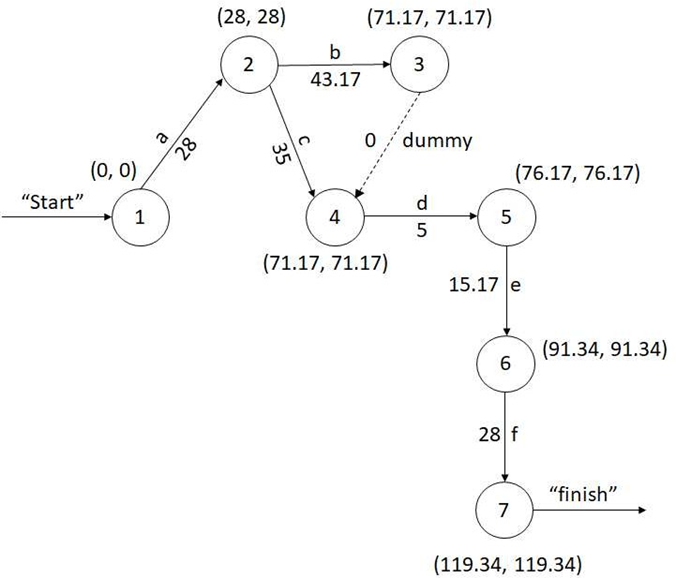
After then, the PERT analyst attempts to identify the predecessor and successor activities by logically sequencing the operations. Table 2, and Figure 2, display the sequential limitations and related network diagram for the polio campaign.
Figure 2 shows a network flow diagram of the polio campaign program from beginning to end. Activities and their durations are indicated by arrows. Nodes stand for the start and finish of an activity. The bracket with the earliest start timings and latest activity completion times is displayed at the top of each node. detailed explanation of how networks were used in the study is shown in Figure 3. The total of all the work periods in the critical path is the project length T. Bold arrows, which indicate the critical path, are a-b-Dummy-d- e-f. The project is to be finished in 119.34 days. The network displays two-time computations, namely the Earliest Start (ES) and Latest completion (LC). The last two, Float or Slack, Latest Start (LS) and Earliest Completion (EC), are calculated and displayed in the table below.
| S/N | Activity | Activity Duration | Earliest Start | Latest Completion | Total Float | Free Float |
|---|---|---|---|---|---|---|
| 1 | A (1,2) | 28 | 0 | 28 | 0 | 0 |
| 2 | B (2,3) | 43.17 | 28 | 71.17 | 0 | 0 |
| 3 | C (2,4) | 35 | 28 | 71.17 | 8.17 | 8.17 |
| 4 | Dummy (3,4) | 0 | 71.17 | 71.17 | 0 | 0 |
| 5 | D (4,5) | 5 | 71.17 | 76.17 | 0 | 0 |
| 6 | E (5,6) | 15.17 | 76.17 | 91.34 | 0 | 0 |
| 7 | F (6,7) | 28 | 91.34 | 119.34 | 0 | 0 |
Table 3: Summary of the result.
The amount that an activity can be postponed without lengthening the project’s duration is known as its float or slack. The float for all vital activities is 0, meaning they cannot be postponed. In computations, there are often two measures of float that are employed. They are total float and free float. In the instance of a portion of the polio program’s network, let’s examine the two float measures.
Probability of completion by scheduled date
The project completion time is the sum of all the job times in the critical path. PERT assumes that all the activities times are independent, and identically distributed. Hence, the central limit Theorem [11]. The completion time has a normal distribution with mean µ and variance σ2. Figure 3 exhibits a normal distribution with mean µ and standard deviation σ.
Additionally, we are able to compute the likelihood of completing the project by the deadline. For example, the client would like to know the likelihood that the project would be finished 4 days sooner than anticipated. The calculation looks like this:
x Probability x Probability Z
µ σ − ≤ = ≤
115.34 ( ) − ≤ = ≤
115.34 119.34 115.34 28.66 0.14 Probability x Probability Z
( ) ( ) Probability Z
= ≤− We derived the value of 0.4443 (0.5000-0.0557=0.4443) using the standard normal table for the shaded area to the left of z = -0.14. The project has a 44.43% chance of being completed four days ahead of schedule. with a standard deviation of σ = 28.66 days and a mean of µ = 119.34 days.
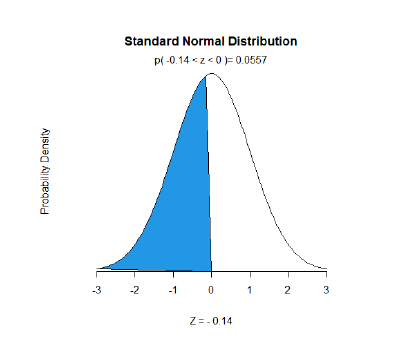
Figure 4 displays the perfectly symmetrical standard normal curve. The shaded area on the left side of zero represents the area covered by the likelihood of finishing the project within the anticipated timeframe [11, 12].
µ σ − = X Z
A criterion for differential control of activities based on Critical Path was investigated, and the project completion time and the probability of its timely completion were calculated. The methodology provided is totally dependent on temporal dimensions. Examining how resources are allocated and utilized across different jobs is necessary for project cost analysis. The goal of project cost analysis, sometimes known as ”crashing,” is to identify the ideal project length at the lowest possible overall cost. This process, sometimes called ”crashing” or ”reducing the project duration,” takes into account how the activities might impact the direct and indirect costs of the project.
Conclusion
The network diagram shows a single critical path with the critical activities a, b, dummy, d, e, and f. Because Activity C has a total float of 8.17 days and a free float of 8.17 days, it is not important. These are slack variables, or floats. Before activity c can become critical, we can crash it by 8.17 days to zero thanks to the slack variables. We can postpone the earliest start time of activity C by 8.17 days without postponing the project’s completion time, according to the number of days on the total float and free float. There’s a good chance that another critical path will appear if activity C crashes to zero days.
If all goes according to plan, the polio eradication program would be finished in 119.34 days with a standard variation of 28.66 days and a 95% chance of completing the deadline.
References
-
Anderson DR, Sweeney D, Williams TA (2013) An Introduction to Management Science: Quantitative Approaches to Decision Making. In: 13th (Edn.), Mason, Ohio, USA: Thomson South-Western, 5191 Natrp Boulevard.
-
Winston W (2004) Operations Research APPLICATIONS AND ALGO- RITHMS. In: 4th (Edn.), Brooks/ColeThomson Learning 10 Davis Drive Belmont, CA 94002 USA: Curt Hinrichs.
-
Ravindran A, Philips D. Solberg J (2014) Operations Research Principles and Practices. In: 11th (Edn.), New York, USA: John Wiley and Sons.
-
Taha H (2017) Operations Research an Introduction. In: 10th (Edn.), Upper Saddle River New Jessey: Pearson Education Limited.
-
Ravindran A (2008) Operations Research and Management Science: Handbook. In: 4th (Edn.), 6000 Broken Sound Parkway NW, Suite 300 Boca Raton, FL 33487-2742 USA: Taylor and Francis Group, LLC.
-
Jain S (2013) Application of PERT technique in health programme monitoring and control. International Journal of research in commerce, IT & Management 3(4): 63-69.
-
Oladimeji O, Akomolafe M, Lasisi T, Oloja O, Oladimeji L (2023) Network Analysis on Phase 1B Building of the University Health Centre, FUTA, using Critical Path Method (CPM) and Program Evaluation Review Technique (PERT). International Journal of Mechanical and Civil Engineering 6(1): 40-52.
-
Muhammet G, Gneri A, Koyucan G (2017) Project Management in Healthcare: A case study for patient flow evaluation in an emergency room using fuzzy CPM and fuzzy PERT. Sigma Journal Engineering and Natural Science 8(1): 41-51.
-
Iheonu N, Achom U (2023) Project Planning Application to Juice Production Using PERT/CPM Technique: A Case Study. Asian Journal of Probability and Statistics 24(2): 39-51.
-
Bagshaw K (2021) PERT and CPM in Project Management with Practical Examples. American Journal of Operations Research 11(1): 215-226.
-
Mood A, Boes D, Graybills F (1974) Introduction to the Theory of Statistics. In: 3rd (Edn.), New York, Eighth Avenue, NY 10018 USA: McGraw- Hill College, New York.
-
Bluman A (2009) Elementary Statistics: A Step-by-Step Approach. In: 7th (Edn.), 1221 Avenue of the Americas, New York: McGraw-Hill Companies.
- Revolutionizing Property Measurement Through Artificial Intelligence: The Journey of PropertyMeasure.ai
- AI Infused Business Model Innovation for Competitive Advantage in the Era of Big Data and Digital Transformation
- Integrated Multimodal Deep Learning Framework for Early Detection of Mouth Cancer Using CT Imaging and Clinical Symptom Analysis
- Artificial Intelligence in Medical Robotics and Assistance: An Overview
- Server Migration with Multipath-QUIC
- Artificial Intelligence versus Healthcare and Medical System: An Editorial