The Impact of International Oil Price Shock on China's Economic Growth
This article takes the impact of international oil price shocks on China's economic growth as the research object, and studies the impact mechanism of international oil price shocks on China's economic development status, providing practical value for the formulation of relevant policies in China. This article selects monthly data from January 2007 to December 2023 as the research interval, and uses the SVAR model to decompose the changes in international oil prices into three different sources of structural oil supply and demand shocks, namely oil supply shocks, oil total demand shocks, and oil specific demand shocks. The research results show that overall, the impact of international oil price shocks on China's economic growth is relatively low. International oil price shocks will have a negative impact on China's economic growth, and the average contribution of the three structural oil supply and demand shocks to China's economic growth does not exceed 13.1%. The impact of specific oil demand shocks on China's economic growth is the greatest, followed by oil supply shocks and total oil demand shocks, which indirectly reflect that China's economic growth is mainly influenced by its own factors.
Introduction
Oil, as a barometer of commodity price fluctuations, has been endowed with the title of “blood” of modern industry, implying that it plays a crucial role in industrial production and is an essential material resource in promoting industrial development. The prosperity and development of a country’s economy often rely closely on the development of industry. Therefore, oil is closely related to the development of the national economy. As the second largest economy and the largest manufacturing country in the world today, China’s import volume of oil has become an important pillar of the world oil market. Meanwhile, China’s foreign oil imports play an important role in the sustained, rapid, and healthy development of the national economy.
According to data released by the National Energy Administration, in 2023, China’s industrial oil production was 209 million tons, with oil imports reaching 564 million tons, and the terminal consumption of oil was approximately 770 million tons. Compared to 2022, these figures increased by 1.9%, 11.0%, and 8.5%, respectively. It is evident that China’s oil production falls far short of demand, with oil imports growing rapidly. Even amidst the impact of the COVID-19 pandemic in 2020, China’s crude oil imports still increased by 7.3%, reaching 540 million tons. However, in 2021, China’s crude oil imports experienced their first decline in 20 years, totalling 510 million tons, a year-on- year decrease of 5.4%. This decline can be attributed to the global recovery from the COVID-19 pandemic, with business capacities in the recovery phase, a slowdown in global economic growth, and escalating tensions between Russia and Ukraine, further affecting China’s crude oil imports. On the other hand, this reflects the rise of new energy sources in China, particularly the development of the new energy vehicle industry in recent years. Amid the global devastation caused by the COVID-19 pandemic, China’s automobile exports have more than doubled. Especially noteworthy is the export volume of electric vehicles, which leads the world. Gou Z, et al. [1] have shown that the development of new energy vehicles is helping China break free from its heavy reliance on petroleum energy in the transportation sector. This involves the replacement of fuel-powered cars with new energy vehicles, thereby reducing petroleum imports. However, new energy vehicles have not yet had a significant impact on fuel-powered cars, and in the medium term, petroleum consumption will continue to rise [1].
Currently, China’s external dependence on crude oil imports is around 70%, highlighting the importance of oil imports to the Chinese economy. Consequently, Chinese economic growth is inevitably influenced by fluctuations in the international oil market. This paper will structurally decompose the various sources of shocks to international oil prices and study the impact of oil price shocks on China’s economic growth.
Literature Review
Currently, the impact of oil prices on the macro-economy has been a hot topic of research for many scholars both domestically and abroad. Research on the relationship between international oil prices and the macro-economy began in the 1980s, with early contributions from Darby MR [2] and Hamilton JD [3]. Darby MR [2] found a significant statistical relationship between crude oil prices and real income [2]. Hamilton JD [3] conducted a detailed analysis of the impact of oil price fluctuations on the U.S. economy after World War II. By constructing a VAR model with six variables, he discovered a negative correlation between rising oil prices and actual economic activity in the United States [3]. Kilian L [4] used a Structural Vector Autoregression (SVAR) model to categorize oil shocks into three types: supply shocks, aggregate demand shocks, and speculative demand shocks [4]. Many subsequent scholars have used Kilian’s classification of oil price shocks to describe the impact of oil price fluctuations on the macro-economy.
Research on the impact of international oil prices on different countries’ economies: Park C, et al. [5] divided 15 cities in South Korea into four regions and used the SVAR model to analyse the effects of oil price fluctuations on the macroeconomic variables of these regions. The study found that both short-term and long-term lag structures have a negative impact on industrial production and prices [5]. Ganguly A and Das K [6] found that compared to the removal of energy subsidies, fluctuations in international crude oil prices have a greater impact on India’s GDP and exchange rate. A decrease in international crude oil prices leads to an increase in GDP and exchange rates. Conversely, a reduction in energy subsidies results in a decrease in GDP but an increase in exchange rates [6]. Lorusso M, et al. [7] and David J [8] based their studies on Kilian’s SVAR model. Lorusso M et al. [7] analysed the impact of oil price changes on the development of the UK’s economic markets, finding that the growth of global economic activity and international oil prices does not hinder the UK’s economic development in the short term. However, a decrease in global crude oil production leads to a decrease in GDP, and an increase in international oil prices corresponds to an increase in the domestic CPI index [7]. David J [8] analysed the impact of oil price shocks on the Colombian economy, finding that increases in world oil production and decreases in oil prices do not have a significant impact on any sector of the Colombian economy [8]. Esra B, et al. [9] found that oil demand shocks have a positive impact on Russia’s trade balance but a negative impact on China’s trade balance [9]. Idrisov G, et al. [10] analysed the impact of global oil prices on Russia’s economic growth, suggesting that under current economic conditions, the impact of oil prices on output is sharply declining. According to theoretical models, sustained increases in oil prices will not have a long-term impact on the economic growth rate [10]. Subsequent studies by Polbin A [11] and Wu J [12] supported Idrisov G, et al. [10] viewpoint. Both studies showed that while an increase in oil prices leads to short-term economic prosperity in Russia, it has a negative long-term impact on economic growth, although not significantly [11, 12]. Mohammad TR, et al. [13] found that rising oil prices have a positive overall impact on Saudi Arabia’s economy and emphasized that demand shocks have a greater impact than supply shocks [13]. Duong HT [14] found that the impact of oil price fluctuations on output and inflation in Vietnam depends on the different sources of oil price shocks. Compared to other shocks, oil supply shocks do not have a significant impact on Vietnam’s domestic industrial output and consumer price index [14].
Research on the impact of international oil prices on the Chinese economy: Qianqian Z [15] found a long-term equilibrium relationship between oil prices and China’s GDP, CPI, net exports, and monetary policy. Specifically, rising oil prices lead to a decrease in net exports and real GDP, causing domestic prices to rise. Additionally, rising oil prices also have a negative impact on M2 [15]. Tang Y and Jiao J [16] study indicated that the contractionary effects of monetary policy and its response to oil price shocks are more responsible for economic downturns in China than oil price shocks [16]. Li Z, et al. [17] used the SVAR model to compare and analyse the impact of international oil price fluctuations on China’s macroeconomy before and after the opening of the crude oil wholesale and retail markets. They found that the opening of the crude oil wholesale and retail markets accelerated the transmission of international oil price fluctuations to the Chinese economy. At the same time, oil price fluctuations also exacerbated domestic inflation [17]. Cheng D, et al. [18] found that intensified oil price fluctuations often lead to a decrease in real GDP and investment, prompting the Chinese government to adopt expansionary fiscal and monetary policies to stabilize the economy [18]. Bei Z, et al. [19] analysed the transmission mechanism and impact of oil price fluctuations on China’s macro economy under different driving factors. They found that a decline in oil prices driven by supply can promote positive growth in output in the short term due to the positive cost effects through supply channels [19]. Chuanguo Z, et al. [20] showed that a surge in oil prices has a negative impact on returns in China’s industrial sector but has positive spill over effects on its volatility [20]. Xiaoyu Z, et al. [21] studied the impact of crude oil price uncertainty shocks on China’s macroeconomy. They found that an increase in oil price uncertainty significantly suppresses output and increases the inflation rate, as demonstrated by establishing a VAR-SVM model [21].
Yang Z [22], Wei Y, et al. [23] and Zhao Y, et al. [24] were among the earliest researchers in China to analyse the impact of international oil prices on the Chinese economy. They believed that rising oil prices would have adverse effects on aspects such as the price level and economic growth in China [22, 23, 24]. Liu J and Jiang D [25] constructed a SVAR model to study the impact of oil price shocks on the Chinese economy. They found that oil price shocks have a negative impact on output growth in China and exacerbate domestic inflation [25]. Chen X and Zhang J [26] analysed and found that rising oil prices would lead to an increase in domestic price levels [26]. Quanying L, et al. [27] found asymmetry in the impact of international oil prices on the Chinese economy, with the impact of rising oil prices being greater than that of falling oil prices, resulting in negative effects on the Chinese economy [27]. Wang X [28], Liu J and Wang X [29] studied the impact of oil price shocks on the Chinese stock market. As a barometer of the economy, the Chinese stock market can reflect the actual situation of the economy to some extent. Wang X [28] research showed that oil price shocks would lead to economic recession, rising unemployment rates, intensified inflation, and monetary tightening in China [28]. Liu J and Wang X [29] study indicated that the impact of oil price shocks on the Chinese stock market is relatively small, with crude oil supply and demand shocks having a significant negative impact on the Chinese stock market [29]. Liu Q [30] used both SVAR and DSGE models to study the impact of oil price shocks on China’s macro economy. The research showed that rising oil prices have a restraining effect on China’s economic growth [30].
Methods
Data
The data for this study include global oil production, global economic activity index, international oil prices, gross domestic product (GDP), producer price index (PPI), and broad money supply. The specific selection and sources of each variable are as follows: 1. Global oil production and international oil prices are obtained from the U.S. Energy Information Administration (EIA). Among the international oil prices, the most representative are the West Texas Intermediate (WTI) crude oil price and the Brent crude oil price, both of which serve as benchmarks for the international oil market. The fluctuation of oil prices over the past 17 years is illustrated in Figure 1. In this study, we choose the WTI crude oil price as the international oil price because WTI crude oil exhibits good liquidity and is quoted with high transparency. This choice is based on data collected as per Dai Z and Tang R [31]. The data obtained from the U.S. Energy Information Administration are nominal oil prices. To obtain real oil prices, we need to divide nominal oil prices by the U.S. monthly Consumer Price Index (CPI). To mitigate the influence of exchange rates, the monthly data of WTI crude oil prices are multiplied by the monthly data of the corresponding U.S. dollar to Chinese yuan exchange rates for the respective periods.
![Figure 1: In this study, we choose the WTI crude oil price as the international oil price because WTI crude oil exhibits good liquidity and is quoted with high transparency. This choice is based on data collected as per Dai Z and Tang R [31]. The data obtained from the U.S. Energy Information Administration are nominal oil prices. To obtain real oil prices, we need to divide nominal oil prices by the U.S. monthly Consumer Price Index (CPI). To mitigate the influence of exchange rates, the monthly data of WTI crude oil prices are multiplied by the monthly data of the corresponding U.S. dollar to Chinese yuan exchange rates for the respective periods.](/fulltextimages/12622/fig_1.png)
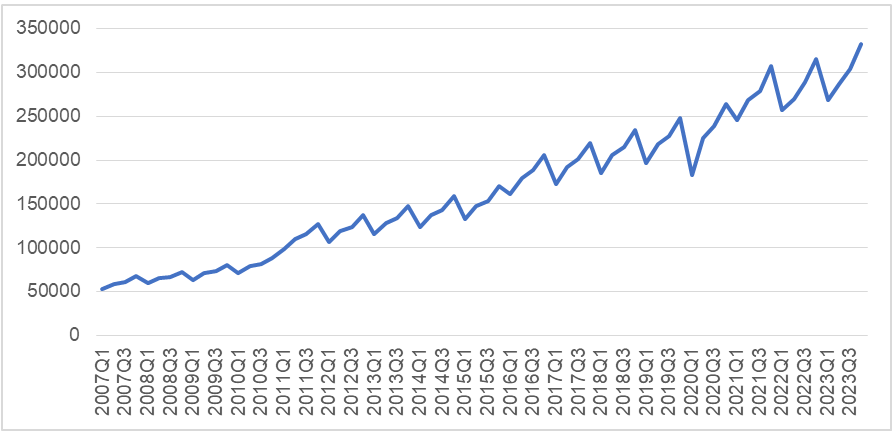
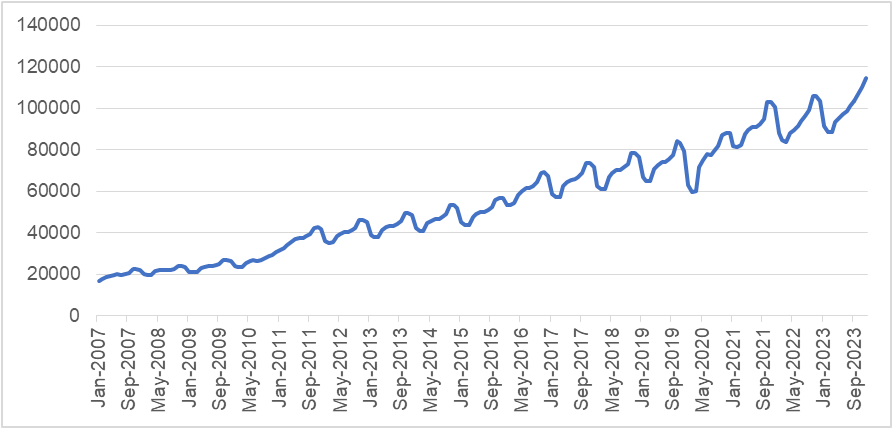
1. Global economic activity is measured by the Kilian index, the data of which can be obtained from Kilian’s personal homepage at https://www.dallasfed.org/ research/economists/Kilian.aspx. For cases where there are negative values in the data of the global economic activity index, this paper considers using a shifting or transformation method to convert the data into all positive values for seasonal adjustment or subsequent analysis. In this paper, the shifting method is chosen. Firstly, the absolute value of the minimum value is taken, and then a small positive number (0.01) is added to it to obtain the shifting constant. Then, the shifting constant is added to each value in the data to obtain the shifted data. 2. The actual Gross Domestic Product (GDP) data is sourced from the official website of the National Bureau of Statistics. In this paper, real Gross Domestic Product (GDP) is chosen as the indicator to measure China’s actual GDP. This is because real GDP is calculated based on the base period prices, which eliminates the influence of price changes and can more accurately reflect the actual changes in the production activities of all resident units in China. However, GDP data is only available on a quarterly basis. In order to match other monthly data, this paper uses Eviews12 software to convert GDP quarterly data into monthly data, as shown in Figures 2 and 3. Observing these two figures, it can be seen that their trend characteristics, such as long-term trends and amplitudes, are consistent, indicating that the converted data can be selected as the monthly data for real Gross Domestic Product.
3. The Producer Price Index (PPI) data is sourced from the official website of the National Bureau of Statistics of China. Both the Consumer Price Index (CPI) and the Producer Price Index (PPI) are important indicators for measuring changes in China’s price levels. This paper chooses PPI over CPI for two main reasons. Firstly, the two indices focus on different subjects. CPI primarily tracks price changes of goods and services purchased by consumers in daily life, while PPI is more concerned with price changes of raw materials and semi-finished goods faced by producers in the production process. Secondly, the scope of influence of the two indices differs. Changes in CPI directly affect residents’ living costs, while changes in PPI mainly impact business profits. Lin (2012) analysed the transmission pathways of international oil prices to domestic prices and discussed the different positions of various value links in the oil industry chain in the transmission process of oil price fluctuations, which may ultimately lead to different impacts on the industrialization process. Overall, fluctuations in international oil prices will directly affect PPI, but not necessarily CPI [32]. 4. The broad money supply (M2) is sourced from the official website of the National Bureau of Statistics of China. The data selected above spans from January 2007 to December 2023. For each variable, seasonal interference was removed using the X-12 method in Eviews12 software. Then, logarithms were taken for all six variables, representing their growth rates, denoted as lnprod, lnrea, lnrpo, lngdp, lnppi, and lnm2, respectively. Descriptive statistics for these six variables are presented in Table 1 below.
| Categories | Mean | Max | Min | Std. Dev. | Obs. |
|---|---|---|---|---|---|
| lnprod | 11.26486 | 11.33783 | 11.17222 | 0.044245 | 204 |
| lnrea | 4.935399 | 5.92682 | -4.25875 | 0.790187 | 204 |
| lnrpo | 5.294485 | 6.702198 | 4.017652 | 0.534826 | 204 |
| lngdp | 10.80447 | 11.57267 | 9.806171 | 0.509629 | 204 |
| lnppi | 4.616484 | 4.733035 | 4.520504 | 0.047349 | 204 |
| lnm2 | 13.99624 | 14.91427 | 12.76795 | 0.602361 | 204 |
Table 1: Descriptive Statistics of Variables.
The Model
The SVAR model is a statistical tool used to analyse relationships among multiple economic variables, first proposed by Christopher Sims in 1980. It is an extension of the Vector Auto-regression (VAR) model. Compared to the traditional VAR model, the improvement of the SVAR model lies in assuming no contemporaneous correlation among the explanatory variables. This overcomes the limitation of the VAR model in accurately capturing contemporaneous relationships among variables. The improvement involves adding contemporaneous variables to the VAR model, enabling the SVAR model to clearly identify and analyse the immediate structural relationships among economic variables. This study adopts the SVAR model and extracts supply and demand shocks in the global crude oil market based on the structural decomposition model proposed by Kilian L [4] for real oil prices. The model assumes that shocks leading to oil price changes include oil supply shocks, total oil demand shocks, and specific oil demand shocks. Oil supply shocks are measured by global crude oil production, total oil demand shocks are measured by the global economic activity index, and oil speculative demand shocks are measured by international crude oil prices. Considering the main focus of this study on the impact of structural oil price shocks on China’s economic growth, three macroeconomic variables that best represent China’s economic growth are selected: Gross Domestic Product (GDP), Producer Price Index (PPI), and Broad Money Supply (M2). They are incorporated into the SVAR model to comprehensively analyse the impact of international oil price shocks on China’s economic growth. The following SVAR model is defined as:
p $$ A _ {0} y _ {t} = \alpha + \sum_ {i = 1} ^ {p} A _ {i} y _ {t - i} + \varepsilon_ {t} \tag {1} $$
1 0 Among them, εt represents the structured random disturbances, also known as structural shock vectors, indicating that disturbances in the same period are uncorrelated and follow equation E( , ) 1 T t t ε ε = . α is the constant term of the model, and p is the lag order of the model. yt is a column vector containing six endogenous variables. According to the Cholesky decomposition theory, we need to pay special attention to the arrangement order of each variable. Variables placed in the front are considered causal variables. They will affect the contemporaneous values of variables placed later, while variables placed later will not affect the contemporaneous values of variables placed in the front. Based on the research by Qianli L [30], Dai Z and Tang R [31] and numerous scholars [30, 31] this paper arranges these six variables as follows: global crude oil production, global economic activity index, international crude oil prices, Gross Domestic Product (GDP), Producer Price Index (PPI), and Broad Money Supply (M2), it can be defined as: ( ) , , , , , 2 t t t t t t t y prod rea rpo gdp ppi m = (2)
According to the estimation process and structural principles of the SVAR model, it is known that εt cannot be directly obtained through computation. Therefore, further simplification of the model is needed in this paper. A common simplification method is to assume that A0 is a reversible matrix, and then multiply both sides of equation (1) by
1 0 A−simultaneously. This results in a simplified SVAR model equation, which can be defined as:
p
1 1 1 0 0 1 0 1
$$ y _ {t} = A _ {0} ^ {- 1} \alpha + A _ {0} ^ {- 1} \sum_ {i = 1} ^ {p} A _ {i} y _ {i - 1} + A _ {0} ^ {- 1} \varepsilon_ {t} \tag {3} $$ $$ s e _ {t} = A _ {0} ^ {- 1} \varepsilon_ {t}, $$
, where the $$ A _ {0} ^ {- 1} $$ Let equation (3) be defined as matrix can be estimated by et, and E(e ,e ) T t t =Ω. The error terms of the simplified model can be considered as a linear combination of structural shocks. The following constraints are imposed on the 1 0 A−matrix to identify and estimate the SVAR model:
oilsupplyshock prod e t t a oilaggregatedem rea e a a t t rpo e a a a t e A t t gdp a a a a e t ppi a a a a a e t a a a a a a m e t ε
1 1 0 0 0 0 0 11 0 0 0 0 2 2 21 22 0 0 0 3 1 31 32 33 0 0 0 41 42 43 44 4 0 55 51 52 53 54 5 2 61 62 63 64 65 66 6 andshock ε oilspecificdemandshock t chinagdpshock t chinappishock t chinam shock t
3 (4) ε $$ e _ {t} = \left| \begin{array}{c c} e _ {r p o} ^ {r p o} \\ e _ {g d p} ^ {g d p} \end{array} \right| = A _ {0} ^ {- 1} \varepsilon_ {t} = | $$ ε ε
4 ε
5 2 6 ε
1 oilsupplyshock t ε represents the oil In equation (4),
supply shock, 2 oilaggregatedemandshock t ε represents the oil demand shock, and 3 oilspecificdemandshock t ε represents the oil-specific demand shock. 4 chinagdpshock t ε , 5 chinappishock t ε and 2 6 chinam shock t ε represent other shocks in non-oil supply- demand markets. Since this study focuses on the impact of structural shocks from different sources of international oil prices on China’s economic growth, further decomposition of these three shocks will not be conducted here.
According to the identification requirements of the SVAR model, this study also needs to calculate the number of constraints imposed through equation k*(k-1)/2, and after computation, it is determined to impose 6x(6-1)/2=15 short-term constraints on the $$ \mathrm {n i n e d} A _ {0} $$
matrix. This study makes
the following assumptions: First, due to the long adjustment
cycle of oil production scale and the persistent uncertainty in
the international oil market, it is assumed that the oil supply
shock is not influenced by other variables in the current
period. Second, the oil demand shock has a certain degree of
temporal characteristics, and it is assumed to be influenced
by global oil production rather than other variables in the
current period. Third, the oil-specific demand shock is highly
exogenous, influenced by international oil production and
global economic activity but not by China’s economic growth.
Fourth, the gross domestic product (GDP) will only be
affected by three different sources of oil structural shocks in
the current period, while the producer price index (PPI) and
monetary supply will have lagged effects on output and will
not affect it. Fifth, the producer price index will be affected by
three different sources of oil structural shocks and GDP in the
short term, while it will not be influenced by the monetary
supply in the short term. Sixth, the monetary supply will be
affected by the above five variables in the current period.
Empirical Analysis
VAR Unit Root Test
The SVAR model is developed based on the Vector Auto- regression (VAR) model. Therefore, before constructing the SVAR model, it is necessary to establish the VAR model. The key to building the VAR model lies in ensuring that all variables in the model are stationary or co-integrated. If non-stationary time series are applied to the model, the problem of spurious regression may occur. The occurrence of spurious regression can lead to inaccurate model parameter estimation, distorted model results, and misleading causal relationships, thereby weakening the credibility and value of the study. Therefore, this paper employs the most common unit root test method the Augmented Dickey-Fuller (ADF) test method, with the selection of parameters based on intercept and trend terms. The test results are shown in Table 2 below.
| Categories | t-Statistic | Prob.* | 1st difference | t-Statistic | Prob.* |
|---|---|---|---|---|---|
| lnprod | -3.073 | 0.116 | D(lnprod) | -13.327 | 0.000*** |
| lnrea | -8.18 | 0.000*** | D(lnrea) | -12.226 | 0.000*** |
| lnrpo | -2.962 | 0.146 | D(lnrop) | -10.446 | 0.000*** |
| lngdp | -1.952 | 0.623 | D(lngdp) | -9.582 | 0.000*** |
| lnppi | -3.486 | 0.044** | D(lnppi) | -6.253 | 0.000*** |
| lnm2 | -2.068 | 0.56 | D(lnm2) | -17.348 | 0.000*** |
Table 2: ADF Test Table.
From Table 2, it is evident that among the un-differenced original variables, except for lnrea and lnppi, all other variables appear to be unstable. To ensure that all variables are in the same order of integrated status, this study conducted first- order differencing on all variables. The model results indicate that after first-order differencing, all variables rejected the null hypothesis at the 1% significance level, suggesting stability across all variables after first-order differencing.
VAR Lag Order Selection Criteria
Following the unit root tests mentioned above, it is necessary to construct a VAR model for the six variables:
D(lnprod), D(lnrea), D(lnrop), D(lngdp), D(lnppi), and D(lnm2). Since the lag order of endogenous variables has not been confirmed yet, the lag order in the model construction process here is predetermined by the system. Furthermore, the optimal lag order for the VAR model needs to be determined. The specific selection results are shown in Table 3 below.
| Lag | LogL | LR | FPE | AIC | SC |
|---|---|---|---|---|---|
| 0 | 571.0996 | NA | 1.26E-10 | -5.76632 | -5.66597 |
| 1 | 2361.857 | 3453.603 | 2.11E-18 | -23.672 | -22.9696 |
| 2 | 2489.761 | 238.8427 | 8.27E-19 | -24.6098 | -23.30526* |
| 3 | 2531.194 | 74.83296* | 7.85e-19* | -24.66525* | -22.7586 |
| 4 | 2559.207 | 48.87913 | 8.55E-19 | -24.5837 | -22.075 |
| 5 | 2584.325 | 42.29127 | 9.63E-19 | -24.4727 | -21.3618 |
| 6 | 2605.871 | 34.95623 | 1.13E-18 | -24.3252 | -20.6123 |
| 7 | 2626.882 | 32.80285 | 1.34E-18 | -24.1723 | -19.8572 |
| 8 | 2658.696 | 47.72192 | 1.43E-18 | -24.1296 | -19.2124 |
Table 3: ** VAR Lag Order Selection Criteria.
*Indicates lag order selected by the criterion. Table 3: VAR Lag Order Selection Criteria.
Based on the fundamental principles of AIC, SC, and HQ information criteria, they can be used to determine the optimal lag order of the model. From the results in Table 3, it can be observed that the asterisks in the information criteria reach the maximum at lag order 3. Therefore, this study chooses a VAR model with a lag order of 3, denoted as VAR (3).
Johansen Co-integration Test
Through ADF unit root tests, it was confirmed that the six selected sequences in this study are all first-order integrated sequences, and the optimal lag order for the VAR model was confirmed to be 3. Next, further analysis is needed to determine whether there is a co-integration relationship among them. This study uses the Johansen co-integration test in Eviews12 software for analysis, and the results are shown in Tables 4 and 5 below.
| Hypothesized | Trace | 0.05 | ||
|---|---|---|---|---|
| No. of CE(s) | Eigenvalue | Statistic | Critical Value | Prob.** |
| None* | 0.227211 | 162.1985 | 95.75366 | 0 |
| At most 1* | 0.189431 | 110.3909 | 69.81889 | 0 |
| At most 2* | 0.140319 | 68.17716 | 47.85613 | 0.0002 |
| At most 3* | 0.090602 | 37.78712 | 29.79707 | 0.0049 |
| At most 4* | 0.056123 | 18.69759 | 15.49471 | 0.0159 |
| At most 5* | 0.034648 | 7.087856 | 3.841465 | 0.0078 |
| No. of CE(s) | Eigenvalue | Statistic | Critical Value | Prob.** |
| None * | 0.227211 | 51.80764 | 40.07757 | 0.0016 |
| At most 1 * | 0.189431 | 42.2137 | 33.87687 | 0.004 |
| At most 2 * | 0.140319 | 30.39004 | 27.58434 | 0.0212 |
| At most 3 | 0.090602 | 19.08953 | 21.13162 | 0.0943 |
| At most 4 | 0.056123 | 11.60973 | 14.2646 | 0.1262 |
| At most 5* | 0.034648 | 7.087856 | 3.841465 | 0.0078 |
Table 4: Unrestricted Co-integration Rank Test (Trace).
Based on the analysis of Tables 4 and 5, it can be observed that there are at least 6 co-integration relationships in Table 4, while there are at least 3 co-integration relationships in Table 5. Taking these findings into consideration, we conclude that there exists a long-term equilibrium relationship among the six variables selected in this study.
Stability Test
The VAR (3) model constructed through the above procedures undergoes a final stability test. Since the stability of the model directly affects the credibility of the empirical analysis results, if the model is unstable, it necessitates reconsideration for VAR model construction. The stability test results are shown in Figure 4 below.
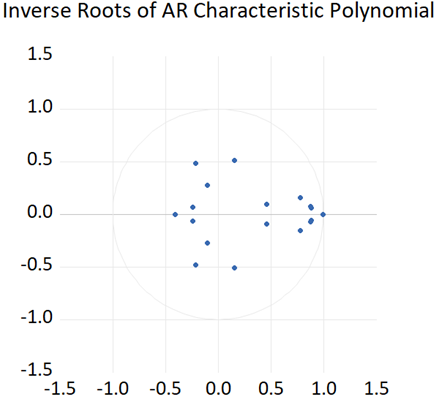
According to Figure 4, all characteristic roots are located inside the unit circle. Therefore, it can be concluded that the VAR(3) model established in this paper is stable.
Impulse Response Analysis
Building on the foundation of ensuring the stability of the established VAR model, this paper further constructed a SVAR model and determined the optimal lag order for the SVAR model to be three. Subsequently, impulse response analysis was conducted based on this, yielding impulse response function graphs representing the decomposition of international oil prices into three structural shocks affecting the economic growth of China through three macro variables. Figures 5-7 respectively illustrate the impact of these structural shocks on the growth rates of GDP, PPI, and M2 in China.
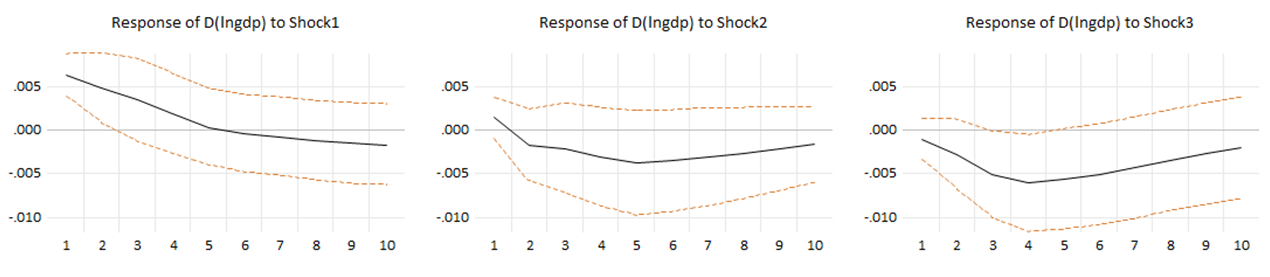
From Figure 5, regarding the oil supply shock, the impact on the growth rate of gross domestic product (GDP) shows a positive effect from the first to the fifth period, reaching a maximum value of 0.006 in the first period. Subsequently, it gradually decreases and becomes zero by the fifth period, followed by a certain negative impact on GDP. This suggests that an increase in oil supply shock leads to a short-term rise in China’s GDP, but in the long term, an increase in oil supply shock leads to a decline in China’s GDP. Regarding the oil total demand shock, it overall presents a negative impact on the GDP growth rate. It initially provides a positive impact in the first period, reaching a maximum value of 0.0014. It then significantly declines, reaching a negative maximum value of 0.004 by the fifth period. The impact gradually decreases and approaches zero by the twelfth period. This indicates that an increase in oil total demand shock leads to a decrease in China’s GDP. Regarding the oil specific demand shock, it presents a negative impact on the GDP growth rate. It reaches its maximum value of 0.0058 in the fourth period and then gradually decreases, approaching zero by the twelfth period. This suggests that an increase in oil specific demand shock leads to a decrease in China’s GDP.
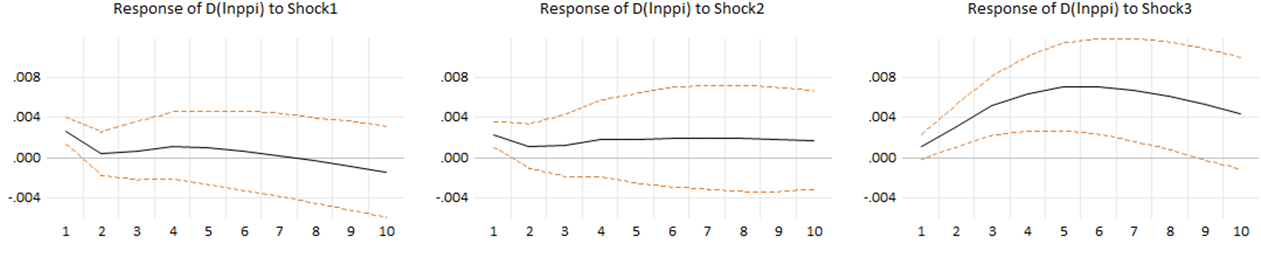
From Figure 6, it can be observed that, regarding the shock from oil supply, there is a positive impact on the growth rate of the Producer Price Index (PPI) in China from the first to the eighth period, reaching a peak of 0.0027 in the first period. Subsequently, it rapidly declines, reaching 0 in the eighth period, followed by a negative impact. Overall, an increase in oil supply shock leads to a short-term increase in China’s PPI. Regarding the oil demand shock, it results in a positive impact on the growth rate of the Producer Price Index in China, reaching a maximum of 0.0023 in the first period. It then gradually decreases, generating a weak positive effect. In other words, an increase in oil demand shock leads to an increase in China’s PPI, with a relatively minor overall impact. As for the specific oil demand shock, it exhibits a significant positive impact on the growth rate of China’s Producer Price Index. It rapidly increases in the short term, reaching a peak of 0.0071 in the sixth period, and then gradually decreases. Therefore, an increase in specific oil demand shock results in an increase in China’s PPI.
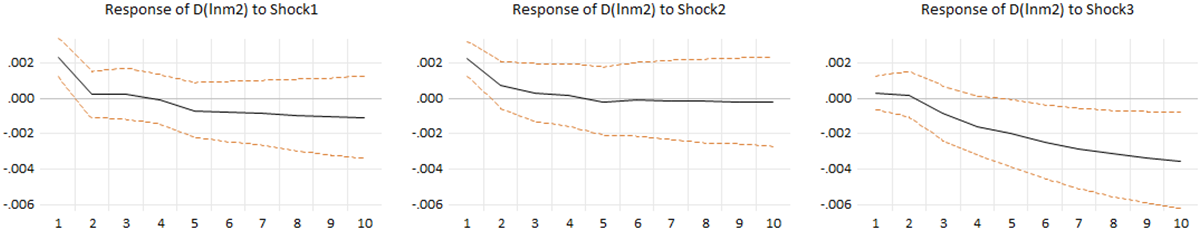
From Figure 7, it can be observed that, in terms of the oil supply shock, it initially has a positive impact on the growth rate of broad money supply in the short term, reaching its maximum value of 0.0023 in the first period, then gradually declining, and eventually turning negative after the fourth period. Thus, an increase in the oil supply shock leads to a short-term increase in M2 in China. As for the oil demand shock, it exhibits a positive impact on the growth rate of broad money supply in the short term, reaching its maximum value of 0.0022 in the first period, followed by a declining trend, approaching zero after the fifth period. Hence, an increase in oil demand shock results in a short-term increase in M2 in China. Regarding the oil-specific demand shock, it has a negative impact on the growth rate of broad money supply in China, and the magnitude of the shock increases over time, reaching its maximum value of 0.0038 in the twelfth period. Therefore, an increase in oil-specific demand shock leads to a decrease in M2 in China.
In conclusion, international oil price shocks will have certain impacts on the economic growth of our country. Specifically, supply shocks in oil will have a positive impact on our country’s real GDP, PPI, and M2 in the short term, but will have a negative impact in the long term. Meanwhile, oil demand shocks will strongly negatively affect our country’s real GDP while positively impacting PPI and M2. Lastly, specific oil demand shocks will strongly negatively affect our country’s real GDP and M2 while strongly positively affecting PPI.
Variance Decomposition
Through the variance decomposition method, we can understand the contribution of different factors to the total variance, thereby revealing the differences between these factors. Therefore, variance decomposition can be used to study the extent to which different structural shocks affect the changes in endogenous variables. Following impulse response analysis, this paper further employs the variance decomposition method to delve into the impact of structural shocks from different sources on China’s economic growth. The specific variance decomposition results are shown in Tables 6- 8 below.
| Period | Oil Supply Shock | Oil Total Demand Shock | Oil Specific Demand Shock | Other Shocks |
|---|---|---|---|---|
| 1 | 12.3199 | 0.613211 | 0.34127 | 86.72562 |
| 2 | 7.43218 | 0.600654 | 1.118686 | 90.84848 |
| 3 | 5.683737 | 0.732027 | 2.732732 | 90.8515 |
| 4 | 4.651314 | 1.141083 | 4.341511 | 89.86609 |
| 5 | 3.966435 | 1.718356 | 5.337568 | 88.97764 |
| 6 | 3.564964 | 2.12283 | 5.965544 | 88.34666 |
| 7 | 3.330788 | 2.378077 | 6.341708 | 87.94943 |
| 8 | 3.22003 | 2.55262 | 6.525767 | 87.70158 |
| 9 | 3.196064 | 2.65119 | 6.586566 | 87.56618 |
| 10 | 3.227077 | 2.690754 | 6.578238 | 87.50393 |
| 11 | 3.298063 | 2.693098 | 6.537615 | 87.47122 |
| 12 | 3.400383 | 2.673642 | 6.486726 | 87.43925 |
Table 5: Presents the Variance Decomposition Results for D(lngdp).
From Table 6, it can be observed that overall the three types of structural shocks have a certain impact on the growth rate of China’s Gross Domestic Product (GDP). Among them, the oil specific demand shock has the greatest impact on the GDP growth rate, followed by the oil supply shock, while the oil total demand shock has the smallest impact among the three structural shocks. In terms of the persistence index of shock effects, both the oil total demand shock and the oil specific demand shock exhibit significant time characteristics in their contribution to the GDP growth rate. They show substantial increases from the first period to the sixth period, stabilizing around 2.5% and 6.5% respectively after the sixth period, indicating a lag of about six periods in their impact on the GDP growth rate. In contrast, the impact of the oil supply shock does not show significant time dependence. Its contribution reaches the highest point of 12.32% in the first period and gradually stabilizes around 3% after the sixth period.
| Period | Oil Supply Shock | Oil Total Demand Shock | Oil Specific Demand Shock | Other Shocks |
|---|---|---|---|---|
| 1 | 7.773221 | 5.640851 | 1.29511 | 85.29082 |
| 2 | 3.036866 | 2.72781 | 4.617364 | 89.61796 |
| 3 | 1.674649 | 1.734345 | 8.180018 | 88.41099 |
| 4 | 1.227107 | 1.555005 | 10.53363 | 86.68426 |
| 5 | 0.972535 | 1.455468 | 12.32924 | 85.24276 |
| 6 | 0.800906 | 1.449302 | 13.52541 | 84.22438 |
| 7 | 0.67817 | 1.472833 | 14.28879 | 83.56021 |
| 8 | 0.605346 | 1.505111 | 14.74261 | 83.14693 |
| 9 | 0.5934 | 1.548485 | 14.95383 | 82.90429 |
| 10 | 0.651503 | 1.598395 | 14.98913 | 82.76097 |
| 11 | 0.787391 | 1.650377 | 14.9093 | 82.65293 |
| 12 | 1.001047 | 1.702724 | 14.7626 | 82.53363 |
Table 6: Presents the Variance Decomposition Results for D(lnppi).
From Table 7, it is evident that the oil specific demand shock has the greatest impact on the growth rate of the Producer Price Index (PPI), followed by the oil total demand shock, while the oil supply shock has the smallest impact among the three structural shocks. Overall, the contributions of the oil supply shock and the oil total demand shock to China’s Producer Price Index are mostly below 2%, indicating that their impact on the Producer Price Index is minimal. Meanwhile, the oil specific demand shock has a certain impact on China’s PPI, showing an increasing trend in the short term and stabilizing around 15% after the seventh period. This phenomenon may be attributed to the lagged effects of global crude oil production and global economic activity indices on China’s Producer Price Index, which may take some time to manifest in the index due to the delayed transmission of prices in the supply chain, including production and distribution processes from raw materials to final products. Therefore, fluctuations in oil supply and demand may not immediately reflect on the Producer Price Index.
| Period | Oil Supply Shock | Oil Total Demand Shock | Oil Specific Demand Shock | Other Shocks |
|---|---|---|---|---|
| 1 | 9.349312 | 8.74871 | 0.163141 | 81.73884 |
| 2 | 6.217035 | 6.397665 | 0.152058 | 87.23324 |
| 3 | 4.317107 | 4.465122 | 0.683277 | 90.53449 |
| 4 | 3.198403 | 3.32476 | 1.938577 | 91.53826 |
| 5 | 2.704094 | 2.607306 | 3.306518 | 91.38208 |
| 6 | 2.409064 | 2.112995 | 4.882874 | 90.59507 |
| 7 | 2.22209 | 1.763649 | 6.54302 | 89.47124 |
| 8 | 2.144865 | 1.51333 | 8.149553 | 88.19225 |
| 9 | 2.115235 | 1.324231 | 9.66774 | 86.89279 |
| 10 | 2.105284 | 1.178061 | 11.06343 | 85.65323 |
| 11 | 2.107507 | 1.063273 | 12.32491 | 84.50431 |
| 12 | 2.112803 | 0.970879 | 13.45902 | 83.4573 |
Table 7: Presents the Variance Decomposition Results for D(lnm2).
From Table 8, it is apparent that, overall, the three types of structural shocks do not have a particularly significant impact on the growth rate of China’s broad money supply (M2). Among them, the oil specific demand shock has the greatest impact on the growth rate of broad money supply, followed by the oil supply shock, while the oil total demand shock has the smallest impact among the three structural shocks. In terms of the persistence index of shock effects, firstly, the significance of the contributions of the oil supply shock and the oil specific demand shock to the growth rate of broad money supply is stronger than the impact brought by the oil total demand shock. Secondly, the contributions of the oil supply shock and the oil total demand shock gradually decrease, decreasing to 2.11% and 0.97% respectively over twelve periods, while the contribution of the oil specific demand shock increases gradually, rising to 13.46% over twelve periods. In other words, the impact of the oil supply shock and the oil total demand shock on China’s M2 decreases over time, while the impact of the oil specific demand shock on China’s M2 gradually increases over time.
In conclusion, the impact of international oil price shocks on China’s economic growth is relatively low. The combined average contribution of the three structural oil supply and demand shocks to China’s economic growth does not exceed 13.1%. This indirectly reflects that China’s economic growth is primarily influenced by internal factors. Among them, the oil specific demand shock has the greatest impact on China’s economic growth, followed by the oil supply shock, and finally, the oil total demand shock.
Conclusion
This study employs the SVAR model to comprehensively analyze the impact of structural oil supply and demand shocks, stemming from three distinct sources, on China’s economic growth resulting from international oil price fluctuations. Regarding the selection of variables representing Chinese economic growth, this study opts for three macroeconomic indicators that most effectively capture China’s economic fluctuations: GDP, PPI, and M2. The findings reveal that international oil price shocks affect China’s GDP, PPI, and M2; however, the impacts of structural oil supply and demand shocks from different sources on these indicators vary.
Firstly, the directions of the impacts differ. According to impulse response functions, oil supply shocks have a positive short-term effect on China’s real GDP, PPI, and M2, but they exert a slightly negative long-term effect. This implies that an increase in oil supply boosts the Chinese economy in the short run, but prolonged increases lead to economic downturns. Oil demand shocks have a negative impact on China’s real GDP but a positive impact on PPI and M2. Consequently, an increase in oil demand causes a decline in China’s GDP but a rise in PPI and M2. Oil-specific demand shocks negatively affect China’s real GDP and M2 but positively affect PPI. Thus, an increase in oil-specific demand leads to decreases in China’s GDP and M2 but an increase in PPI.
Secondly, the magnitudes of the impacts differ. There are variations in the magnitudes of the impacts of the three structural oil supply and demand shocks on China’s real GDP, PPI, and M2. Specifically, oil-specific demand shocks have the greatest impact on China’s real GDP and M2, followed by oil supply shocks, and finally, oil demand shocks. However, the opposite is observed regarding their impact on China’s PPI, where oil-specific demand shocks have the greatest impact, followed by oil demand shocks, and lastly, oil supply shocks. This conclusion is corroborated by impulse response functions and variance decomposition results.
Overall, international oil price shocks have a negative impact on China’s real GDP and M2, meaning that an increase in international oil prices leads to a decrease in China’s real GDP and M2. Conversely, international oil price shocks have a positive impact on China’s PPI, implying that an increase in international oil prices results in an increase in China’s PPI. An increase in PPI indicates that production costs for domestic businesses rise, squeezing profit margins. Consequently, businesses may pass these higher costs onto consumer goods, causing CPI to rise and domestic inflation to occur, thereby affecting economic growth.
In conclusion, the impact of international oil price shocks on China’s economic growth is relatively modest, with overall negative effects on China’s economic growth.
In terms of China’s policy formulation and future development, the following suggestions are proposed:
Firstly, there is a need for a scientific understanding of the sources of oil price fluctuations and the formulation of rational oil import policies. For example, if oil price increases are due to oil supply shocks, the government needs to monitor global oil production trends and formulate appropriate oil import policies to prevent adverse effects on China’s economic growth in advance.
Secondly, efforts should be made to enhance the efficiency of oil resource utilization and vigorously develop new energy sources. This entails establishing a sound regulatory system and improving environmental protection laws and regulations, particularly within the petroleum industry, to implement resource conservation and emission reduction measures effectively. The government should provide support and assistance to encourage enterprises to develop new energy sources, increase investment in high-tech and high-value- added fields, reduce dependence on petroleum fuels, and promote industrial upgrading. There is a need to vigorously develop clean energy and expand the scale of renewable energy development. Currently, only 25% of China’s hydroelectric resources, the most familiar renewable energy source in our daily lives, are utilized in multiple ways. Furthermore, other sources such as nuclear energy, solar energy, and bioenergy are still in the early stages of development and have not been further applied and expanded. With the implementation of “peak carbon” and “carbon neutrality,” China’s petroleum consumption will eventually peak, making the green low- carbon transformation an inevitable trend.
Thirdly, there is a need to increase domestic oil exploration efforts to achieve strategic oil reserve goals. This involves increasing investment in oil exploration technology and oil development technology research and development, continuously deepening oil system reforms, and attracting various enterprises to actively engage in oil exploration activities. This will enhance domestic oil development efforts, stabilize oil production scale, increase oil reserves, and improve oil self-sufficiency capabilities, thereby firmly grasping the initiative and reducing external dependence.
Limitations
When we establish the models, we only considered the SVAR model and did not utilize additional methods and models to more comprehensively reflect the impact of international oil price shocks on China’s economic growth. Due to limited resources, this also led to a narrow scope in our study. It could be beneficial to incorporate other relevant factors that might affect China’s economic growth, such as domestic policy measures, exchange rates, and technological advancements.
Furthermore, our analysis of the economic effects of international oil price shocks was confined to the macroeconomic level. The models we constructed were influenced by various factors, including the unique characteristics of China’s economy, Chinese economic policies, global political tensions, the uncertainty of oil price fluctuations, and issues related to data quality.
This also tells us that econometric models alone are not enough if we want to better reflect reality, because there are many unknown factors in reality that econometric models cannot accurately represent.
Conflict of Interest
We have no conflict of interests to disclose and the manuscript has been read and approved by all named authors.
References
-
Zehui G, Shujie S, Yishan W, Jingru N, Qian X (2023) Impact of New Energy Vehicle Development on China’s Crude Oil Imports: An Empirical Analysis. World Electric Vehicle Journal 14(2): 46.
-
Darby MR (1982) The Price of Oil and World Inflation and Recession. American Economic Review 72(4): 738- 751.
-
Hamilton JD (1983) Oil and the macro-economy since World War II. Journal of Political Economy 91(2): 228- 248.
-
Kilian L (2009) Not All Oil Price Shocks Are Alike: Disentangling Demand and Supply Shocks in the Crude Oil Market. The American Economic Review 99 (3): 1053-1069.
-
Park C, Chung M, Lee S (2011) The Effects of Oil Price on Regional Economies with Different Production Structures: A Case Study from Korea using a Structural VAR Model. Energy Policy 39(12): 8185-8195.
-
Ganguly A, Das K (2016) Impacts of Falling Crude Oil Prices and Reduction of Energy Subsidies on the Indian Economy: A CGE Modelling Approach. Vision: The Journal of Business Perspective 20(4): 345-360.
-
Lorusso M, Pieroni L (2018) Causes and Consequences of Oil Price Shocks on the UK Economy. Economic Modelling 72: 223-236.
-
Otero JDQ (2020) Not All Sectors are Alike: Differential Impacts of Shocks in Oil Prices on the Sectors of the Colombian Economy. Energy Economics 86: 104691.
-
Esra B, Catik AN, Nugent JB (2021) Time-Varying Impact of Oil Shocks on Trade Balances: Evidence using the TVP- VAR Model. Energy 217: 119377.
-
Idrisov G, Kazakova M, Polbin A (2015) A Theoretical Interpretation of the Oil Prices Impact on Economic Growth in Contemporary Russia. Russian Journal of Economics 1(3): 257-272.
-
Polbin A (2017) Econometric Estimation of the Impact of Oil Prices Shock on the Russian Economy in VECM Model. Voprosy Ekonomiki (10): 27-49.
-
Wu J (2020) Research on the Impact of International Oil Prices on the Economy of Russia. E3S Web of Conferences 214(21): 03006.
-
Tausif MR, Haque MI, Khan MR (2023) Effect of Oil Price Shocks on Output and Prices: Evidence from Saudi Arabia. Environmental Science and Pollution Research 30(50): 108855-108864.
-
Duong TH (2024) Macroeconomic Effects of Demand and Supply Shocks in the Global Oil Price on the Vietnamese Economy. International Journal of Energy Sector Management 18(1): 119-140.
-
Qianqian Z (2011) The Impact of International Oil Price Fluctuation on China’s Economy. Energy Procedia 5: 1360-1364.
-
Tang Y, Jiao J (2016) Should Rising Oil Prices or Monetary Policy Bear more Responsibility for the Economic Recession? Empirical Evidence from China. International Journal of Global Energy Issues 39(5): 305-322.
-
Li Z, Wei D, Kowalski P (2016) Transmission and Influence of International Oil Price on China’s Macroeconomic- Based SVAR Model. Journal of Discrete Mathematical Sciences and Cryptography 19(3): 535-548.
-
Cheng D, Shi X, Yu J, Zhang D (2019) How does the Chinese Economy React to Uncertainty in International Crude Oil Prices? International Review of Economics and Finance 64: 147-164.
-
Bei Z, Xiaoqing A, Xingming F, Chen S (2022) The Transmission Mechanisms and Impacts of Oil Price Fluctuations: Evidence from DSGE Model. Energies 15(16): 6038-6057.
-
Chuanguo Z, Xinjie M, Shuping Y (2022) How do Dynamic Jumps in Global Crude Oil Prices Impact China’s Industrial Sector. Energy 249: 123605.
-
Xiaoyu Z, Jinlan Z, Xiaodong D (2022) Impact of Oil price Uncertainty Shocks on China’s Macro-economy. Resources Policy 79: 103080.
-
Zhihua Y (2003) Analysis of the Impact of International Crude Oil Price Trends on China’s Economy and Countermeasures. Theory and Practice of Finance and Economics 6: 96-99.
-
Wei Y, Jingdong Y (2005) Jingdong Empirical Analysis of the Impact of International Crude Oil Price Shocks on China’s Economy. Industrial Economic Research 6: 11- 19.
-
Yuanbing Z, Jian H (2005) The Impact of Rising International Oil Prices on China’s Economy. Economic Observer 1: 29-31.
-
Liu Jian, Jiang Dianchun (2009) The Impact of International Crude Oil Price Shocks on China’s Economy: An Empirical Analysis Based on Structural VAR Model. World Economic Research 10: 33-38,67,88.
-
Xuesheng C, Jianbo Z (2013) Analysis of the Impact of International Crude Oil Price Fluctuations on China’s Macroeconomy. Statistics and Decision 14: 122-126.
-
Quanying L, Jian C, Puju C, et al. (2022) Estimation of the Impact of Global Crude Oil Supply Disruptions on China’s Macro-economy: A Case Study of the US Oil Sanctions Against Iran. Systems Engineering: Theory and Practice 42(7): 1735-1754.
-
Wang Fangming (2013) The Impact of International Crude Oil Prices on China’s Stock Market. Southwestern University of Finance and Economics.
-
Jianfeng L, Xuejie W (2022) Research on the Impact of International Crude Oil Price Shocks on China’s Stock Market: Based on the Method of Oil Price Shock Decomposition. Statistics and Management 37(6): 110- 115.
-
Qianli L (2023) Analysis of the Macroeconomic Effects of Oil Price Shocks in China. University of Economics and Law.
-
Dai Z, Tang R (2024) The Impact of Oil Price Shocks on Systematic Risk of G7 Stock Markets. Expert Systems with Applications 248: 123408.
-
Ying L (2012) Study on the Impact of Oil Price Fluctuations on Economic Growth in China. Zhejiang University.
- Revolutionizing Property Measurement Through Artificial Intelligence: The Journey of PropertyMeasure.ai
- AI Infused Business Model Innovation for Competitive Advantage in the Era of Big Data and Digital Transformation
- Use of CPM/PERT in the Effort to Eradicate Polio
- Integrated Multimodal Deep Learning Framework for Early Detection of Mouth Cancer Using CT Imaging and Clinical Symptom Analysis
- Artificial Intelligence in Medical Robotics and Assistance: An Overview
- Server Migration with Multipath-QUIC