An Empirical Study on the Efficiency of China's Convertible Bond Market
Since 2017, with the increased demand for margin financing and securities lending in the capital market and the improvement of relevant regulations, China's convertible bond market has experienced a boom. As of March 9, 2024, China has issued a total of 823 convertible bonds, amounting to 1.3 trillion yuan. The stock of convertible bonds has expanded from 24 bonds totalling 55.9 billion yuan at the end of 2016 to 553 bonds totalling 853.3 billion yuan. The importance of convertible bonds in the capital market has become increasingly prominent, becoming an essential part of financial tool diversification and market development. However, academic research on the convertible bond market is relatively scarce, mostly focusing on pricing mechanisms, financing effects, and the impact on the underlying stock prices, with little attention paid to the market itself. This paper uses runs tests, autocorrelation tests, and variance ratio tests to analyze the efficiency of China's convertible bond market. By examining whether the daily returns of the convertible bond index follow a random walk, the paper tests if the market is weak-form efficient. The results show that China's convertible bond market has not reached weak-form efficiency. Subsequently, a new index sample was created from the top ten convertible bonds by trading volume in May 2024, and its daily returns were tested for adherence to the random walk model. The results were compared to the overall market's convertible bond index returns in the same period of 2023 to identify factors influencing market efficiency, providing directions and insights for future research.
Introduction
The study of market efficiency has long been a hot topic. It began with French economist Bachelor, who first used statistical methods to calculate returns and initially described the concept of random walk. In 1933, Coles and Jones formally proposed the random walk hypothesis after deeply analyzing the long term trends of the U.S. stock market. This theory laid the foundation for market efficiency research and is considered pioneering work in the field.
In 1965, Professor Fama EF [1] of the University of Chicago provided a detailed exposition of the Efficient Market Hypothesis (EMH), which remains one of the most widely, accepted and cited core concepts in financial market theory. Fama EF [1] argued that in an efficient market, no market participant can achieve abnormal profits using publicly available information, implying that market prices fully reflect all available information. He emphasized two key relationships between market prices and information: first, how changes in market information affect price fluctuations, and second, the different types of information that impact securities value, including historical information, public information, and insider information, and analyzed the varying influence these information types have on securities prices.
Fama EF [1] highlighted that a market characterized by random fluctuations is essentially efficient because, in such a market, investors cannot gain excess returns through information advantages, and market price movements reflect complete randomness, thereby confirming the market’s efficiency.
Since its inception, the EMH has been a popular subject in empirical stock market research and one of the investment theories extensively supported and debated with substantial evidence. Despite the on-going debate, the theory maintains a central position in modern financial theory, sparking strong interest from scholars across various disciplines. These scholars have developed numerous methods for testing market efficiency, drawing diverse conclusions that have enriched our understanding of market behaviour.
Fama EF [1] analyzed the random behaviour of the stock prices of the 30 companies included in the Dow Jones Industrial Average from 1957 to 1962 using the random walk theory. The results showed that these stock prices conformed to the random walk model, indicating that the price return series did not exhibit significant persistence, supporting the notion of a weak-form efficient market [1]. Lo AW, et al. [2] found that U.S. stock prices were positively correlated in the short term, although the correlation was weak. Overall, they concluded that the U.S. stock market had achieved weak- form efficiency [2].
However, some studies suggest that not all markets meet the weak-form efficiency criteria. For example, Lima A, et al. [3] conducted random walk tests on the stock markets in Shanghai, Shenzhen, Hong Kong, and Singapore, finding that the markets in the three Chinese cities were weak-form efficient [3]. Recently, Miklesh and Madhu [4] analyzed the efficiency of the Indian stock market using the variance ratio test. Using daily closing prices of the Sensex and Nifty indices from October 2012 to October 2018 as samples, the results showed that the Indian market had not achieved weak-form efficiency, implying that technical analysis could still yield excess returns in this market [4].
In China, academic research on market efficiency has mainly focused on the stock market, with relatively limited studies on the convertible bond market, especially during the development of the convertible bond market, where empirical research is even scarcer. Currently, there are two main methods for studying the efficiency of China’s convertible bond market: testing based on the efficient market hypothesis and analyzing the valuation of convertible bonds to explore arbitrage opportunities, thereby indirectly reflecting market efficiency. However, both methods yield similar conclusions, generally indicating that China’s convertible bond market has not achieved weak-form efficiency.
Huang J [5] used cointegration tests to study the correlation between the convertible bond market and the stock market, finding arbitrage opportunities in China’s convertible bond market, indicating it had not achieved weak-form efficiency [5]. In 2005, Zheng Zhenlong and Kang Chaofeng [6], using data from Minsheng convertible bonds and Minsheng Bank stocks, discovered a first-order stochastic dominance relationship between the two, demonstrating that China’s stock market was inefficient [6]. That same year, Zhang X [7] reached similar conclusions through serial correlation tests [7]. Li Zhiqiang [8] conducted an empirical examination of the index return series of China’s convertible bond market from 2001 to 2005, finding that the market had not achieved weak-form efficiency [8]. In 2006, Li Rong incorporated the rescaled range analysis in her research and similarly found no evidence of weak-form efficiency [9]. In subsequent years, scholars such as Ying Jian [10], He Jianjun [11], Lv Zhe [12], Wan Yaqin [13] and Zhang Hao [14] applied various statistical methods, including ADF tests, cointegration tests, Q-statistic tests, and variance ratio tests, to conduct in-depth analyses of the convertible bond market from different perspectives. All arrived at similar conclusions that China’s convertible bond market had not met the conditions for a weak-form efficient market. Zhang Hao [14], using run tests, autocorrelation tests, and variance ratio tests, conducted a detailed analysis of the weighted average index data of convertible bonds from 2016 to 2022. He confirmed the market’s inefficiency and explored several possible reasons, providing richer insights into understanding market inefficiency. These continuous research findings collectively point to a consensus that China’s convertible bond market still needs improvement in terms of efficiency, thereby guiding future research and market reforms.
Methods
Data Source and Processing
The data for this study were sourced from the Shanghai Stock Exchange Bond Information Network and the Wind database, covering the period from January 4, 2019, to December 31, 2023. The yield of the Shenzhen Investment Grade Convertible Bond Index was chosen to measure the overall performance of convertible bonds. Additionally, for the construction of a custom index, the ten most actively traded convertible bonds as of May 2024 were selected, including: Huatai Convertible Bond, Wencan Convertible Bond, Chenfeng Convertible Bond, Intelligent Convertible Bond, Dingsheng Convertible Bond, Guiguang Convertible Bond, Spring Autumn Convertible Bond, Zhengyu Convertible Bond, Pudong Development Convertible Bond, and Nanyin Convertible Bond. Their corresponding codes are 113574, 113537, 113628, 128070, 113534, 110052, 113577, 113561, 110059, and 113050. Due to data completeness considerations, Dingsheng Convertible Bond and Guiguang Convertible Bond provided only 215 trading days of data, and Chenfeng Convertible Bond provided 240 data points. The remaining seven bonds each offered 242 complete records. To ensure consistency and reliability in the analysis, Chenfeng Convertible Bond, Dingsheng Convertible Bond, and Guiguang Convertible Bond were excluded, using only those with higher data completeness. Their performance in 2023 was referenced against the comprehensive convertible bond index.
The Shenzhen Investment Grade Convertible Bond Index was selected as the comprehensive index because it closely tracks overall market trends and offers more continuous and complete data compared to similar indices from the Shanghai Stock Exchange or China Securities Index. The index compilation rules include: (1) a remaining term of no less than 15 days; (2) a credit rating of AA or higher with a non-negative outlook; and (3) an outstanding size of no less than 200 million yuan.
y y Y y − =
1 t t t t −
In this study, daily return rate is selected as the research indicator, where yt represents the closing price of the current day and y(t-1) represents the closing price of the previous day. In financial data analysis, daily high- frequency data is more commonly used compared to weekly or monthly data because it more accurately reflects market fluctuations and avoids distortions in efficiency tests caused by smoothing processes. Despite occasional significant fluctuations in handling outlier data points with large price volatility, given the large sample size used in this study, these anomalies have minimal impact and are therefore included in the analysis.
1 − An empirical examination of convertible bond yields in China from 2019 to 2023 reveals that the market has not achieved weak efficiency. Consequently, this study selects seven of the top ten convertible bonds by trading volume in May 2024 to construct a new custom index based on their overall performance in 2023. This index aims to analyze the correlation between liquidity and market efficiency and explore improvement paths. These bonds are chosen due to their high trading volume and consistent market attention, meaning any changes quickly attract market focus.
The index construction avoids using a trading volume- weighted method and instead employs an arithmetic average to ensure balanced representation of each bond, better reflecting actual market conditions. The 2023 data is specifically chosen because high-trading-volume convertible bonds typically reach redemption conditions within a short period and have a short lifespan, usually within a year, making the latest year’s data the most timely and representative. Additionally, to accurately assess the impact of trading volume on market efficiency, a comparative empirical analysis of the 2023 convertible bond index was conducted.
Descriptive Statistics of Convertible Bond Composite Index Yield Rates
By analyzing the yield trends of time series, we explore the volatility and clustering of the convertible bond index yield and the custom convertible bond index yield in recent years.
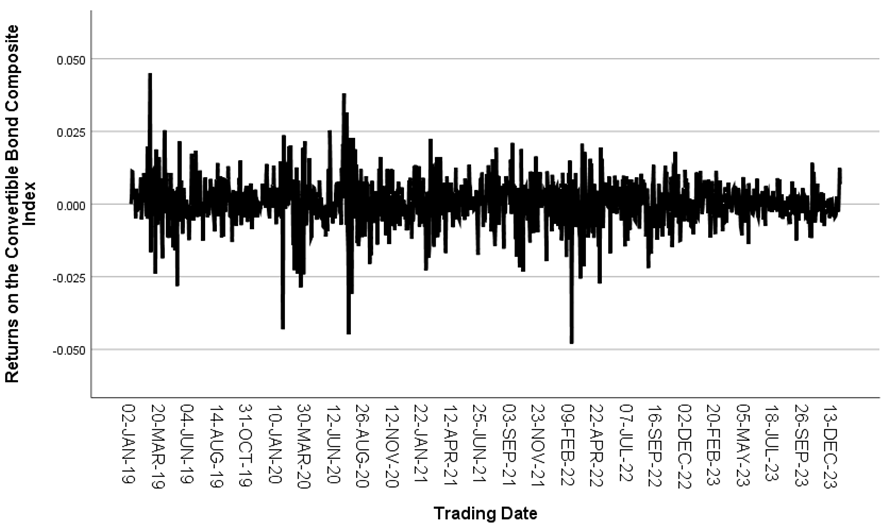
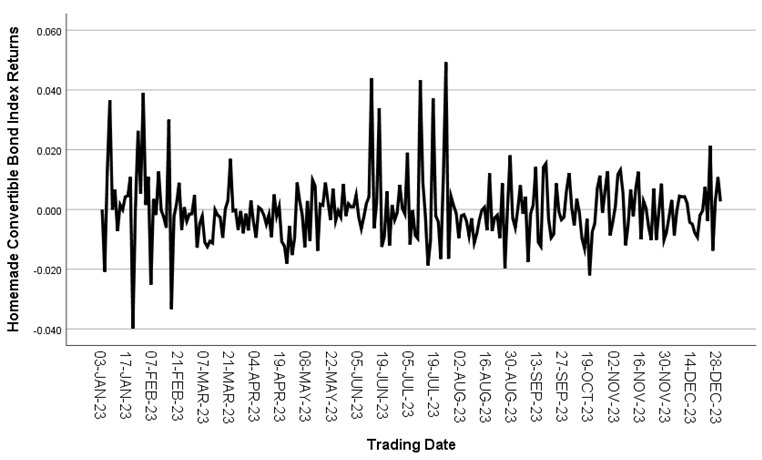
Figure 1 shows the time series trend of the convertible bond composite index yields from 2019 to 2023. During this period, the overall yield was close to zero, but with frequent fluctuations, especially during 2019-2020 and 2021- 2022. Figure 2 depicts the time series trend of the custom convertible bond index yields for 2023, which also shows significant volatility clustering, particularly around January and June of that year. This volatility can partly be attributed to the increasing openness of China’s financial market and its growing integration with international markets. The global market dynamics, especially the capital market turmoil triggered by the global pandemic post-2020, have significantly influenced domestic yields, intensifying the volatility of convertible bond yields.
Notably, both the yield sequences of the convertible bond composite index and the custom convertible bond index exhibit characteristics of leptokurtosis and fat tails. This is a typical manifestation of heteroskedasticity, indicating strong autocorrelation within the sequences, necessitating a random walk test.
Next, a descriptive statistical analysis of the convertible bond composite index yields is conducted, with the results shown in Table 1.
| Obs | Mean | Max | Min | Std. Dev. | Skewness | Kurtosis |
|---|---|---|---|---|---|---|
| 1213 | 0.0004 | 0.045 | -0.048 | 0.008257 | -0.308 | 6.832 |
Table 1: Descriptive Statistical Analysis of Convertible Bond Composite Index yields.
The mean yield data, consistent with Figure 1, shows an average yield of 0.0004, which is nearly zero. Theoretically, if a time series follows a normal distribution its kurtosis should be 3 and skewness 0. However, the data in Table 1 shows a kurtosis of 6.832 and a skewness of -0.308. This indicates that the time series exhibits left skewness and fat tails, with a sharper peak compared to a normal distribution, confirming the large yield fluctuations observed in Figure 1 from 2019 to 2023.
Run Test
The runs test, also known as the runs test of randomness, is a non-parametric method aimed at determining whether there is a significant difference between the observed number of runs and the expected number of runs under theoretical conditions. A run essentially refers to a sequence of consecutive observations that maintain consistency in a specific feature. For example, a continuous upward trend in prices constitutes a positive run, while a continuous downward trend constitutes a negative run. Periods of unchanged prices also form single runs. This testing strategy is widely employed in academic research to circumvent the traditional assumption of independent and identically distributed errors in the random walk model, thus providing a more flexible and practical means to analyze dependence structures within data sequences.
Runs Test on Convertible Bond Composite Index Yield Rates
The runs test principle was applied to analyze the yield rate Yt of the convertible bond composite index. The results of the analysis are shown in Table 2, covering 1213 observations of the convertible bond composite index yield rates, identifying 532 runs in total. It is noteworthy that the calculated associated probability is 0.00, significantly below the 0.01 significance level. The Z-statistic value of -4.337 deviates significantly from the null hypothesis H0: Rt at the 1% significance level, indicating that the yield rates of the convertible bond composite index do not exhibit the characteristics of a random walk. This reveals that current prices do not fully reflect all historical information. Investors may still be able to use historical price analysis and other information to employ technical analysis methods to achieve returns that surpass the market, further confirming that the Chinese convertible bond market has not yet achieved weak- form efficiency.
| Variables | Obs | Number of Runs | Associated Probability | Z-Value |
|---|---|---|---|---|
| The comprehensive index of convertible bonds | 1213 | 532 | 0 | -4.337 |
| Variables | obs | number of runs | associated probability | Z-value |
| Concurrent Convertible Bond Index | 242 | 103 | 0.014 | -2.448 |
Table 2: Runs Test on Convertible Bond Composite Index Yield Rates.
Runs Test on Concurrent Convertible Bond Composite Index Yield Rates
Comparative analysis of Runs Test results for the convertible bond composite index yields during the same period in 2023 is presented in Table 3. The sample size was 242, with 103 runs observed, yielding an associated probability of 0.014, which is less than 0.1. The Z-value was -2.448, rejecting the null hypothesis H_0:R_t at a significance level of 10%. This indicates that the convertible bond composite index yields in 2023 did not exhibit the characteristics of a random walk, suggesting that the Chinese market did not achieve weak-form efficiency during this period.
Runs Test on Returns of Homemade Convertible Bond Index
Next, a runs test was conducted on the 2023 homemade convertible bond index returns. As shown in Table 4, the sample size was 242, with 117 runs identified. The associated probability was 0.519, greater than 0.1. The Z-value was -0.644, failing to reject the null hypothesis H_0:R_t at a 10% significance level. This indicates that the returns of the homemade convertible bond index exhibit characteristics of random walk, suggesting that the trading volume of convertible bonds plays a significant role in market efficiency to some extent.
| Variables | Obs | Number of Runs | Associated Probability | Z-Value |
|---|---|---|---|---|
| Custom Convertible Bond Index | 242 | 117 | 0.519 | -0.644 |
Table 3: Runs Test on Returns of Homemade Convertible Bond Index.
Summary of Run Test
The above experimental results indicate that whether for the extensive sample spanning from 2019 to 2023 or the specific sample set for 2023, China’s convertible bond market has not yet reached the standard of weak efficiency. It is noteworthy that the Z-statistic value decreased from 4.336 to 2.448, while the accompanying probability increased from 0 to 0.014. This subtle change suggests an improvement in market efficiency. The core difference between the two samples lies in the number of convertible bonds included, with the 2023 sample encompassing more convertible bonds, implying that the overall market size expansion may be a key factor in enhancing market efficiency. As for the small sample test of the 2023 homemade index, the results indicate that its return series conforms to the random walk model, with the main difference lying in trading volume. Hence, it is inferred that trading volume is a critical factor influencing market efficiency.
Autocorrelation Test
The autocorrelation test is essentially a method to evaluate the significance of correlation coefficients. Its primary objective is to infer potential correlations in the population based on correlation coefficients derived from sample data. In this section of analysis, this process involves calculating the correlation coefficients between the returns of convertible bonds at a specific time point and their returns over multiple past time points. The sign of these correlation coefficients is used to infer the trend characteristics of convertible bond price fluctuations. Specifically, the autocorrelation coefficient ρk is defined as:
( )( ) 1 $$ = \frac {\sum_ {t = k + 1} ^ {n} \left(Y _ {t} - \bar {Y}\right) \left(Y _ {t - k} - \bar {Y}\right)}{\sum_ {t = 1} ^ {n} \left(Y _ {t} - \bar {Y}\right) ^ {2}} $$ n Y Y Y Y t t k t k k n $$ \rho_ {k} = \frac {\sum_ {t = k + 1} \left(Y _ {t} - Y\right) \left(Y _ {t - k}\right)}{\sum_ {t = 1} ^ {n} \left(Y _ {t} - \bar {Y}\right) ^ {2}} $$ (1)
2
1( ) t t = In equation (1), k represents the lagged k periods, Yt
denotes the return at time t, n is the sample size and R
represents the sample mean return.
$$ \rho_ {k} \in [ - 1, 1 ], \rho_ {k} \approx 0 $$
The returns of convertible bonds follow a random walk. The
key question is whether the autocorrelation coefficient falls within the interval
| n | n |
|---|
Autocorrelation Test of Convertible Bond Comprehensive Index Yield
The autocorrelation test was conducted on the returns of the convertible bond composite index, involving a total sample size of 1213 observations. When analyzing the return series, the effective sample size was adjusted to 1212 observations. The choice of a lag of 10 periods was based on the consideration that the impact of long-term lags on current data diminishes over time. The autocorrelation test results for the convertible bond composite index returns are shown in Figure 3.
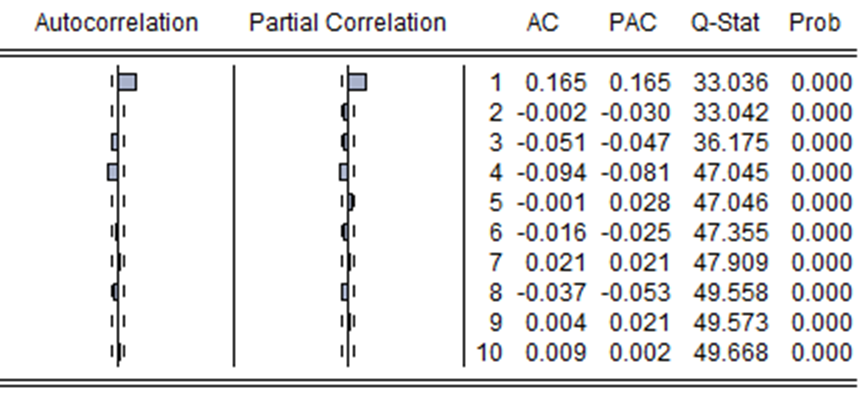
Based on the aforementioned analysis, the boundaries for the autocorrelation coefficient test
| 1212 | 1212 |
|---|
were set at significant autocorrelation in this sequence, suggesting that the convertible bond market has not achieved weak efficiency.
Autocorrelation Test of Concurrent Convertible Bond Comprehensive Index Yield
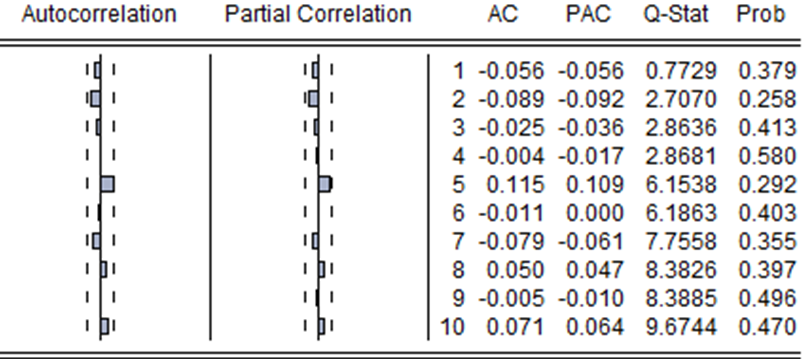
The autocorrelation test results for the 2023 concurrent convertible bond composite index yield rates are presented in Figure 4.
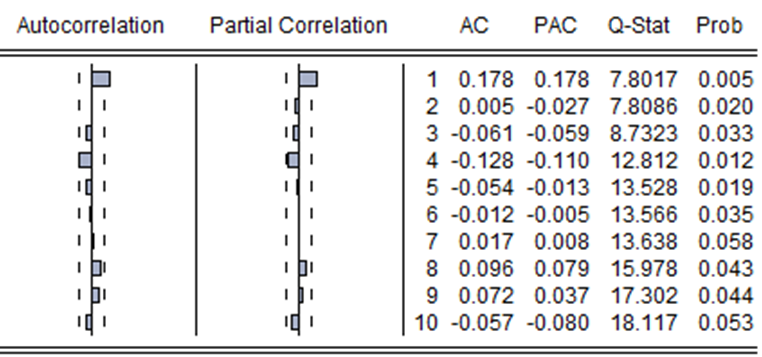
From Figure 4, it is evident that the p-values for lag 1 are significantly less than 0.01, rejecting the null hypothesis at a 1% significance level. For lags 2 to 6, the p-values are noticeably less than 0.05, rejecting the null hypothesis at a 5% significance level. Lag 8 and 9 p-values are slightly less than 0.05, also rejecting the null hypothesis at a 5%
significance level. Lag 7 and 10 p-values are less than 0.1, indicating rejection of the null hypothesis at a 10% significance level. This confirms significant autocorrelation within the sequence, indicating the time series does not exhibit characteristics of a random walk.
Autocorrelation Test of Custom Convertible Bond Index Yield
Further autocorrelation testing was conducted on the return rates of the self-made convertible bond index, as shown in Figure 5. The p-values for all lags were significantly greater than 0.1, failing to reject the null hypothesis at a 10% significance level. This indicates a lack of strong autocorrelation and suggests a random walk pattern, consistent with the results of the earlier run test. It suggests that the trading volume of convertible bonds may indeed be an important factor influencing market efficiency.
Summary of Autocorrelation Test
The above experimental results indicate that both the overall sample from 2019 to 2023 and the concurrent sample from the entire year of 2023 fail to conform to the random walk model, suggesting that the market has not achieved weak efficiency. The primary difference between these two samples lies in the broader variety of convertible bonds included in the arithmetic average index sample for 2023, implying that market size may be a critical factor influencing market efficiency. Additionally, results from the self-made convertible bond index sample show that its return rate sequence adheres to the characteristics of a random walk, consistent with the earlier run test results. This further supports the notion that trading volume could be a significant factor affecting market efficiency.
Variance Ratio Test
The core of the variance ratio test lies in the fact that if a time series is uncorrelated, then the variance of the sum of the time series equals the sum of their variances, approximately equal to 1. The formula is as follows:
( ) ( ) q t
$$ \frac {\operatorname {V a r} \left(y _ {t} ^ {q}\right)}{\operatorname {V a r} \left(y _ {t}\right)} = q \tag {2} $$ t In the equation, q represents the number of periods, Var (.) denotes the unbiased estimate of variance, and the variance is determined by the following formula:
( ) ( ) ( )
= = − − − = − − = − + −
q t Var y VR q q Var y *
t np
1 1 ∑ ( ) ( )
2 1 1 ˆ
Var y p p nq µ t k k k
− = (3) np q t k k k
1 ( ) ( ) ∑
2 1 1 ˆ
Var y p p q m
µ − = q m q nq q nq
( )
1 1
(4)
(6) ˆ
( ) ˆ
p p
1 1 k k k − =
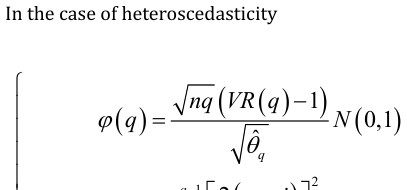
The variance ratio test is highly favoured because it provides a statistical basis for analyzing data under both homoscedastic and heteroscedastic conditions. Time series data typically exhibit heteroscedasticity, making this test particularly convenient and practical for verifying whether time series adhere to a random walk model. As a result, it has found widespread application across various fields.
Comparison of Variance Ratios of Convertible Bond Composite Index Returns
This section conducts a heteroskedasticity test on the comprehensive convertible bond index yield. The results are presented in Table 5.
| q | N | VR | R_s | P>|z| |
|---|---|---|---|---|
| 2 | 1211 | 0.6005 | -8.8785 | 0 |
| 4 | 1209 | 0.3285 | -8.4951 | 0 |
| 8 | 1205 | 0.1566 | -7.0574 | 0 |
| 16 | 1197 | 0.0755 | -5.4375 | 0 |
Table 8: Results of Variance Ratio Test for Convertible Bond Composite Index Returns.
According to the test results from Table 5, the statistics for lag orders q of 2, 4, 8, and 16 are -8.8785, -8.4951, -7.0574, and -5.4375 respectively. The corresponding p-values are all below 0.01, rejecting the null hypothesis at the 1% significance level. This indicates that the series does not conform to a random walk, confirming that China’s convertible bond market has not yet reached weak efficiency.
Test for Variance Ratio of Convertible Bond Composite Index Yield over the Same Period.
Heteroskedasticity test results for the daily returns of the convertible bond composite index in 2023 are shown in Table 6.
| q | N | VR | R_s | P>|z| |
|---|---|---|---|---|
| 2 | 240 | 0.6005 | -4.7873 | 0 |
| 4 | 238 | 0.3418 | -4.572 | 0 |
| 8 | 234 | 0.1396 | -3.9965 | 0.0001 |
| 16 | 226 | 0.0784 | -3.0262 | 0.0025 |
Table 6: Results of Variance Ratio Test for Convertible Bond Composite Index Returns.
According to the test results from Table 6, the statistics for lag orders q of 2, 4, 8, and 16 are -4.7873, -4.5720, -3.9965, and -3.0262 respectively. The corresponding p-values are all below 0.01, rejecting the null hypothesis at the 1% significance level. This indicates that the series does not conform to a random walk, suggesting that the convertible bond market during this period is not weak-form efficient.
Variance Ratio Test for Self-Constructed Convertible Bond Index Yield
| q | N | VR | R_s | P>|z| |
|---|---|---|---|---|
| 2 | 240 | 0.5155 | -4.6468 | 0 |
| 4 | 238 | 0.235 | -4.3472 | 0 |
| 8 | 234 | 0.1135 | -3.4728 | 0.0005 |
| 16 | 226 | 0.0635 | -2.6382 | 0.0083 |
Table 7: Results of Variance Ratio Test for Self-Constructed Convertible Bond Index Return.
According to the test results from Table 7, for lag orders q of 2, 4, 8, and 16, the statistics of the self-constructed index yield are -4.6468, -4.3472, -3.4728, and -2.6382 respectively. Their p-values are all significantly below 0.01, rejecting the null hypothesis at the 1% significance level. This indicates that the series does not conform to a random walk model, suggesting that the self-constructed convertible bond market is not weak-form efficient. Combining Tables 6 and 7, this study does not provide evidence that trading volume affects the efficiency of the convertible bond market.
Summary of Variance Ratio Test
The experimental results above indicate that none of the time series composed of the yields from the three convertible bond indices satisfy the random walk hypothesis. Although there is a slight increase in the probability of p>|z| for lag orders q of 8 and 16 in both the 2023 convertible bond composite index and the self-constructed convertible bond index, the significance of these effects is extremely low. Therefore, no conclusion can be drawn that market efficiency has improved.
Conclusion
The results of the above three testing methods show slight differences, summarized in Table 8:
| Composite Index 2019-2023 | Index for 2023 | Self-Constructed Index | |
|---|---|---|---|
| Runs Test | not conform to random walk | not conform to random walk | Conforms to random walk |
| Autocorrelation | not conform to random walk | not conform to random walk | Conforms to random walk |
| Test Variance Ratio Test | not conform to random walk | not conform to random walk | not conform to random walk |
Table 9: Summary of Empirical Results.
Based on Table 8, prior to 2023, China’s convertible bond market did not achieve weak-form efficiency. Results from three different empirical tests all indicate that this time series does not adhere to the random walk model. Despite the variance ratio test results for the 2023 period suggesting that the market did not achieve weak-form efficiency, the other two empirical tests indicate an improvement in market efficiency compared to the past.
Trading volume may also be a critical factor influencing the efficiency of the convertible bond market. This viewpoint is supported by the runs test and autocorrelation test in the empirical analysis, both indicating that overall market scale could be significant factor affecting market efficiency.
Through these three empirical tests and analyses, it can be inferred that reasons for the inefficiency of China’s convertible bond market may include market scale, trading volume, and underlying market risks. Addressing these issues, several recommendations are proposed here.
Firstly, China’s convertible bond market suffers from a relatively small overall scale primarily due to stringent issuance terms that restrict offerings to public issuance only, lacking a private placement option. This limits access for many non-listed companies, especially high-growth enterprises, thereby restricting their ability to raise funds through convertible bonds. As of March 2024, there are 546 outstanding convertible bonds with a total size of 900 billion yuan, whereas there are approximately 5,360 listed A-share companies with a total market capitalization of around 83.53 trillion yuan. By December 31, 2023, the market had seen 136 convertible bonds issued by 136 listed companies, raising a total of 138.294 billion yuan, representing a financing ratio of only about 1%. Therefore, an appropriate enhancement strategy could involve implementing a registration system in China’s capital market, relaxing the issuance and financing conditions for convertible bonds, and thereby expanding the market scale.
Secondly, liquidity is driven by trading volume, implying that actively traded convertible bonds exhibit higher market liquidity. Market trading often concentrates on a few convertible bonds with significant price volatility, potentially influenced by emotional decision-making. This is due to the unique dual nature of convertible bonds, combining characteristics of both stocks and bonds. For instance, convertible bonds ranked among the top ten in trading volume as of May 2024 may benefit from strong growth potential in the underlying stock industry or experience significant volatility due to their smaller circulation size.
Thirdly, market challenges include opaque information disclosure and excessive speculative behaviour. In the convertible bond market, dominated by individual investors with institutional or professional investors in the minority, individual investors often lack extensive theoretical and practical knowledge. Moreover, they have weaker psychological resilience to investment risks, making them highly susceptible to market sentiments, leading to irrational price fluctuations. To address these issues, there is a need to strengthen regulatory oversight of information disclosure, attract and cultivate more institutional investors, enhance investor education efforts, and encourage the introduction of more long-term capital to expand market scale and deepen market liquidity.
Conflict of Interest
We have no conflict of interests to disclose and the manuscript has been read and approved by all named authors.
Acknowledgement
This work was supported by the Philosophical and Social Sciences Research Project of Hubei Education Department (19Y049), and the Staring Research Foundation for the Ph.D. of Hubei University of Technology (BSQD2019054), Hubei Province, China.
References
-
Fama EF (1965) The Behavior of Stock Market Prices. Journal of Business 38: 34-105.
-
Andrew WL, Mackinlay AC (1988) Stock Market Price Do Not Follow Random Walks Evidence from a Simple Specification Test. Review of Financial Studies 1(1): 41- 66.
-
Eduardo J, Benjamin MT (2004) Tests of the random walk hypothesis for equity markets: evidence from China, Hong Kong and Singapore. Applied Economics Letters 11(4).
-
Yadav MP, Arora M (2020) Testing of Weak Market Efficiency in Indian Stock Exchange Employing Variance Ratio Test. International Journal of Public Sector Performance Management 6(5): 632-641.
-
Huang J (2002) Research on Convertible Bonds in China and Market Price Efficiency. Systems Engineering-Theory & Practice 1: 63-67.
-
Zheng Z, Kang C (2005) Absolute Dominance of Convertible Bond Investment over Stock Investment: A Counterexample of Market Efficiency in China’s Convertible Bond Market. Contemporary Finance & Economics 5: 38-39.
-
Zhang X (2005) Analysis of Weak-Form Efficiency in China’s Convertible Bond Market. China Soft Science 3: 145-149.
-
Zhiqiang L (2006) An Empirical Study on Weak- Form Efficiency in China’s Convertible Bond Market. Master’s thesis, University of International Business and Economics.
-
Rong L (2006) Research on Weak-Form Efficiency in China’s Convertible Bond Market. Master’s thesis, Chongqing University.
-
Ying J (2007) An Empirical Study on the Efficiency of China’s Convertible Bond Market. Master’s thesis, Tianjin University of Commerce.
-
Jianjun H (2008) Study on the Efficiency of China’s Convertible Bond Market. Chongqing University.
-
Zhe L (2012) Exploration of Weak-Form Efficiency in China’s Convertible Bond Market: An Empirical Study of Convertible Bond Index Based on Random Walk Theory. Business Times 6: 64-65.
-
Wan Y (2018) Research on the Efficiency of China’s Convertible Bond Market. Master’s thesis, Central China Normal University.
-
Zhang H (2021) Empirical Analysis of the Efficiency of China’s Convertible Bond Market. Master’s thesis, Zhejiang University.
- Revolutionizing Property Measurement Through Artificial Intelligence: The Journey of PropertyMeasure.ai
- AI Infused Business Model Innovation for Competitive Advantage in the Era of Big Data and Digital Transformation
- Use of CPM/PERT in the Effort to Eradicate Polio
- Integrated Multimodal Deep Learning Framework for Early Detection of Mouth Cancer Using CT Imaging and Clinical Symptom Analysis
- Artificial Intelligence in Medical Robotics and Assistance: An Overview
- Server Migration with Multipath-QUIC