Establishing a Project Management Framework for Internet Architecture
This article utilizes the Critical Path Method (CPM) and the Program Evaluation Review Technique (PERT) to plan, schedule, and oversee the building of an online project. PERT and CPM are project management tools that work well. Project managers can anticipate potential issues and delays in project completion by using PERT and CPM to plan ahead of time. To ensure that the project is finished as soon as is practically possible, schedule the jobs to follow the correct work sequence at the appropriate periods. To ensure that the project is finished on schedule, supervise and manage its activities. The methodology can address questions such as how long a project will take to finish. It appears that the project will be finished in fifty-nine days based on the results. Sensitivity analysis shows that if the project is delayed three days earlier than expected, there is an 83.15% chance that it will be completed, and there is a large possibility (66.3%) that it will be completed between 53 and 59 days. The completion time of 53 to 59 days is confirmed with 99% confidence in this outcome. Only buildings with a medium size are appropriate for the task. Additional activities with longer durations might be possible with additional structures incorporated. This is the first time the research has been conducted; it has never been done before.
Aliyu AM¹* and Abdulaziz MI²
¹Department of Mathematics and Statistics, American University of Nigeria, Nigeria ²Department of Mathematics, Universiti Teknologi Malaysia, Malaysia
Abbreviations
CPM: Critical Path Method; PERT: Program Evaluation Review Technique; IT: Information Technology.
Introduction
Complex planning, scheduling, and control issues arise when managing large projects with lots of activities, particularly when those tasks must be completed in a precise technological order. Project managers can plan ahead and anticipate potential sources of issues and delays in project completion with the aid of PERT (Program Evaluation and Review Technique) and CPM (Critical Path Method). To ensure that the project is finished as quickly as feasible, schedule the activities at the appropriate times to follow the correct work sequence. Manage and oversee the project’s activities to ensure that it is completed on time. Thus, instruments for efficient project management include PERT and CPM. Their methods for solving the problem and approaching it vary. The right technique to utilize is usually determined by the nature of the job. PERT was developed in the United States Navy during the late 1950s to accelerate the development of the Polaris Fleet Balistic Missile [1, 2, 3]. For a substantial amount of time, software development, research and development, and the introduction of new industries have all employed PERT as a project management technique [4]. PERT was established by the US Navy to supervise the Polaris missile’s development [1].
The structure of this document is as follows: The relevant literature on project management applications in internet design is presented in Section 2. Section 3 lists CPM and PERT as tools for project management planning, scheduling, and control. The results of the research are detailed in Section 4. Lastly, Section 5 presents our findings and the study’s limitations along with some recommendations for further research.
Research Methodology
The information is presented as follows:
Overview of PERT and CPM
One advantage of project management is cost-effective, on-time delivery. This can be guaranteed by implementing project management techniques like PERT and CPM. When planning, carrying out, and overseeing a project, PERT and CPM help management find the most time-consuming or consuming way through a network of tasks or activities. In order to reduce the overall cost and time of the project, managers can use these approaches to optimize the longest time duration. By assisting the project manager at each step of the process, these tools are beneficial. The methods are highly helpful in keeping an eye on project expenses, offer project documentation, and provide critical path and slack time through mathematical simplification. But when weighing the benefits of both approaches to project management, PERT is more appropriate for projects with an unclear time horizon since it is event-oriented, probabilistic, and only focused on time. CPM, on the other hand, is a deterministic, activity-oriented paradigm that is employed for small-scale, recurring tasks [7].
The fundamental tasks of scheduling, planning, and controlling are made easier by the PERT and CPM models. The planning stage divides a project’s overall requirements for supplies, labour, and machinery into clear categories. Its focus is on allocating clearly defined tasks to a chronological order of completion. An operational network that links every activity to a time dimension, resource requirements, and a way to distinguish between important and non-essential tasks are all provided to management by PERT and CPM.
PERT is frequently used in construction projects to allocate resources, determine the critical path, and schedule and monitor activities. Office buildings, roads, swimming pools, and the development of a countdown and ”hold” mechanism for space mission launch are a few examples of these projects. It can be used by construction managers to identify possible delays and make the necessary adjustments to keep the project on time. PERT is used in the manufacturing industry to assess production procedures, pinpoint areas for enhancement, and finalize corporate mergers, including ship design and the creation and promotion of a completely new product. The method is applied to optimize resource utilization, develop production schedules, and evaluate production capability. PERT is widely used in information technology (IT) projects to assign resources, identify critical routes, and manage complex operations [11].
Method of Data Collection
Data was gathered through interviews with subject- matter experts. The researcher conducts an in-person interview with the expert to obtain the necessary data. The most likely time, the optimistic time, and the pessimistic time are among the details that were gleaned from the interview, together with the activity description and its predecessors. Details of the data are shown in Tables 1 & 2.
| S/N. | Activity description | Symbol |
|---|---|---|
| 1 | Needs assessment | a |
| 2 | Budgeting | b |
| 3 | Site survey | c |
| 4 | Procurement | d |
| 5 | Setup infrastructure | e |
| 6 | Security implementation | f |
| 7 | Testing and Validation | g |
| 8 | Documentation | h |
| 9 | Monitoring and Maintenance | i |
| 10 | Scalability and Future planning | j |
Table 1: Setting up internet infrastructure.
| Row | From Node | To Node | Activity symbol | a | m | b |
|---|---|---|---|---|---|---|
| 1 | 1 | 2 | a | 6 | 7 | 8 |
| 2 | 2 | 3 | b | 5 | 6 | 7 |
| 3 | 2 | 4 | c | 1 | 2 | 2 |
| 4 | 3 | 5 | d | 7 | 14 | 21 |
| 5 | 5 | 6 | e | 7 | 14 | 18 |
| 6 | 6 | 7 | f | 3 | 4 | 7 |
| 7 | 7 | 9 | g | 2 | 2 | 3 |
| 8 | 4 | 9 | h | 3 | 4 | 5 |
| 9 | 7 | 8 | i | 2 | 3 | 4 |
| 10 | 8 | 9 | j | 7 | 8 | 10 |
Table 2: Input Grid- PERT (Program Evaluation Review Technique).
Network Diagram
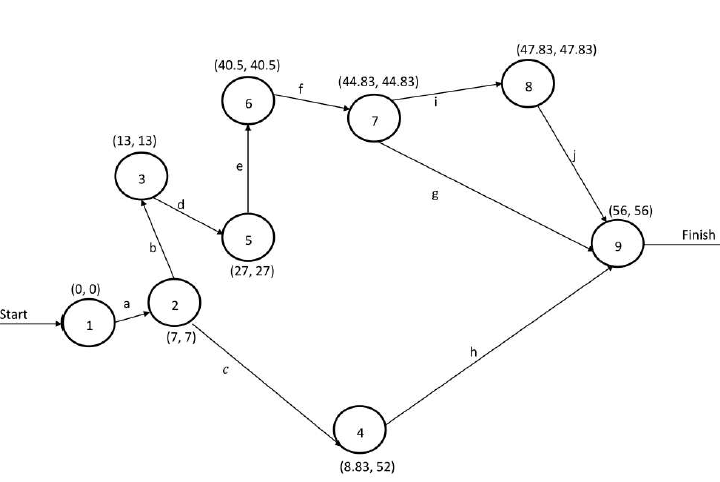
For a graphical depiction of the software, similar to that seen in Figure 1, the project can then be transformed into a network diagram. Each task originates at a starting node and ends at a subsequent node, represented by the arrows.
Results
The following outcome was obtained when the data was processed through the use of Tora Windows version 2.0 [2].
Probabilities of Completing the Project
The total of all the task durations on the critical route equals the project length X. PERT makes the assumption that every activity’s time is independent and identically distributed. Therefore, X has a normal distribution with mean EX(X) and variance VAR(X), according to the central limit theorem [12].
$$ Z = \frac {\mathrm {X} - \mathrm {E X} (\mathrm {X})}{\sqrt {\mathrm {V A R} (\mathrm {X})}} $$ Let X stands for the length of the project. Next, the project’s anticipated duration is expected to be as ( ) EX X Sum of the expected times of task = ( ) ( ) ( ) ( ) ( ) ( ) ( ) EX a EX b EX d EX e EX f EX i EX j $$ = E X (a) + E X (b) + E X (d) + E X (e) + E X (f) + E X (i) + I $$
7 6 14 13.5 4.33 3 8.17
$$ = 7 + 6 + 1 4 + 1 3. 5 + 4. 3 3 + 3 + 8 $$
56 =
The variance of the project duration is ( )
VAR X Sum of the variances of task =
2 2 2 2 2 2 2 2 12 23 35 12 56 67 78 89
$$ = \sigma_ {1 2} ^ {2} + \sigma_ {2 3} ^ {2} + \sigma_ {3 5} ^ {2} + \sigma_ {1 2} ^ {2} + \sigma_ {5 6} ^ {2} + \sigma_ {6 7} ^ {2} + \sigma_ {7 8} ^ {2} + \alpha $$ σ σ σ σ σ σ σ σ
0.11 0.11 5.44 3.36 0.44 0.11 0.25
$$ = 0. 1 1 + 0. 1 1 + 5. 4 4 + 3. 3 6 + 0. 4 4 + 0. 1 1 + 0 $$
9.82 = The standard deviation of the project duration is ( )
$$ S T D = \sqrt {V A R (X)} $$
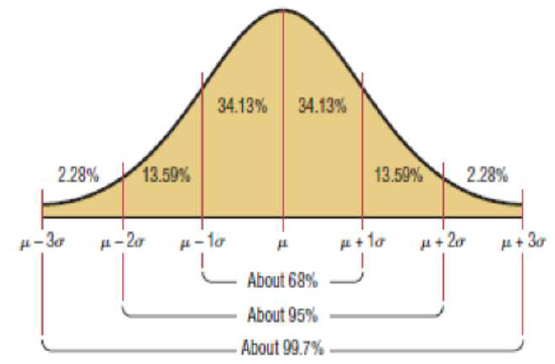
9.82 3.13 = = A normal distribution with mean µ and variance σ2 is shown in Figure 2. With a mean of 56 and a standard deviation of 3.13, X has a normal distribution. For every given normal distribution, the probability that a random variable would lie between one standard deviation and the mean is 0.68. Consequently, the project has a 68% chance of taking 50 to 62 days to finish. In contrast, there is a 95% chance that X will fall within two standard deviations, or between 44 and
68 days. Moreover, the X has a 99.7% chance of falling within the range of 38 to 74 days, or three standard deviations.
Additionally, we are able to compute the likelihood of completing the project by the deadline. For example, the client would like to know the likelihood that the project would be finished three days earlier than anticipated. The calculation looks like this:
( ) 53 56 53 Z 3.13 (Z 0.96) 0.3315
$$ \begin{array}{l} (Y \leq 5 3) = \operatorname {P r o b a b i l i t y} \left(Z \leq \frac {5 3 - 5 6}{3 . 1 3}\right) \\ = \operatorname {P r o b a b i l i t y} (Z \leq - 0. 9 6) \\ = 0. 3 3 1 5 \\ \end{array} $$ Probability X Probability Probability There is a 33.15% chance that the project will be finished three days sooner than anticipated.
( ) 59 56 59 Z 3.13 (Z 0.96) 0.8315
$$ \begin{array}{l} (Y \leq 5 9) = \operatorname {P r o b a b i l i t y} \left(Z \leq \frac {5 9 - 5 6}{3. 1 3}\right) \\ = \operatorname {P r o b a b i l i t y} (Z \leq - 0. 9 6) \\ = 0. 8 3 1 5 \\ \end{array} $$ Probability X Probability Probability The project has an 83.15% chance of being finished in less than 59 days. The following formula determines the likelihood that the project will be finished in 53 to 59 days.
53 56 59 56 Z ( 0.96 Z 0.96) 3.13 3.13 0.3315 0.3315
$$ \begin{array}{l} \operatorname {P r o b a b i l i t y} \left(\frac {5 3 - 5 6}{3. 1 3} < Z < \frac {5 9 - 5 6}{3. 1 3}\right) = \operatorname {P r o b a b i l i t y} (- 0. 9 6 < Z < 0 \\ = 0. 3 3 1 5 + 0. 3 3 1 5 \\ \end{array} $$
0.663 =
There is a 66.3% chance that the project will be completed in 53-59 days [13].
Confidence Interval for the Project Completing Time If X represents the actual project completion time, then calculate an approximate 99% confidence interval for the project completion time.
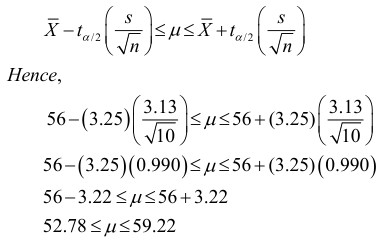
As a result, based on ten tasks, we can be 99% positive that the completion time will fall between 53 and 59 days.
The project network’s activity duration means and variations are displayed in Table 3.
| Activity | Activity symbol | Mean | Variance |
|---|---|---|---|
| (1,2) | a | 7 | 0.11 |
| (2,3) | b | 6 | 0.11 |
| (2,4) | c | 1.83 | 0.03 |
| (3,5) | d | 14 | 5.44 |
| (5,6) | e | 13.5 | 3.36 |
| (6,7) | f | 4.33 | 0.44 |
| (7,9) | g | 2.17 | 0.03 |
| (4,9) | h | 4 | 0.11 |
| (7,8) | i | 3 | 0.11 |
| (8,9) | j | 8.17 | 0.25 |
Table 4: Activity Mean and Variance.
Table 4 shows the longest path mean and standard deviation for the project.
For every task, the latest start and earliest completion times are specified as follows: LSij = LCj − Dij ECij = ESi + Dij TFij = LCj − ESi − Dij = LCj − ECij = LSij − ESi FFij = ESj − ESi − Dij ESj − ESi = LCj − LCi = Dij Where: Dij = Activity duration LSij = Latest Start time LCij = Latest completion time ECij = Earliest completion time TFij = Total float FFij = Free float
| Activity (ij) 1 | Activity Duration D ij (2) | Earliest Start ES i (3) | Earliest Completion Ec (4) ij | Latest Start LS ij (5) | Latest Com- pletion LC (6) j | Total Float TF (7) ij | Free Float FF (8) ij |
|---|---|---|---|---|---|---|---|
| (1,2) | 7 | 0 | 7 | 0 | 7 | 0 | 0 |
| (2,3) | 6 | 7 | 13 | 7 | 13 | 0 | 0 |
| (2,4) | 1.83 | 7 | 8.83 | 50.17 | 52 | 43.17∗ | 0 |
| (3,5) | 14 | 13 | 27 | 13 | 27 | 0 | 0 |
| (5,6) | 13.5 | 27 | 40.5 | 27 | 40.5 | 0 | 0 |
| (6,7) | 4.33 | 40.5 | 44.83 | 40.5 | 44.83 | 0 | 0 |
| (7,9) | 2.17 | 44.83 | 47 | 53.83 | 56 | 9∗ | 9 |
| (4,9) | 4 | 8.83 | 12.83 | 52 | 56 | 43.17∗ | 43.17 |
| (7,8) | 3 | 44.83 | 47.83 | 44.83 | 47.83 | 0 | 0 |
| (8,9) | 8.17 | 47.83 | 56 | 47.83 | 56 | 0 | 0 |
Table 5: Summary
*Non -critical activity Table 5: Summary
| Node | Longest path Based on Mean durations | Mean dura- tion | Std devia- tion |
|---|---|---|---|
| 2 | 1 - 2 | 7 | 0.33 |
| 3 | 1 - 2 - 3 | 13 | 0.47 |
| 4 | 1 - 2 - 3 - 4 | 8.83 | 0.37 |
| 5 | 1 - 2 - 3 - 4 - 5 | 27 | 2.38 |
| 6 | 1 - 2 - 3 - 4 - 5 - 6 | 40.5 | 3 |
| 7 | 1 - 2 - 3 - 4 - 5 - 6 - 7 | 44.83 | 3.08 |
| 8 | 1 - 2 - 3 - 4 - 5 - 6 - 7 - 8 | 47.83 | 3.1 |
| 9 | 1 - 2 - 3 - 4 - 5 - 6 - 7 - 8 - 9 | 56 | 3.14 |
Table 3: Summary
Table 5 provides a handy summary of the critical path estimates along with the floats for the non-critical activities. The network computations are the source of columns (1), (2), (3), (4), (5), (6), (7) and (8). The algorithms above can be used to determine the remaining data. A representative summary of the critical path calculations is shown in Table 4. Observe that the total float of a crucial activity (and only a critical activity) must be zero. When the total float is zero, the free float likewise needs to be zero. However, the opposite is not true in that a non-critical activity can have zero free float [14].
Conclusion
The project should be completed in fifty-nine days based on the findings. Sensitivity analysis indicates that if the project is completed three days earlier than anticipated, there is an 83.15% chance that it will be finished, and there is a substantial probability (66.3%) that it will be completed in 5359 days. It is verified that the completion time is between 53 and 59 days with 99% confidence.
References
-
Winston WL (2004) Operations Research: Applications and Algorithms. Thomson Brooks/Cole Learning, USA.
-
Taha HA (2017) Operations Research: An Introduction. Pearson.
-
Ravindran A, Philips DT, Solberg JJ (2014) Operations Research Principles and Practices. John Wiley.
-
Naveenchandra NS, Thakor RU, Patel SV, Viroja SG, Chetta US (2017) Application of PERT in geo-scientific software development projects few case studies. Triple A Res J Multidisci 1(1): 36-47.
-
Singh S (2017) Project Management and Strategic Objectives of the Organization. Universal J Industrial and Business Management 5(1): 10-12.
-
Levner E, Kats V, Yan P, Che A (2024) Fast Algorithm for High- Throughput Screening Scheduling Based on the PERT/CPM Project Management Technique. Algorithms 17(3): 127.
-
Bagshaw KB (2021) PERT and CPM in Project Management with Practical Examples. Am J Operations Res 11(1): 215-226.
-
Cay T, Iscan F, Durduran S (2024) The Cost Analysis of Satellite Images for using in GIS by the PERT. International Society for Photogrammetry and Remote Sensing.
-
Gopalasamy P, Mansor Z (2013) An Investigation on Project Management Standard practices in IT Organization. International Journal of Computer Engineering Science 3(3): 1-12.
-
Maroto C, Tormos P, Lova A (1999) The Evolution of Software Quality in Project Scheduling. In: J Weglarz (Edn.), Springer Science, Business Media, USA.
-
Aliyu AM, Sabo SA (2024) Project Management: An Objective Assessment of Activity Duration. Open Access J Data Sci Artificial Int 2(1): 1-9.
-
Mood AM, Boes DC, Graybills FA (1974) Introduction to the Theory of Statistics 3rd (Edn.). McGraw- Hill College, USA.
-
Bluman AG (2009) Elementary Statistics: A Step by Step Approach 7th (Edn.). McGraw-Hill Companies, USA.
-
Fogiel M (1985) The Operations Research Problem Solver 12th (Edn.). Research and Education Association, USA.
- Revolutionizing Property Measurement Through Artificial Intelligence: The Journey of PropertyMeasure.ai
- AI Infused Business Model Innovation for Competitive Advantage in the Era of Big Data and Digital Transformation
- Use of CPM/PERT in the Effort to Eradicate Polio
- Integrated Multimodal Deep Learning Framework for Early Detection of Mouth Cancer Using CT Imaging and Clinical Symptom Analysis
- Artificial Intelligence in Medical Robotics and Assistance: An Overview
- Server Migration with Multipath-QUIC