Production, Purification and Characterization of Catalase from Aspergillus Fumigatus
This study describes production, purification, and characterization of catalase enzyme from Aspergillus fumigatus. The crude enzyme extract was obtained from A. fumigatus on 7th day of cultivation of cells grown at 37 °C and 155 rpm in 1-liter YpSs medium containing 1% (w/v) glucose and 0.5 mM H2O2. Then, the enzyme was successfully purified 24-fold with 55% recovery. The molecular weight was found ~70 kDa by SDS-PAGE. The optimum reaction temperature of the enzyme was established as 60 °C and the pH was 7.0. Km and Vmax values were calculated as 7.4 mM and 1250 μM min-1, respectively. Stability tests have shown that the enzyme can remain active in a wide range of pH (4.0-9.0). Thermal stability of catalase was between 30 °C and 50 °C. The enzyme also presented stability against various solvents including ethanol, methanol, acetone, and dimethyl sulfoxide depending on the concentration and incubation time. The biochemical properties of the enzyme (low Km value, stability against varying pH and organic solvents, etc.) indicate that it can function as a good biocatalyst in different industrial applications.
Introduction
Catalases are one of the most studied enzyme groups. They show their antioxidant effects in the cell by dissolving the excessively accumulated hydrogen peroxide (H2O2) into molecular oxygen and water [1]. Some catalases (catalase- peroxidases) also show a peroxidase function (by oxidizing low molecular weight alcohols) when the appropriate organic compound is present, mostly as a secondary activity [2]. It was discovered that catalases isolated from Amaranthus cruenthus, Bacillus pumilus, Scytalidium thermophilum, Thermobifida fusca and mammalian catalase possess oxidase activity in the absence of H2O2 [3, 4, 5, 6, 7]. Catalase enzyme has been mainly used in the food, pharmaceutical, textile, paper industries and in various fields such as immobilization, enzymatic polymerization, and detoxification systems [4].
Mesophilic fungi are the most common eukaryotic microorganisms in nature. Examples of thermotolerant species include A. fumigatus and A. niger. Thermostable enzymes produced by these two Aspergillus species are industrially important [8]. Although Aspergillus is known as a good source of catalase enzyme, little is known about its kinetic and biochemical properties. Recently, the increase in the use of hydrogen peroxide in the industry has made it necessary to try to produce an economical and stable catalase enzyme that converts H2O2 to water and oxygen. Here we report the production, purification, and characterization of the catalase enzyme from mesophilic fungus A. fumigatus.
Materials and Methods
Materials
All chemicals and biochemicals were of analytical grade and obtained from Sigma-Aldrich, Merck and AppliChem.
Microbial Strain, Maintenance, and Cultivation
Aspergillus fumigatus (IMI 385708) was grown on YpSs agar (Difco powdered yeast extract, 4.0 g; K2HPO4, 1.0 g; MgSO4.7H2O, 0.5 g; soluble starch, 15.0 g; agar, 20.0 g in 1 L distilled water) [9] at 30 °C for 7 days. Spores grown on agar were transferred into 30 mL sterile solution containing 0.01% (v/v) Tween 80 and spore counting was performed with a Petroff-Hausser slide [10]. Spore suspensions were diluted with a solution containing sterile Tween 80 to contain 1 million spores per mL, and then 80% (v/v) glycerol was added and stored at -80 °C. Inoculation and the preparation of precultures were conducted as described by Soyler [11]. Heat shock and oxidative stress treatments were performed to optimize catalase production. Cultures were grown at 30, 37, 42, 45, 50 and 55 °C to induce heat shock [12, 13]. For oxidative stress, H2O2 was added to the main culture at 0.1 mM, 0.25 mM, 0.5 mM, 1 mM, and 2 mM concentrations [13] and then each culture was incubated for 7 days at 155 rpm.
Biomass and Total Protein Determination
From culture media, 50 mL samples were taken, filtered using Whatmann No. 1 filter paper, and then washed with sterile water. By drying the samples at 100 °C until a consistent weight was attained, the dry weight of the fungus biomass (gL−1) was calculated. The total protein was determined by the method described by Bradford [14] using bovine serum albumin as a standard.
Enzyme Assay
For catalase activity (CAT), the reaction mixture was obtained by adding 2.9 mL of a 10 mM H2O2 solution and 0.1 mL (pH 7.0) of the enzyme sample to a final volume of 3 mL using samples obtained from the supernatant. The substrate solution (H2O2) prepared in 100 mM sodium phosphate buffer solution was incubated for 1 min in a water bath at 25 °C. After pre-incubation, the solution was transferred to the reaction cuvette and the enzyme sample was added. After the reaction temperature was adjusted to 25 °C, the absorbance value of the device was adjusted to 240 nm and the measurement was performed. The enzyme activity was determined by using the initial reaction rate and the extinction coefficient value of hydrogen peroxide (39.4 M-1 cm-1) [15]. 1 unit of enzyme activity corresponds to the enzyme that catalyzes the decomposition of 1 µmole H2O2 in 1 min [7].
Enzyme Purification
Catalase enzyme was purified by GE AKTA Prime plus FPLC System (USA) in two steps including anion exchange and size exclusion chromatography. Anion exchange was carried out using 20 mL prepacked HiPrep 16/10 Q XL column (Cytiva, USA) with a flow rate of 2 mL/min and 50 mM Tris-HCl (pH 8.0). Size exclusion was performed using HiPrep 16/60 Sephacryl S-100 HR column (Cytiva, USA) equilibrated with same buffer at a flow rate of 1 mL/min [16].
Sodium Dodecyl Sulfate Polyacrylamide Gel Electrophoresis (SDS-PAGE)
The purity of protein sample eluted from column was checked by sodium dodecyl sulphate polyacrylamide gel electrophoresis (SDS-PAGE) according to the method described by Laemmli [17] on Bio-Rad Mini-Protean gel electrophoresis unit (Bio-Rad Laboratories, Richmond, CA). Protein bands were visualized by Coomassie blue staining.
Thermal Effect and Thermostability
To determine the effect of reaction temperature on enzyme activity, activity assays were performed at temperatures between 30 °C and 80 °C at 10 °C intervals. The concentration of enzyme and the reaction pH were kept stable. By plotting percent relative activity values against temperature, the optimum temperature at which the catalase enzyme exhibited its highest activity was determined. Relative activities were calculated by dividing enzyme activities observed at each temperature by maximum enzyme activity. For thermal stability, the purified enzyme was incubated at 30-80 °C for 2 h and the activity assay was performed under standard assay conditions. Plotting percent residual activity values against temperature gave the temperature range at which the enzyme remained stable. Residual activities were determined from the ratio of enzyme activity after heat treatment to its original activity measured at each temperature.
Reaction pH Effect and pH Stability
To determine the effect of pH on catalase activity, activity assays were measured at different pHs ranging from 4.0 to 11.0 at 1.0 pH intervals. The concentration of enzyme and the reaction temperature were kept stable. The buffers used were 100 mM citrate buffer solution (for pH 4.0-5.0), 100
mM sodium phosphate buffer solution (for pH 6.0-7.0), 100 mM tris buffer solution (for pH 8.0), and 100 mM glycine sodium hydroxide buffer solutions (for pH 9.0-11.0). The optimum pH value of the enzyme was determined from the plot of percent relative activity against reaction pH. To test the effect of pH on catalase stability, enzyme solution was incubated at same pH values given above 2 h and then activity assay was performed under standard assay conditions [16]. The pH range at which enzyme maintained its stability was determined from the plot of percent residual activities versus different pH values ranging from 4.0 to 11.0 as stated above.
Km and Vmax Determination
The Km and Vmax values of the catalase enzyme were established by measuring enzyme activity in the presence of 0-300 mM H2O2 concentrations in 0.1 M sodium phosphate buffer (pH 7.0, 25 °C) [18] using a Lineweaver–Burk plot [19].
Organic Solvent Effect and Stability
The effect of organic solvents including ethanol, methanol, acetone, and dimethyl sulfoxide (DMSO) on catalase activity was tested. The concentrations used for each solvent were 2.5, 5, 7.5, 10, 15 and 20 (v/v) [20]. The stability tests were also performed by incubating the enzyme with solvents at stated concentrations for 1 h in ice, and standard activity assay was carried out every 15 min. Percent relative activity values were calculated as given above.
Results and Discussion
Time Course of Catalase Production
A. fumigatus extracellular catalase and biomass production during 10 days of incubation on 1% (w/v) glucose-containing medium is presented in Figure 1. Accordingly, the lag phase occurred in the first two days, and then the logarithmic phase started and continued until the sixth day. A. fumigatus entered the stationary phase on the 6th day. Catalase production was the highest on 7th day at which A. fumigatus was still in the stationary phase. This indicates that enzyme production is the result of secondary metabolic activity.
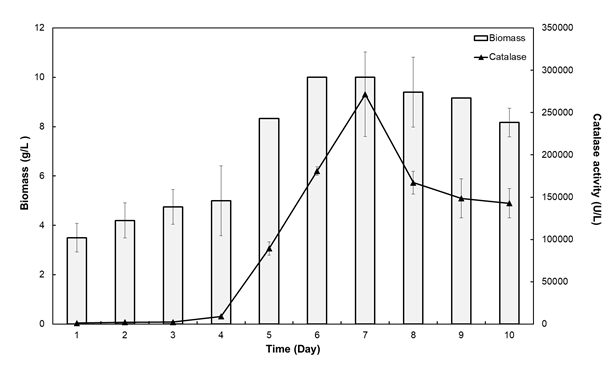
Catalases have been isolated from various fungi and fermentation time required for optimum production varied between 3 and 6 days. For example, a catalase enzyme from Septoria tritici (ATCC 48507) was isolated after 3-day incubation [21]. Similarly, a catalase was obtained from A. niger on day 3 of its cultivation [22]. On the other hand, S. thermophilum was reported to produce extracellular catalase on day 5 at optimum level [16, 20]. The difference in fermentation time primary depends on the source, the growth medium used, medium pH and growth temperature [23].
Effect of Heat Shock and Oxidative Stress on Catalase Production
It’s been reported that cellular catalase production in several Aspergillus species increases in response to increase in H2O2 concentration after treatment of heat shock or oxidative stress [24, 25, 26]. For this reason, the effects of H2O2 and temperature on catalase enzyme production were investigated in A. fumigatus. Optimum growth temperature of Aspergillus generally varies from 28 to 30°C [23], and it has been reported that some can tolerate up to 55 °C [12]. Therefore, in this study, A. fumigatus was grown at different temperatures (28, 30, 35, 37, 42, 45, 50 and 55 °C) and the enzyme activity was measured using the cell free growth medium collected on the seventh day of cultivation when catalase activity was the highest. As shown in Table 1, the optimum temperature for enzyme production was 37 °C. Above 37 °C, enzyme production presented a sharp decrease and at 50 °C and 55 °C it was totally inhibited indicating that heat shock application presented negative effect on catalase activity. On the other hand, the activity value (213 U/mL) measured in A. fumigatus grown at 37 °C was 3 to 3.6 times higher than the reported values (59-65 U/mL) for the catalase enzymes of Aspergillus species grown at lower temperatures [23].
| Growth temperature (°C) | Catalase activity (U/mL) |
|---|---|
| 28 | 115±8.9 |
| 30 | 186±9.6 |
| 37 | 213±9.4 |
| 42 | 23±6.1 |
| 45 | 16±4.4 |
| 50 | 0 |
| 55 | 0 |
Table 1: Effect of temperature on catalase production.
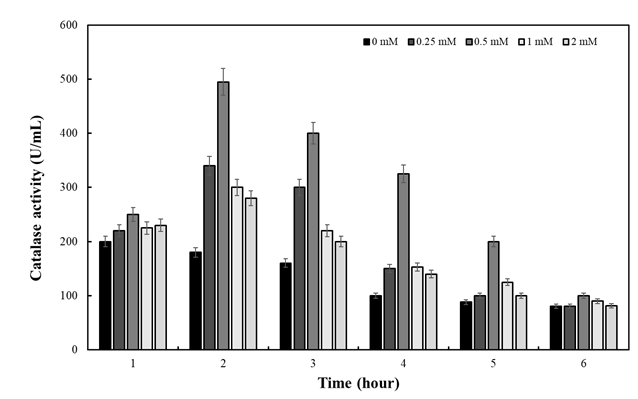
To introduce oxidative stress, H2O2 was added as described in Materials and Methods section. Figure 2 revealed that H2O2 at all concentrations resulted in higher catalase activity in comparison to the control (no H2O2 present). The highest activity was observed in the presence of 0.5 mM H2O2 at second hour of H2O2 treatment. This result was consisted with previous reports [13, 25, 27].
Catalase Purification
Catalase enzyme was purified by anion exchange chromatography and size exclusion chromatography. Purification fold and activity recovery values were calculated as 24 and 55%, respectively Table 2.
| Volume(mL) | Total activity (U) | Total protein (mg) | Purification fold | Activity recovery (%) | |
|---|---|---|---|---|---|
| Crude extract | 25 | 12375 | 75 | 1 | 100 |
| AEC | 30 | 8910 | 5.4 | 10 | 72 |
| SEC | 9 | 6806 | 1.7 | 24 | 55 |
| Microorganism | Chromatographic method | Purification fold | Activity recovery (%) | Reference | |
| Scytalidium thermophilum | AEC, SEC | 10 | 45 | Sutay Kocabas, et al. [16] | |
| Thermoascus aurantiacus | Ethanol precipitation, DEAE (DE-52), Sep (CL6B) | 5.1 | 29.9 | Wang, et al. [28] | |
| Septoria tritici | Dialysis, DEAE-C, Phenyl Sep | 36 | 13.6 | Levy, et al. [21] | |
| Neurospora crassa | Acetone precipitation, ASF, Phenyl Sep column | 170 | 48 | Diaz, et al. [35] | |
| Aspergillus fumigatus | AEC, SEC | 24 | 55 | This study |
Table 2: Comparison of purification parameters of catalase enzymes isolated from different fungi. Sep: sepharose; ASF: ammonium s
Table 2: Purification results for two-step chromatography of catalase from Aspergillus fumigatus. AEC: Anion exchange chromatography, SEC: Size exclusion chromatography Table 3 compares the purification parameters revealed by different fungal catalases. Accordingly, the activity recovery value (55%) obtained in this study is the highest among the reported values (13.6-48%). The purification fold value is higher than that reported for catalases from S. thermophilum and Thermoascus aurantiacus. On the other hand, it is slightly lower than that given for catalase from Septoria tritici, while quite lower than Neurospora crassa catalase.
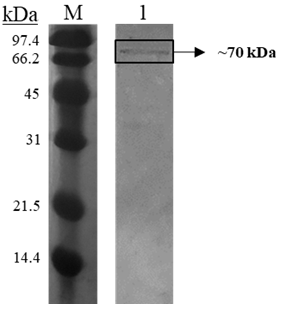
Table 3: Comparison of purification parameters of catalase enzymes isolated from different fungi. Sep: sepharose; ASF: ammonium sulfate fractionation; SEC: size exclusion chromatography; DEAE-C: DEAE cellulose; AEC: anion exchange chromatography The purity of catalase enzyme eluted from size exclusion column was checked using SDS-PAGE. As shown in Figure 3, a single band corresponding to approximately 70 kDa was detected. Catalases from other fungi have been reported to possess 61–97 kDa subunit size. For example, the subunit of S. thermophilum catalase is 80 kDa [16] and that of T. aurantiacus is 75 kDa [28].
Effect of Temperature on Catalase Enzyme and Stability
How enzyme reacted in response to change in reaction temperature was presented in Figure 4A. The optimum reaction temperature of A. fumigatus catalase was found to be 60 °C. Although above 60 °C the catalase enzyme activity gradually decreased, percent activity values were 80% and 70% at 70 °C and 80 °C, respectively. Relatively high activity values observed at higher temperatures indicate that the catalase enzyme can still function at elevated temperatures. Similar to our results, catalases from different sources including Bacillus sp., Desulfovibrio gigas and S. thermophilum have been reported to reach its optimum level at 60 °C [16, 29, 30].
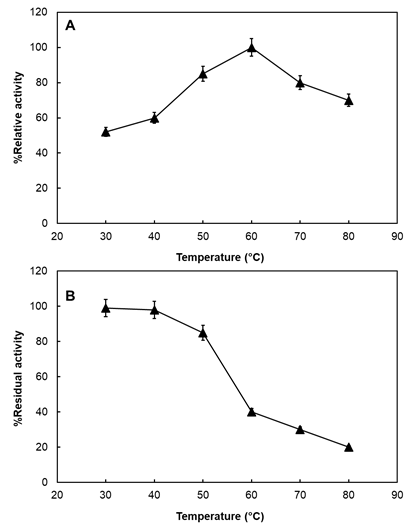
In terms of thermal stability, catalase enzyme considerably maintained its original activity up to 50 °C as shown in Figure 4B. 99%, 98% and 85% of its initial activity were remained at 30 °C, 40°C and 50 °C, respectively. On the other hand, 60% (60 °C), 70% (70 °C) and 80% (80 °C) of activity was lost at higher temperatures. The stability presented at 50 °C by Aspergillus catalase would be an advantage for its use in industrial applications. There are examples of catalases revealed stability at lower temperatures including Serratia marcescens FZSF01 and Escherichia coli catalase [31, 32].
Effect of pH on Catalase Enzyme and Stability
The effect of reaction mixture prepared at different pH values (4.0-11.0) on catalase activity was also investigated. The highest activity was measured at pH 7.0 Figure 5A. On the other hand, percent relative activity values were closest to 100% at pH 6.0 (88%) and pH 8.0 (92%). Even at acidic pH values activity values were 60% (pH 4.0) and 75% (pH 5.0) with respect to its highest observed at pH 7.0. However, at pH values above 9.0, more than 50% decrease was observed. The results reveal that Aspergillus catalase can actively work in a wide range of pH. The optimum reaction pH value is similar to that reported for various catalases including Beauveria bassiana, Rhodospirillium rubrum S1 and S. thermophilum catalases [16, 33, 34].
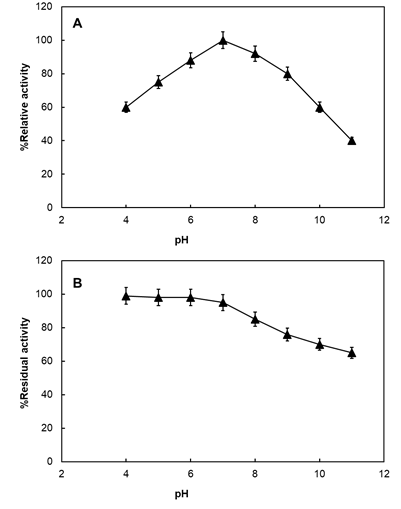
The results of the pH stability studies are given in Figure 5B. Accordingly, catalase enzyme remained stable up to pH
7.0 and then a gradual decrease was detected up to the final pH value (11.0) tested. At pH 11.0, 65% of original activity was maintained. Consistent with our results, catalase from T. aurantiacus has been reported to remain stable at pH values from 5.0 to 13.0 [28]. The stability exerted over a wide pH range is important especially for enzymes exposed to ambient pH for a long time in industrial applications.
Determination of Km and Vmax
The Michaelis Menten graph and Lineweaver-Burk diagram to calculate the Km and Vmax values of the A. fumigatus catalase enzyme are given in Figure 6. According to the graph, the Km and Vmax values were determined as 7.4 mM and 1250 μmole min-1 L-1, respectively. The Km value of A. fumigatus catalase was lower than Archaeoglobus fulgidus catalase (8.6 mM), N. crassa catalase (21.7 mM), B. subtilis 168 catalase (39 mM), and Serratia marcescens SYBC08 catalase (78 mM), but higher than Septoria tritici catalase (3.4 mM) and Klebsiella pneumoniae (6.5 mM) catalase [35, 36, 37, 38, 39].
![Figure 6: According to the graph, the Km and Vmax values were determined as 7.4 mM and 1250 μmole min-1 L-1, respectively. The Km value of A. fumigatus catalase was lower than Archaeoglobus fulgidus catalase (8.6 mM), N. crassa catalase (21.7 mM), B. subtilis 168 catalase (39 mM), and Serratia marcescens SYBC08 catalase (78 mM), but higher than Septoria tritici catalase (3.4 mM) and Klebsiella pneumoniae (6.5 mM) catalase [35- 39].](/fulltextimages/9637/fig_6.png)
Effect of Organic Solvents on Catalase Activity and Stability
The effect of organic solvents on catalase enzyme activity is shown in Figure 7. Organic solvents can change the physicochemical properties of proteins. In general, non-covalent bonds in the protein change properties such as dipoles and ionic groups, hydrophobic interactions, and hydrogen bonds [40]. The enzyme stability was in the order of Ethanol>Acetone>Methanol>DMSO. It always remained 55-70% of its original activity (no solvent present) in ethanol up to 20% (v/v).
![Figure 7: Organic solvents can change the physicochemical properties of proteins. In general, non-covalent bonds in the protein change properties such as dipoles and ionic groups, hydrophobic interactions, and hydrogen bonds [40]. The enzyme stability was in the order of Ethanol>Acetone>Methanol>DMSO. It always remained 55-70% of its original activity (no solvent present) in ethanol up to 20% (v/v).](/fulltextimages/9637/fig_7.png)
Conclusion
In this study, catalase production from A. fumigatus was optimized. Time course of catalase production has shown that enzyme production reaches its optimum value on the 7th day of cellular growth when A. fumigatus was in the stationary phase. This indicates that enzyme production occurs as a result of secondary metabolism. Additionally, the catalase activity was increased when 0.5 mM H2O2 (as a source of oxidative stress) was added to the culture medium. Catalase enzyme was purified from A. fumigatus for the first time. The purification factor and activity recovery values were calculated as 24-fold and 55%, respectively. The purity was checked by SDS-PAGE, where a single band was observed. The molecular weight was calculated as approximately 70 kDa. The optimum temperature and pH of the pure enzyme were determined as 60 °C and 7.0, respectively. It was also observed that the enzyme remained stable for about 2 h between 30°C-50°C and pH 4.0-9.0. With the help of Lineweaver- Burk diagram (1/S vs 1/V) Km value was calculated as 7.4 mM and Vmax value was calculated as 1250 μmole min-1 L-1. Finally, the resistance of the enzyme to organic solvents was determined as Ethanol>Acetone>Methanol>DMSO at concentrations ranging from 2.5% to 20%. The stability of Aspergillus catalase against varying temperature and pH values can provide an advantage to the enzyme for its use in long lasting processes during industrial applications.
In addition, the exerted resistance of the enzyme against different organic solvents at various concentrations is another remarkable characteristic supporting enzyme use in industry where organic solvents are predominantly used.
Acknowledgements
This work was funded by Kocaeli University Scientific Research Projects Coordination Unit (Project Number: 2018/126).
References
-
Chelikani P, Fita I, Loewen PC (2004) Diversity of structures and properties among catalases. Cell Mol Life Sci 61(2): 192-208.
-
Maté MJ, Zamocky M, Nykyri LM, Herzog C, Alzari PM, et al. (1999) Structure of Catalase-A from Saccharomyces cerevisiae. J Mol Biol 286(1): 135-149.
-
Chen N, Teng XL, Xiao XG (2017) Subcellular localization of a plant catalase-phenol oxidase, AcCATPO, from Amaranthus and identification of a non-canonical peroxisome targeting signal. Front Plant Sci 8: 1345.
-
Loncar N, Fraaije MW (2015) Not so monofunctional—a case of thermostable Thermobifida fusca catalase with peroxidase activity. Appl Microbiol Biotechnol 99(5): 2225-2232.
-
Sangar S, Pal M, Moon LS, Jolly RS (2012) A catalase- peroxidase for oxidation of β-lactams to their (R)- sulfoxides. Bioresour Technol 115: 102-110.
-
Vetrano AM, Heck DE, Mariano TM, Mishin V, Laskin DL, et al. (2005) Characterization of the oxidase activity in mammalian catalase. J Biol Chem 280(42): 35372- 35381.
-
Yuzugullu Y, Trinh CH, Smith MA, Pearson AR, Phillips SEV, et al. (2013) Structure, recombinant expression and mutagenesis studies of the catalase with oxidase activity from Scytalidium thermophilum. Acta Crystallogr D Biol Crystallogr 69(Pt 3): 398-408.
-
Wyss M, Pasamontes L, Remy R, Kohler J, Kusznir E, et al. (1998) Comparison of the thermostability properties of three acid phosphatases from molds: Aspergillus fumigatus phytase, A. niger phytase, and A. niger pH 2.5 acid phosphatase. Appl Environ Microbiol 64(11): 4446- 4451.
-
Cooney DG, Emerson R (1966) Thermophilic fungi: an account of their biology, activities, and classification. Journal of General Microbiology 6(2): 137.
-
Flores RVG, Ceniceros EPS, Gamez RDL, Garcia CB, Hernandez JLM, et al. (2014) Production of glucose oxidase and catalase by Aspergillus niger free and immobilized in alginate-polyvinyl alcohol beads. J Gen Appl Microbiol 60(6): 262-269.
-
Soyler BU (2012) Characterization and analysis of the antioxidant capacity of functional phenolics oxidized by Scytalidium thermophilum Catalase Phenol Oxidase (CATPO). Master Thesis, METU, Ankara, Turkey.
-
Chang YC, Tsai HF, Karos M, Chung KJK (2004) THTA, a thermotolerance gene of Aspergillus fumigatus. Fungal Genet Biol 41(9): 888-896.
-
Kawasaki L, Aguirre J (2001) Multiple catalase genes are differentially regulated in Aspergillus nidulans. J Bacteriol 183(4): 1434-1440.
-
Bradford MM (1976) A rapid and sensitive method for the quantitation of microgram quantities of protein utilizing the principle of protein-dye binding. Anal Biochem 72: 248-254.
-
Merle PL, Sabourault C, Richier S, Allemand D, Furla P (2007) Catalase characterization and implication in bleaching of a symbiotic sea anemone. Free Radic Biol Med 42(2): 236-246.
-
Kocabas DS, Bakir U, Phillips SEV, McPherson MJ, Ogel ZB (2008) Purification, characterization, and identification of a novel bifunctional catalase-phenol oxidase from Scytalidium thermophilum. Appl Microbiol Biotechnol 79(3): 407-415.
-
Laemmli UK (1970) Cleavage of structural proteins during the assembly of the head of bacteriophage T4. Nature 227(5259): 680-685.
-
Sutay D (2007) Purification, characterization, crystallization, and preliminary x-ray structure determination of Scytalidium thermophilum bifunctional catalase and identification of its catechol oxidase activity. PhD Thesis, METU, Ankara, Turkey.
-
Lineweaver H, Burk D (1934) The determination of enzyme dissociation constants. J Am Chem Soc 56(3): 658-666.
-
Ögel ZB, Yüzügüllü Y, Mete S, Bakir U, Kaptan Y, et al. (2006) Production, properties, and application to biocatalysis of a novel extracellular alkaline phenol oxidase from the thermophilic fungus Scytalidium thermophilum. Appl Microbiol Biotechnol 71(6): 853-862.
-
Levy E, Eyal Z, Hochmant A (1992) Purification and characterization of a catalase-peroxidase from the fungus Septoria tritici. Arch Biochem Biophys 296(1): 321-327.
-
Bučková M, Godočíková J, Šimonovičová A, Polek B (2005) Production of catalases by Aspergillus niger Isolates as a response to pollutant stress by heavy metals. Current Microbiol 50(4): 175-179.
-
Sooch BS, Kauldhar BS, Puri M (2014) Recent insights into microbial catalases: isolation, production, and purification. Biotechnol Adv 32(8): 1429-1447.
-
Calera JA, Weatherby JS, Medrano RL, Leal F (2000) Distinctive properties of the catalase B of Aspergillus nidulans. FEBS Lett 475(2): 117-120.
-
Kawasaki L, Wysong D, Diamond R, Aguirre J (1997) Two divergent catalase genes are differentially regulated during Aspergillus nidulans development and oxidative stress. J Bacteriol 179(10): 3284-3292.
-
Jordão MAN, Couto RM, Goldman MHS, Aguirre J, Iyer S, et al. (1999) Catalase activity is necessary for heat-shock recovery in Aspergillus nidulans germlings. Microbiol 145(Pt 11): 3229-3234.
-
Fiedurek J, Gromada A (2000) Production of catalase and glucose oxidase by Aspergillus niger using unconventional oxygenation of culture. J Appl Microbiol 89(1): 85-89.
-
Wang H, Tokusige Y, Shinoyama H, Fujii T, Urakami T (1998) Purification and characterization of thermostable catalase from culture broth of Thermoascus aurantiacus. J Ferment Bioeng 85(2): 169-173.
-
Gudelj M, Fruhwirth GO, Paar A, Lottspeich F, Robra KH, et al. (2001) A catalase– peroxidase from a newly isolated thermoalkaliphilic Bacillus sp. with potential for the treatment of textile bleaching effluents. Extremophiles 5(6): 423-429.
-
Santos WGD, Pacheco I, Liu MY, Teixeira M, Xavier AV, et al. (2000) Purification and characterization of an iron superoxide dismutase and a catalase from the sulfate- reducing bacterium Desulfovibrio gigas. J Bacteriol 182(3): 796-804.
-
Jia X, Lin X, Lin C, Lin L, Chen J (2017) Enhanced alkaline catalase production by Serratia marcescens FZSF01: enzyme purification, characterization, and recombinant expression. Electron J Biotechnol 30: 110-117.
-
Nadler V, Goldberg I, Hochman A (1986) Comparative study of bacterial catalases. Biochim Biophys Acta 882(2): 234-241.
-
Pedrini N, Juarez MP, Crespo R, Alaniz MJTD (2006) Clues on the role of Beauveria bassiana catalases in alkane degradation events. Mycologia 98(4): 528-534.
-
Kang YS, Lee DH, Yoon BJ, Oh DC (2006) Purification and characterization of a catalase from photosynthetic bacterium Rhodospirillum rubrum S1 grown under anaerobic conditions, J Microbiol 44(2): 185-191.
-
Diaz A, Rangel P, Oca YMD, Lledias F, Hansberg W (2001) Molecular and kinetic study of catalase-1, a durable large catalase of Neurospora crassa. Free Radic Biol Med 31(11): 1323-1333.
-
Hochman A, Goldberg I (1991) Purification and characterization of a catalase–peroxidase and a typical catalase from the bacterium Klebsiella pneumoniae. Biochim Biophys Acta 1077(3): 299-307.
-
Kengen SW, Bikker FJ, Hagen WR, Vos WMD, Oost JVD (2001) Characterization of a catalase–peroxidase from the hyperthermophilic archaeon Archaeoglobus fulgidus. Extremophiles 5(5): 323-332.
-
Li J, Zhanga Y, Chena H, Liua Y, Yang Y (2013) Purification and characterization of recombinant Bacillus subtilis 168 catalase using a basic polypeptide from ribosomal protein L2. Biochem Eng J 72: 83-89.
-
Zeng HW, Cai YJ, Liao XR, Zhang F, Zhang DB (2011) Production, characterization, cloning and sequence analysis of a monofunctional catalase from Serratia marcescens SYBC08. J Basic Microbiol 51(2): 205-214.
-
Rehan M, Younus H (2006) Effect of organic solvents on the conformation and interaction of catalase and anticatalase antibodies. Int J Biol Macromol 38(3-5): 289-295.
- Antifungal Activity of New Acetophenone Derivatives
- Interconnected Microbiomes Human Health Within an Environmental Framework
- Silkworm-Based Vaccine Production for H5N1: A One Health Approach to Pandemic Preparedness
- Microbial Diversity and Lipolytic Activity of Bacteria and Fungi from Oil-Contaminated Sites in Makurdi Metroplois
- Antibiotic Resistance Profile of Bacteria Isolated at the Central Laboratory of the National Hospital Center of Nouakchott
- Epidemiology and Sensitivity to Antibiotics of Germs Isolated from Blood Cultures in the Laboratory of the National Hospital Center of Nouakchott-Mauritania