Determination of Homocysteine and Lipid Profile Level in the Blood of Chronic Kidney Disease Patients with and without Hemodialysis in Comparison to Normal Healthy Individuals
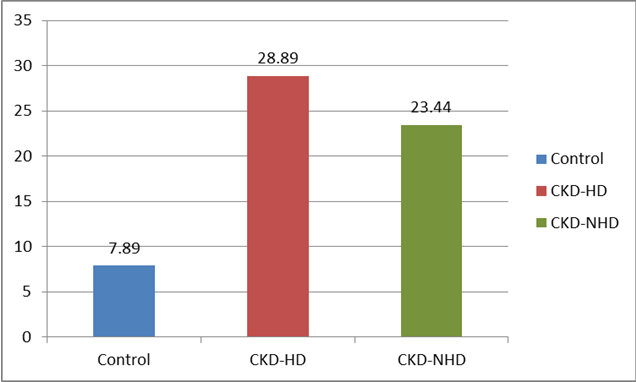
Background: Homocysteine a thiol-containing amino acid is an intermediatory product formed in the metabolic conversion of methionine to cysteine. Patients with chronic kidney disease cause many abnormalities in amino acid and protein metabolism leading to increase in homocysteine concentration. This is due to the deficiency of enzymes or vitamin required as a cofactor for homocysteine metabolism. Objective: The aim of this study is to evaluate the role and measurement of hemocysteine and lipid profile in chronic kidney disease patients with and without hemodialysis in comparison to healthy individuals. Methodology: A case-control analytical study that was conducted at Isra University Hospital, Liaquat University of Medical Science Hospital, Bhitai Hospital Hyderabad. The study subjects were selected through non-probability purposive sampling based on inclusion and exclusion criteria. Total 90 subjects were taken comprised of three groups. Subjects in group-A are normal control healthy individuals. The case subjects were kept in group-B as chronic kidney disease patients with hemodialysis and group-C as chronic kidney disease patients without hemodialysis. Whole blood 5cc was collected for the quantitative determination of homocysteine and lipid profile status of each subject by using assay kits of each variable through Roche 902 automated chemical analyzer. The statistical data was analyzed on SPSS version 21.0. T-test was used to assess the significance with level of ≤0.05. Results: The data obtained by the present study showed that the mean age ± SD in group-A,B and C was found to be as 49.83 ± 5.05, 52.46 ± 5.63 and 50.51 ± 5.39 years respectively with p-value 0.14. In case of homocysteine the mean ± SD in all groups was 7.89 ± 2.78, 28.89 ± 9.27 and 23.44 ± 6.81 with p-value
Introduction
It is well known that homocysteine which is sulfhydryl amino acid showed similar chemical characteristics to cysteine, hence this amino acid has given name as homocysteine. It is an intermediatory product formed during the metabolic conversion of methionine to cysteine [1, 2]. This amino acid is produced through demthylation process of dietary methionine found in abundant as animal protein. It is present in plasma in different forms, about 1% as free thiol in circulation, 70- 80% remains disulfide bound to plasma proteins mainly albumin and 20-30% combines itself to form the dimer homocysteine or with other thiols [3]. It is reported in studies that homocysteine which is considered as a main determination of methylation cycle is methylated to methionine that undergoes in the process of S- adenosylation and forms S-adenosylmethionine (SAM) which is the main methyl donor considered for all the methylation process in the cells. This methylation is accompanied by energy loss so this reaction is irreversible where as demethylation reaction leads to the formation of S-adenosylhomocysteine (SAH) which is a thioether analogous to methionine [4, 5].
In a recent study it has been reported that homocysteine which is a leading factor that can be used in two way during the methylation reaction process. One in case of homocysteine deficiency it is re-methylated to methionine in the presence of enzyme N5, N10- methylenetetrahydrofolate reductase that converts homocysteine to methionine. Secondly in case of sufficient amount of methionine that instead of homocysteine cysteine is produced. This is achieved in the presence of cystathionine – β synthetase with pyridoxine as a cofactor converts homocysteine to cysteine [2, 5, 6]. It has also been reported in studies that homocysteine is primarily trans- sulfurated in the kidney and deficiency of this trans- sulfurated ultimately causes the rise of plasma homocysteine under different physiological or pathological conditions such as hypertension, diabetes mellitus, aging and end stage of renal disease ESRD [7, 8].
Homocysteine which is an intermediatory product of methionine metabolism is considered as a risk or pathogenic factor in the progression of chronic kidney disease (CKD) which has been considered globally as a serious health issue [9, 10]. Patients with chronic kidney disease or receiving hemodialysis treatment showed low grade inflammatory status. It has also been reported that early stage of kidney disease (stage 2-3) patients showed significant lower plasma PLP levels and homecysteine concentrations than patients in an advanced stage (stage 4-5) and those undergoing hemodialysis [11, 12, 13]. It has been shown in a study that patients with chronic kidney disease showed signs of dyslipidemia which is characterized by elevated serum triglyceride and low density lipoprotein levels but reduced serum high density lipoprotein levels [14].
Several studies in this respect reported that age, blood pressure, diabetes, proteinuria, dyslipidemia as apolipoprotein B or high density lipoprotein cholesterol level abnormalities and smoking were associated with the subsequent decline in glomerular filtration rate [15, 16, 17]. Therefore, the aim of this study is to measure the homocysteine level and lipid profile in the blood samples of chronic kidney disease patients with or without hemodialysis in comparison to control subjects as well as to evaluate the role of homocysteine as a potential biomarker in the progression and diagnosis of chronic kidney diseases.
Methodology
Study design
It is a case-control study that was conducted to evaluate the homocysteine level and lipid profile as a prognostic tool in chronic kidney disease patients with and without hemodialysis.
Study Setting
This case-control study was performed at Isra University Hospital Hyderabad, Liaquat University Hospital Hyderabad and Bhitai Hospital Latifabad, Hyderabad.
Inclusion Criteria
a. Normal healthy individuals between 40-65 years age of both genders (as control) b. Chronic kidney disease patients between 40-65 years ago with or without hemodialysis (as case-control subjects) Exclusion Criteria a. Patients below and above age of 40-65 years b. Any drug intake history
Sample Techniques
a. Non-probaility sampling technique
Consideration of sample size
a. Sample size was calculated and set on 90 subjects that includes:
- 30 control subjects
- 30 case control CKD patients with hemodialysis
- 30 case control CKD patients without hemodialysis
Experimental
Collection of Blood Samples
Whole blood 5cc was collected in sample tubes from control and case subjects separately and simultaneously. All the blood samples were left for 30 minutes to allow the blood to clot for the separation of serum from clotted blood. Collect the supernatant serum into another tube and kept in refrigerator at -20oC for biochemical analysis.
Biochemical Assessment
Determination of Homocysteine
Honrocysteine level in the blood was carried out according to chemiluscent micro particle immunoassay kit system of Abbot 2007. This is a one-step immunoassay for the quantitative determination of L_homocysteine in human serum using CMIA technology with slight modification in the protocol [18]. Normal value: 5-15 µmol/L.
Lipid Profile
Determination of Free Cholesterol
Cholesterol level in the blood was carried out according to Roche diagnostic kit method using Roche- Hitachi modular analyzer. The analyzer automatically calculated the concentration of each sample in the blood. The conversion factor used was: mg/dl x 0.0259 = mmol/L OR mmol/L x 38.66 = mg/dl. Assay Procedure The method is based on the determination of Δ4- cholestenone by the enzymatic cleavage of cholesterol ester by cholesterol esterase to produce free cholesterol and fatty acids. The cholesterol is then converted to cholest-4 aminophenazone which inturn produces color to determine the concentration of choleterol through photometrically. Determination of Triglycerides The level triglyceride in the blood was determined according to Roche diagnostic kit. The test was performed on Roche- Hitachi modular analyzer. The analyzer automatically calculated the concentration of each sample in the blood.
The conversion factor used was: mg/dl x 0.0113 = mmol/L OR mmol/L x 88.5 = mg/dl. Assay Procedure The method is based on wahlefeld using an enzyme lipoprotein lipase for the rapid and complete hydrolysis of triglyceride (TG) to glycerol followed by oxidation to dihydroxy acetone phosphate and hydrogen peroxide which then reacts with 4-amino phenzone and 4- chlorophenol under the catalytic action of perozidase to form a red dyestuff. The color intensity of red dry stuff formed is directly proportional to the triglyceride concentration that was ultimately measured photometrically. Determination of LDL- Cholesterol LDL –Cholesterol level in the blood was determined according to Roche diagnostic kit method which was carried out by using Roche-Hitachi modular analyzer which automatically calculated the concentration of LDL- Cholesterol in each sample of the blood. The conversion of factor used was: mmol/L x 38.66 = mg/dL, mmol/L x 0.386 = g/dL and mg/dl x 0.259 = mmol/L Assay Procedure LDL- cholesterol was broken down quantitatively into free cholesterol and fatty acids by cholesterol esterase. The LDL – cholesterol was than oxidized to Δ4- cholestenone and hydrogen peroxide by cholesterol oxidase. The hydrogen peroxide produced then reacted with 4-aminoantipyrine to form a purple blue color which was then measured photometrically at 585nm. Determination of HDL-cholesterol HDL-cholesterol level in the blood was determined according to Roche diagnostic kit method. The test was carried out on Roche-Hitachi modular analyzer which automatically calculated the concentration of HDL- cholesterol level in each sample of the blood. The conversion factors used were: mmol/L x 38.66 = mg/dL, mmol/L 3.86 = g/dLamd mg / dL x 0.0259 = mmol/L Assay Procedure The HDL-cholesterol concentration was determined enzymatically by cholesterol esterase and cholesterol oxidase to Δ4- cholestenone and hydrogen peroxide which was then reacted with 4-amino antipyrine and HSDA to form purple blue color. The color intensity was then measured photometrically at 585nm.
Data Analyses
SPSS version 20.0 was used for data analysis. Descriptive statistics was applied. ANOVA and chi-square test was used to assess the significance p-value of <0.05.
Results
The present study was taken into consideration to evaluate the quantitative determination of serum homocysteine (Hcy), serum cholesterol, triglycerides (TG), low density lipoproteins (LDL) and high density lipoproteins (HDL) between the case control kidney disease patients and normal healthy subjects. Total 90 subjects were included in the study and were divided into three groups comprised of 30 normal health control subjects, 30 case control kidney disease patients with hemodialysis and 30 case control kidney disease patients without hemodialysis.
In the present study the age-matched subjects were considered ranging from 40-65 years of age. In case of age-matched distribution in the study subjects the mean ± SD age in case of normal controls, chronic kidney disease (CKD) patients with hemodialysis (HD) and chronic kidney disease patients without hemodialysis was found to be as 49.83 ± 5.05, 52.46 ± 5.63 and 50.51 ± 5.39 years respectively with p-value 0.14 (Table 1).
| Study Subjects (n=90) | Mean | SD | F-value | P-value |
|---|---|---|---|---|
| Controls | 49.83 | 5.05 | 1.95 | 0.14 |
| (n=30) | 49.83 | 5.05 | 1.95 | 0.14 |
| CKD-HD | 52.46 | 5.63 | 1.95 | 0.14 |
| (n=30) | 52.46 | 5.63 | 1.95 | 0.14 |
| CKD-NHD | 50.51 | 5.39 | 1.95 | 0.14 |
Table 1: Age Distribution in Study Subjects.
CKD= Chronic Kidney Disease, HD= Hemodialysis, NHD= Non-hemodialytics Table 1: Age Distribution in Study Subjects.
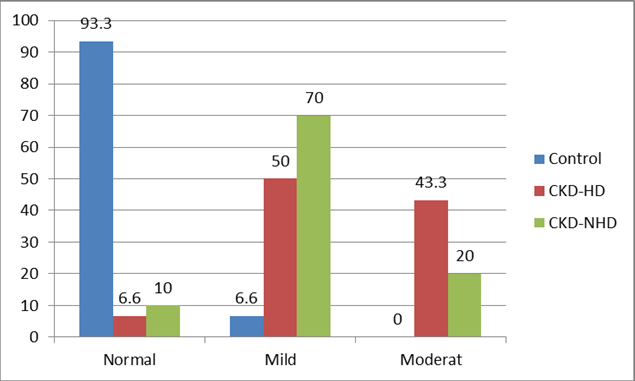
Regarding quantification the homocysteine level in the blood showed significant difference among the study groups. The mean ± SD level of serum homocysteine is healthy controls, CKD with HD and CKD without HD was noted as 7.89 ± 2.78, 28.89 ± 9.27 and 23.44 ± 6.81 µmol/L with p-value <0.0001 (Figures 1 & 2). In addition categorical status of serum homocysteine levels of normal, mild and moderate concentration found in control, CKD with HD and CKD without HD were found to be as 28(93.3%), 2(6.6%) and 0(0%), 2(6.6%), 15(50%) and 13(43.3%), 3(10%), 21(70%) and 6(20%) respectively with p-value 0.03 (Table 2).
| Hcy Quantification | Frequency Status of Hcy | |||||||
|---|---|---|---|---|---|---|---|---|
| μmol/L (n=90) | μm/L (n=90) | |||||||
| Subjects | Mean | SD | p-value | Subjects | Normal Hcy | Mild Hcy | Moderate Hcy | p-value |
| Subjects | Mean | SD | p-value | Subjects | 15 | Hcy | Hcy | p-value |
| Subjects | Mean | SD | p-value | Subjects | μm/L | 16-30 | 31-100 | p-value |
| Subjects | Mean | SD | p-value | Subjects | μm/L | μm/L | p-value | |
| Control(n=30) | 7.89 | 2.78 | <0.001 | Control | 28 | 2 | 0 | 0.03 |
| (n=30) | 7.89 | 2.78 | <0.001 | (n=30) | -93.30% | -6.60% | 0% | 0.03 |
| CKD-HD(n=30) | 28.89 | 9.27 | <0.001 | CKD-HD | 2 | 15 | 13 | 0.03 |
| (n=30) | 28.89 | 9.27 | <0.001 | (n=30) | -6.60% | -50% | -43.30% | 0.03 |
| CKD-NHD | 23.44 | 6.81 | <0.001 | CKD-NHD | 3 | 21 | 6 | 0.03 |
| CKD-NHD | 23.44 | 6.81 | <0.001 | (n=30) | -10% | -70% | -20% | 0.03 |
Table 2: Quantification and Categorial Status of Hemocysteine.
Hcy = Homocysteine, CKD = Chronic Kidney Disease HD = Hemodialysis, NHD = Non-Hemodialysis SD = Standard Deviation Table 2: Quantification and Categorial Status of Hemocysteine.
Serum triglycerides, serum LDL and HDL showed statistically significant differences among all the three groups. Serum triglycerides and LDL were raised in patients with hemodialysis while serum HDL was found in lower limit. In case of serum triglycerides the mean ±SD serum triglycerides in controls, CKD with HD and CKD without HD the level noticed was found to be as 100.16 ± 21.60, 189.80 ± 70.71 and 160.26 ± 69.36 mg/dL with p- value <0.001.
Regarding serum LDL, it was raised significantly in the hemodialytic patients in comparison to non-hemodialytic and normal control subjects. The mean ±SD of serum LDL in controls, CKD with HD and CKD without HD was found to be as 84.00 ± 1946, 134.73 ± 33.79 and 112.66 ± 25.25 mg/dL with p-value of <0.001 respectively.
Serum HDL on the other hand was also reduced significantly in the hemodialytic patients as compared to non-hemodialystic and control subjects. The mean ±SD serum HDL in control, CKD with HD and CKD without HD was noted as 40.93 ± 4.40, 23.41 ± 5.66 and 26.21 ± 7.44 mg/dL with p-value of <0.001 respectively (Table 3).
Variables Control
CKD-HD
CKD-NHD
p- value Cholesterol (mg/dL) 137.46 131.6 147.16 0.41
(n=30) (n=30) (n=30) Triglycerides
100.16 ±
189.80 ±
160.26 ±
69.36 <0.001 (mg/dL)
- CKD = Chronic Kidney Disease, HD = Hemodialysis, NHD = Non-Hemodialysis
Table 3: Lipid Profile in the Study Population (n=90).
Discussion
In this case control study we have analyzed serum homocysteine cholesterol, triglycerides (TG), low density lipoproteins (LDL) and high density lipoproteins (HDL) in the different group of persons. The prevalence of hyperthomocysteinemia in the different age groups of chronic kidney disease patients was evaluated and found that the mean ± SD age in control subjects, CKD with hemodialysis and CKD without hemodialysis was 49.83 ± 5.05, 52.46 ± 5.63 and 50.51 ± 5.39 years in the age- matched subjects of different groups with p-value 0.14 respectively. The age-matched findings of different groups by the present study are found consistent to the previous studies [19, 20, 21]. Serum homocysteine showed highly significant difference among the study groups. Frequency of normal, mild and moderate homocysteine in control, CKD with HD and CKD without HD were found as 93.3%, 6.6% and 0%, 6.6%, 50% and 43.3%, 10%, 70% and 20% with p-value of 0.03 respectively. It has been observed that the finding of serum homocysteine (Hcy) noted is consistent to the previous studies [20, 22, 23]. It has been reported in a study that whether plasma pyridoxal 5- Phosphate and homocysteine were dependent or independent each other in order to be associated with inflammatory markers in patients with chronic kidney disease (CKD) or those receiving hemodialysis treatment [24]. The homocysteine of above study is parallel to our present study as the mean ± SD Hcy in control, CKD with HD and CKD without HD was found to be as 7.89 ± 2.78, 28.89 ± 9.27 and 23.44 ± 6.81 µmol/L with p-value of 0.0001 respectively. Our findings are worth to be noted that Hcy prevalence in CKD and more in CKD with hemodialysis. However a reduction in serum Hcy with folate therapy is an incomparable observation as it was not evaluated by the present study.
Serum triglycerides and low density lipoprotein (LDL) were raised in HD patients while serum high density lipoprotein was reduced. Serum LDL was raised significantly in the hemodialytic patients as compared to non-hemodialytics and control subjects. Due to the similar finding noted by the present study are almost in line with the studies cited in the literature [22, 25]. In a study it has been reported that there was no difference found in the serum cholesterol between CKD with HD and CKD – without HD with p-value > 0.05. The above finding is a comparable finding to our present study as we have not found any significant differences among the study group [26].
It has been observed that chronic kidney disease patients which were on hemodialysis showed raised serum homocysteine, triglycerides and low density lipoproteins but low high density lipoproteins. Hence through this study it is clearly noticed that the chronic disease patients are likely prone to develop altheroschlerosis and other cardio vascular related diseases. Therefore the importance of present study lies in the fact that the chronic kidney (CKD) subjects are prone to high mortality mainly because of cardiac vascular disease [19, 27]. Previous studies reported that the serum Hcy is inversely associated with the glomerular filtration rate (GFR) which decreases progressively in the CKD patients but epidemiological studies have shown elevated serum Hcy in CKD which is associated positively with CVD [28, 29].
Limitations of the study
The quantitative approach of our study has assured that we have assessed the extensive range of patients of chronic kidney disease. However, due to the utilization of non-probability sampling technique the study might not be immune from selection bias. Furthermore the study design might create the possibility of observer bias.
Conclusion
It is concluded that the results obtained by the present study showed elevated homocysteine levels and dyslipidemia. The chronic kidney patients included in this study also showed signs of dyslipidemia which is characterized by increased serum triglycerides and low density lipoproteins while reduced serum high density lipoproteins. It has also been noticed that the hyporhomocysteinemia and dyslipidemia was found more profound in CKD patients with hemodialysis as compared to chronic kidney disease patients without hemodialysis but hyporhomocysteinemia in conjugation with dyslipidemia is thought to be a major risk factor for cardiovascular disease in chronic kidney disease patients particular which are on hemodialysis in particular.
References
-
The Nobel Prize in chemistry (1955) Nobel prize. Org. Nobel media AB 2013.
-
Fach D, Chiolero A, Paccaud F (2006) Homocysteine as a risk factor for cardio vascular disease. Swiss Med Wkly 136(47-48): 745-756.
-
Hankey RA, Eikclboom JW (1999) Homocysteine and vascular disease. Lancet 354(9176): 407-413.
-
Loscalzo J, Handy DE (2014) Epigenetic modifications: basic mechanisms and role in cardiac vascular disease. Pulm Circ 4(2): 169-174.
-
Harvey RA, Ferrier DR (2011) Lippincott’s Illustrated Reviews, Biochemistry 5th (Edn.), Wolters Kluwer Health, Phildelphia, pp: 264-265.
-
Ganguly P, Alam SF (2015) Role of homocysteine in the development of cardiovascular disease. Nutrition J 14: 6.
-
Li N, Chen I, Muh RW, Li PL (2006) Hyperhomocysteinemia associated with decreased renal trans- sulfuration activity in Dahl S rats. Hypertension 47(6): 1094-1100.
-
Van Guldener C, Stam F, Stehouwer CD (2005) Hyperhomocysteinemia in chronic kidney disease : focus on transmethylation. Clin Chem Lab Med 43(10): 1026-1031.
-
Stauffer ME, Fan T (2014) Prevalence of anemia in chronic kidney disease in the United States. PLoS One 9(1): e 84943.
-
Zhang L, Wang F, Wang L, Wang W, Liu B, et al. (2012) Prevalence of chronic kidney disease in China: a cross-sectional survey. Lancet 379(9818): 815-822.
-
Miyamoto T, Carrero JJ, Stenvinkel P (2011) Inflammation as a risk factor and target for therapy in chronic kidney disease. Curr Opin Nephro Hypertens 20(6): 662-668.
-
Kotur J, Stevuljevic S, Dopsaj V, Stefanovic A, Vujovic A, et al. (2012) A hazardous link between malnutrition, inflammation and oxidative stress in renal patients. Clin Biochem 45(15): 1202-1205.
-
Imig JD, Ryan MJ (2013) Immune and inflammatory role in renal disease. Compr Physiol 3(2): 957-976.
-
Kasiske BL (1998) Hyperlipidemia in patients with chronic renal disease. Am J Kidney Dis 32(5): 142- 156.
-
Clase CM, Garg AX, Kiberd BA (2002) Prevalence of low glomerular filtration rate in non-diabetic Americans. J Am Soc Nephrol 13(5): 1338-1349.
-
Muntner P, Coresh J, Smith JC, Klag MJ (2000) Plasma Lipids and risk of developing renal dysfunction: The atherosclerosis risk in communities study. Kidney Int 58(1): 293-301.
-
Meguid ENA, Bello Ak (2005) Chronic kidney disease: The global challenge. Lancet 365(9456): 331-340.
-
Maron B, Loscalzo J (2009) The treatment of hyperhomocysteinemia. Annu Rev Med 60: 39-54.
-
Sharma N, Mittal N (2013) Prevalence of hyperhomocysteinemia in chronic kidney disease and effect of supplementation of folic and vitamin B12 on cardiovascular mortality. J Ind Acad Clin Med 14(1): 33-36.
-
Wadwa PC, Sandhu J, Sandhu JS, Avasthi GL, Bajroa N, et al. (2015) Plasma homocysteine and total antioxidant status in diabetic chronic kidney disease and diabetic renal allogroft recipients: effect of folic acid therapy. Int J Clin Trials 2(1): 10-33.
-
Yassin MM, Lubbad AMH, Abu Taha AJ, Saadallah AM (2014) Homocysteine and hematological indices in hemodialysis patients. Ibnosina J Med 6(4): 173-179.
-
Rani PSU, Quarishi SMS, Manikanta M, Sudhakar P (2015) Homocysteine levels in chronic kidney disease stage-V End stage renal disease on maintenance of hemodialysis and their prognostic value in vascular diseases. J Evidence Med Healthcare 2(43): 7621- 7632.
-
Zengchun Ye MD, Cheng Wang MD, Quniz zhang MD, Yan Li MD, Jun Zhang MD, et al. (2017) Prevalence of homocysteine-related hypertension in patients with chronic kidney disease. J Clin Hypertension 19(2): 151-160.
-
Cheng-Hsu C, En-Ling Y, Chih-Chung C, Shin-Chien H, Yi-Chia H (2017) Vitamin B-6, independent of homocysteine is a significant factor in relation to inflammatory responses for chronic disease and hemodialysis patients. Bio Med Res Int Article ID 7367831: 1-8.
-
Yanjun L, Jing N (2016) Homocysteince in renal injury. Kidney Dis 2(2): 80-87.
-
Lakshmi PM, Silambanan S (2014) Comparative study of lipoproteins and lipid profile in chronic kidney disease patients with and without hemodialysis. J Evolution of Med Dent Sci 3(43): 10656-10664.
-
Agha Mohammadi V, Gargari BP, Alisgharzadeh A (2011) Effect of folic acid supplementation on homocysteine, serum total antioxidant capacity and malondialolehyde in patients with type 2 diabetes mellitus. J Am Coll Nutr 30(3): 210-215.
-
Li J, Shi M, Zhang H, Yan L, Xie M, et al. (2012) Relation with type 2 diabetes. Clin Nephrol 77(4): 305-310.
-
Lonn E, Yusuf S, Arnold MJ, Sheridan P, Pogue J, et al. (2006) Homocysteine lowering with folic acid and B vitamins in vascular disease. N Eng J Med 354(15): 1567-1577.
- Results of 6-Month Follow-Up of Patients After B-Turp and Thulep
- The Effect of Drinking Water with a High Content of Antimony and Arsenic on the Dynamics of their Distribution in the Kidneys and the Renal Excretory Function in Rats
- Effectiveness and Safety of Tansurethral Thulium Laser Enucleation of the Prostate in the Treatment of BPH: Review
- A Systematic Review on Molecular Pathophysiology Involved in Chronic Kidney Disease and the Role of Animal Models in Drug Discovery to Manage in Chronic Kidney Disease - An Update
- Functional Development of Kidneys in Human Ontogenesis
- Testicular Metastasis: Uncommon Prostate Cancer Case Report