Ex-Situ Conservation: A Source of Revenue Generation and Visitors’ Attraction (A Study from Central Zoo, Lalitpur, Nepal)
The Zoo is famous example of ex-situ conservation. Central Zoo is only one Zoo of Nepal having high potentiality of ecotourism but the study regarding this is very limited. Thus, this research was objectively done to assess the trend of visitor in Central Zoo from 2009 to 2019 and revenue generation, visitor’s perception about the features in the Zoo. Total 108 visitors were interviewed to collect primary data to know their perception about features and facility in the Zoo. Among this, it was about 56.48% male and 43.52% female visitor. The secondary data were collected from published and unpublished report and documents of Central Zoo. The collected data were analyzed using descriptive statistics. Rating analysis was also done to know perception of visitors about different features and their satisfaction about the available facility. The highest record of visitors was 1,154,436 in 2018/2019 which was more in comparison to 1,063,217 in fiscal year 2009/2008. The highest number of visitors were Nepali Adult that was 6, 73,323 followed by Nepali Children with 2,156,352 and Nepali students and other with 1,414,961 from 2009 to 2019. The maximum revenue generated from visitors was US$124, 09, 32 in 2018/2019 while this was the lowest about US$ 5, 66,502 in 2009/2010. Similarly, most satisfied facility was sanitation of the toilet with mean score 6.5. The visitors choose the information was easily accessible in the Zoo as most important item with 6.4 score. The estimated highest coefficient of variance of revenue generation from Zoo was same 2.17 (inconsistency) in 2017/2018 but it was lowest 1.45 (consistency) in 2009/2010 which showed the variation of monthly flow of visitors. This study helps to improve the important feature of the Zoo’s such as signpost around the entrance, animals view point, and animal shelter and provision of the guide for visitors and ease of car parking and possible implication for Zoo management are discussed.
Introduction
Globally, there are approximately 12,000 captive institutions that hold 6000 different species [1] but only a fraction of these institutions are recognized by World Association of Zoos and Aquariums (WAZA) for maintaining best practices according to international standards [2]. The international species information system reports that there are approximately 2.6 million animals held in captivity in 800 Zoos and aquaria [3]. Zoos are the successful example of Ex- situ conservation and successful attractions place for people. Every year over 700 million people visit WAZA-accredited Zoos [3]. Annually 12 million visitors are generally visited in most of the large Zoo (Mexico City).
In the USA, more people visit the Zoo than attending games and sports like professional basketball, football and baseball games. Zoos are also important contributors to metropolitan and regional economies. For example, about 1.45 million visitors visited Omaha’s Henry Doorly Zoo in
2017 and around $267.01 million revenue was generated from this [4].
Similarly, the report of British and Irish Association of Zoos and Aquariums showed around £645 million revenue generation every year as well as 11,000 people were employed in Zoo [5]. The traditional primary objective of the zoo was entertainment but these days research, education and conservation are increasing concern because of important social and cultural values [6]. The tourism is another important aspect of Zoo in the world.
Apart from the social, cultural, economic and enjoyment benefits of Zoos, the keeping of animals is controversial because most of the nature lovers, experts and scientists opined that it is violation of animal right [7]. Jungle is the place for animal to live [8, 9, 10, 11] argue that tourism based on the interaction with wildlife is increasing concern across the world. The value of conservation, animal welfare, visitor’s satisfaction and profitability are often in conflict in wildlife tourism [12].
There are 164 zoological parks in India, 18,038 zoological park in China and 14 zoological park in Pakistan, these all parks are excellent example of attraction of tourists and generation of income [13]. Ecotourism has gained momentum in Nepal due to its attractive landscape, geomorphology, lithology, climate, vegetation, wildlife and culture. Mountain climbing, trekking, visiting national park and protected area are good example of ecotourism but visiting Zoo is also alluring example of ecotourism. Millions of domestic and international tourists visit the Zoo. The Zoo is handsome source of income and revenue generation [14]. The analysis of feature in central Zoo in Nepal and the visitors’ satisfaction are important issue to improve the Zoo. However, research regarding revenue generation and visitors’ feedback was not explored so far properly. Thus, this research was objectively carried out to assess the trend of domestic and international visitors and revenue generation from 2009 to 2019 and their perception about the features and their importance in Central Zoo, Nepal.
Materials and Methodology
Study Area
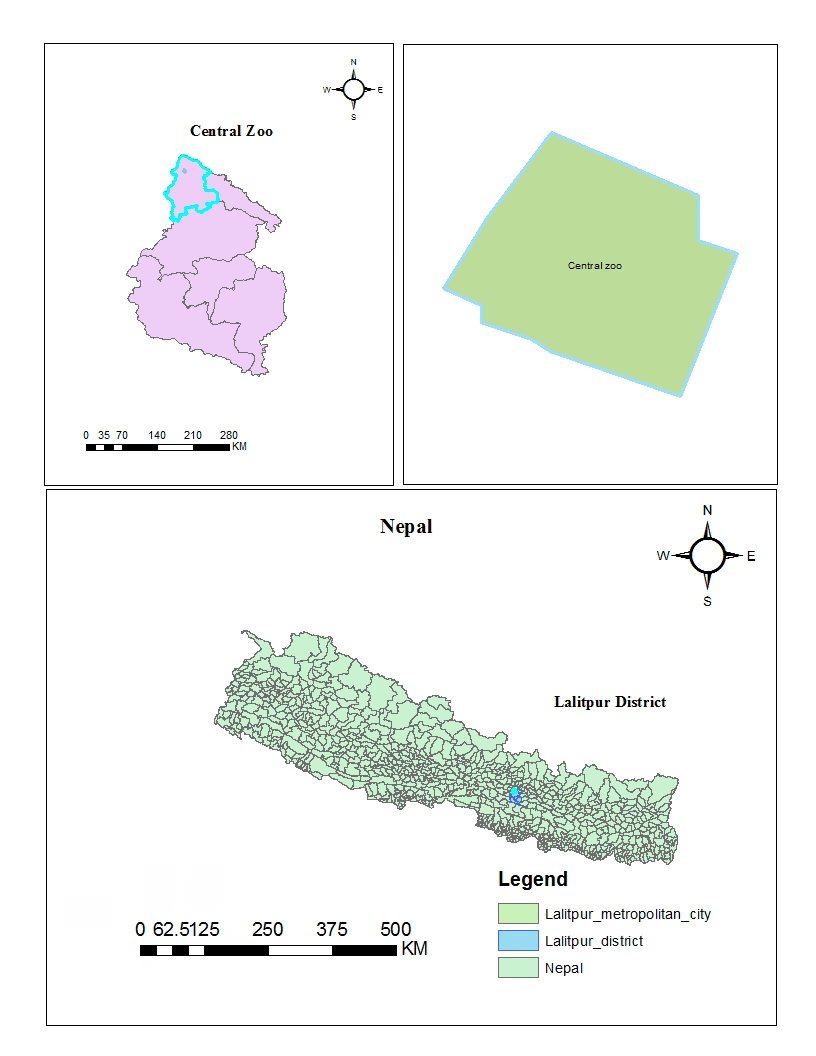
This study was carried out at Central Zoo Lalitpur district adjoining to Kathmandu, Capital of Nepal. The Zoo is located at 27.6727° N, 85.3118° E (Figure 1). The Zoo was established in 1932 by Rana Prime Minister Juddha Shumser as a private Zoo but it came under government administration in 1950. The government handed over responsibility of the zoo to National Trust for Nature Conservation in December 1995 and it was opened publicly in 1956. The area of Central Zoo is about 6 ha. There are 942 mammals, bird, fish and reptile of 127 species in this Zoo.
Data Collection
Primary data and secondary data were collected to meet the research objectives. The primary data were collected from visitors’ interview. Total 108 respondents randomly selected to interview in order to collect primary data. Out of this, 56.48% respondents were Male and 43.52 % were Females. With reference to the age category, 32.41% were between the age of 18 and 24, 26.85% were between the age of 25 and 44, 14.81% between the age of 45 and 64, 12.96% between 65 and 74 and 12.97% were above 75 years of old. The survey was conducted from February 2020 to April 2020. The questionnaire reflects the objectives of the research, and it is divided into three sections. These were (i) A list of zoo attributes and a rating of the performance of these attributes by visitors; (ii) An evaluation of the zoo visited and (iii) A section requesting open-ended responses and observations. Moreover the secondary data were collected from available published and unpublished reports and records. The secondary data includes the visitors’ number.
Result and Discussion
Trend of Visitor’s in Central Zoo
The table 1 illustrates the number of visitors visiting central zoo from fiscal year 2009/10 and 2018 and 2019.
The total 1,780,628 visitors were visited central zoo from 2009/10 to 2018/2019. Out of which, Nepali adult visitors were 6,732,323 which were followed by Nepali children 2,156,352 and students and others with 1,414,961 (Table 1).
Domestic as well as foreign enjoy to visit the zoo to see the wildlife in ex-situ conservation [15]. Zoo at Dhaka city is very attractive for tourist; thousands of visitors visit the zoo every year [16].
| Fiscal Year | Nepali Adult | Nepali Children | Foreign Adult | Foreign Children | SAARC Adult | SAARC Children | Nepal Student | Senior Citizenship |
|---|---|---|---|---|---|---|---|---|
| 2009/10 | 6,28,211 | 2,35,525 | 4,866 | 621 | 0 | 0 | 1,93,994 | |
| 2010/11 | 6,84,400 | 2,38,794 | 5,483 | 655 | 0 | 0 | 1,83,080 | |
| 2011/12 | 6,60,733 | 2,15,228 | 5,317 | 629 | 0 | 0 | 1,68,919 | |
| 2012/13 | 6,45,913 | 2,30,806 | 5,266 | 629 | 0 | 0 | 1,70,462 | |
| 2013/14 | 6,30,697 | 2,22,553 | 5,139 | 646 | 0 | 0 | 1,62,579 | |
| 2014/15 | 5,86,532 | 1,76,670 | 4,489 | 565 | 0 | 0 | 1,40,729 | |
| 2015/16 | 6,89,152 | 1,86,146 | 3,641 | 485 | 0 | 0 | 1,23,372 | |
| 2016/17 | 7,22,478 | 1,48,929 | 2,70,786 | 10,000 | 3678 | 406 | 2,343 | 4,94 |
| 2017/18 | 7,38,501 | 2,47,083 | 3,617 | 469 | 3879 | 774 | 1,37,519 | 10,985 |
| 2018/19 | 7,45,706 | 2,54,618 | 3,206 | 537 | 4224 | 781 | 1,29,964 | 15,400 |
| Total Numbers | 67,32,323 | 21,56,352 | 3,11,810 | 15,236 | 11,781 | 1,961 | 14,12,961 | 26,879 |
Table 1: Total numbers of visitor’s in central zoo from 2009 to 2019.
Note: Nepali fiscal year starts from July and the record of visitors maintained accordingly. Table 1: Total numbers of visitor’s in central zoo from 2009 to 2019.
Descriptive Analysis of Visitors in Zoo
The highest number of average visitors was recorded 158,916 in 2010/11. The lowest mean monthly visitor was 129,855 in 2014/15. The lower the value of coefficient of variance the higher is consistency, the coefficient of variance in the year from 2009/2010 to 2013/2014 ranged from 1.421 to 1.497. This showed the consistency in visitors in Zoo which was less significant from to with range value 1.629 to 1.682 from 2015/2016 to 2018/2019 (Table 2).
| Mean | Standard Deviation | Coefficient of Variance | |
|---|---|---|---|
| 2009/2010 | 1,51,888 | 215899.7 | 1.421 |
| 2010/2011 | 1,58,916 | 233664.8 | 1.47 |
| 2011/2012 | 1,50,118 | 224787.4 | 1.497 |
| 2012/2013 | 1,50,439 | 220757.2 | 1.467 |
| 2013/2014 | 1,45,945 | 215362.8 | 1.476 |
| 2014/2015 | 1,29,855 | 198933.2 | 1.532 |
| 2015/2016 | 1,43,257 | 233347.6 | 1.629 |
| 2016/2017 | 1,44,889 | 237080.1 | 1.636 |
| 2017/2018 | 1,42,853 | 240374.2 | 1.683 |
| 2018/2019 | 1,44,305 | 242763.8 | 1.682 |
Table 2: Mean, Standard Deviation and co-efficient of variance of visitor’s number.
Importance of the Zoo’s Features: Mean Score, Standard Deviations and Standard Error
The Table 3 showed the mean, standard deviation and standard error of importance of rating the location of features of Zoo. The most important item to the respondent was that the information was easily accessible in the Zoo with the mean score of 6.44. The lowest rating value of features in zoo was friendly greeting by cashier with 5.06. The rate of entry fee and other fee in the zoo also affect the visitors [17, 18]. Similar result was found in zoo in Nepal as well.
| Features in zoo | Mean Rating | SD | SE | |
|---|---|---|---|---|
| 1 | Entry fee of zoo | 5.47 | 13.46 | 3.01 |
| 2 | A friendly greeting by cashier | 5.06 | 10.01 | 2.24 |
| 3 | Ease of parking | 5.84 | 15.15 | 3.39 |
| 4 | Signposting when entering the zoo | 5.98 | 17.15 | 3.83 |
| 5 | Zoo is the place for bringing the family | 5.97 | 16.33 | 3.65 |
| 6 | Zoo is the place for bringing the friends | 5.98 | 16.25 | 3.63 |
| 7 | That the information is easily accessible | 6.44 | 24.26 | 5.42 |
| 8 | That the animals enclosure are of good size | 6.03 | 20.08 | 4.49 |
| 9 | That the footpath are clearly marked | 6.04 | 19.52 | 4.36 |
| 10 | That the footpath are wide for easily passing people | 6.1 | 22.22 | 4.97 |
| 11 | That the toilets are clean | 5.95 | 18.01 | 4.03 |
| 12 | That the zoo provide toilets at the different places | 5.96 | 18.23 | 4.08 |
| 13 | That the different places to get the drinking water | 6.21 | 19.3 | 4.32 |
| 14 | That there are attractive view points | 6.33 | 20.44 | 4.57 |
| 15 | That animals are doing the natural things | 5.93 | 19.65 | 4.39 |
| 16 | It allow the people to see wild animals without destroying the natural habitat | 5.46 | 18.41 | 4.12 |
| 17 | That the animals have private place away from visitors | 6.01 | 18.34 | 4.1 |
| 18 | We must support the zoo so as they can develop the breeding programs | 6.17 | 18.97 | 4.24 |
| 19 | Zoos are the importance place for conserving the wildlife | 6.18 | 19.78 | 4.42 |
| 20 | That the animals are interesting subject of conservation | 5.74 | 18.09 | 4.04 |
Table 3: Descriptive analysis of importance rating of the zoo’s features.
Note: 1= Not very important, 2= not moderately important, 3 = not important, 4 = neutral, 5= important, 6= moderately important, 7= very important Table 3: Descriptive analysis of importance rating of the zoo’s features.
People’s Perception about Location of Zoo Features
The respondent scored the highest value of location of sanitation of toilet with 6.5. The lowest rank was given to provision of guide for the description about the species of the Zoo with 2.28 (Table 4). The people perception about the location of different entities in the zoo is important to improve the environment of the zoo [19, 20, 21].
| Attributes | Mean | Standard Deviation | Standard Error | |
|---|---|---|---|---|
| 1 | Actual (location) entrance of the central zoo | 4.25 | 12.66 | 2.83 |
| 2 | Entry fee of central zoo | 3.78 | 9.39 | 2.1 |
| 3 | Discount for the Student/Family/groups and disabled | 5.65 | 17.16 | 3.84 |
| 4 | Ease of parking | 2.64 | 12.28 | 2.75 |
| 5 | Response of staff towards visitors | 6.01 | 18.15 | 4.06 |
| 6 | Signpost that are provided in central zoo | 4.58 | 15.45 | 3.45 |
| 7 | Condition of footpath of the central zoo | 5.06 | 17.54 | 3.92 |
| 8 | Sanitation of toilet | 6.5 | 23.37 | 5.23 |
| 9 | Provision of drinking water for the visitors | 5.31 | 20.69 | 4.63 |
| 10 | Footpath are wide for the all categories of visitors | 5.71 | 22.85 | 5.11 |
| 11 | Information system provided within the Zoo | 4.86 | 15.11 | 3.38 |
| 12 | Provision of guide for the description about the species of the Zoo | 2.28 | 15.37 | 3.44 |
| 13 | Waste management system within Zoo | 5.41 | 19.19 | 4.29 |
| 14 | Open Spaces provided | 4.9 | 19.86 | 4.44 |
| 15 | Activities of wild animals | 4.67 | 14.77 | 3.3 |
| 16 | Condition of enclosure of wild animal | 3.8 | 11.87 | 2.65 |
| 17 | Private place for animal away from visitors | 3.06 | 13.44 | 3.01 |
| 18 | Effective animal view point | 4.9 | 16.79 | 3.75 |
| 19 | Number of Species placed | 5.62 | 17.74 | 3.97 |
| 20 | Importance of Central Zoo for animal conservation | 4.29 | 12.83 | 2.87 |
Table 4: Evaluation of zoo feature Scale: Mean, standard deviations and standard error. Note: 1= extremely dissatisfied, 2= moder
Descriptive Analysis for Revenue Generation from Zoo
The average income of the central zoo was increasing from fiscal year 2009/’10 to 2018/2019. The average income was US$ 113,300 in fiscal year 2009/10 it was reached to US $155,117 in fiscal year. The estimated highest coefficient of variance of revenue generation from Zoo was same value 2.17 (inconsistency) in 2017/2018 and 2018/2019 but it was lowest in 2009/2010 with 1.45 (consistency). The visitors’ number is varying annually because of several reasons like season, occasion and ceremony [22, 23, 24] (Table 5).
| Mean US $ | Standard deviation | Coefficient of Variance | |
|---|---|---|---|
| 2009/2010 | 1,13,300 | 164643.9 | 1.45 |
| 2010/2011 | 1,12,265 | 167732 | 1.49 |
| 2011/2012 | 1,00,747 | 153076 | 1.52 |
| 2012/2013 | 1,35,121 | 202116.8 | 1.5 |
| 2013/2014 | 1,73,276 | 264725 | 1.53 |
| 2014/2015 | 1,53,067 | 237766.5 | 1.55 |
| 2015/2016 | 1,65,790 | 274385 | 1.66 |
| 2016/2017 | 1,70,664 | 363132.5 | 2.13 |
| 2017/2018 | 1,56,990 | 340011.4 | 2.17 |
| 2018/2019 | 1,55,117 | 336886.8 | 2.17 |
Table 5: Descriptive analysis of revenue generation according to fiscal year.
Contribution of Different Groups in Revenue Generation
The contribution ratio of types of visitors to the revenue generation from visiting the central zoo of Nepal is shown in Figure 2. Out of total amount of the revenue collected, Nepali Adult were seeming to have higher contribution in all fiscal year. There was 70% to 80 % of the contribution in the economy generation of central zoo by the Nepali Adult visitors. This shows that there was more attraction of the adult age group to visit central zoo rather than other age groups. The age groups also affect the visitor’s number in the zoo and so as the revenue [25, 26, 27, 28, 29].
![Figure 2: Out of total amount of the revenue collected, Nepali Adult were seeming to have higher contribution in all fiscal year. There was 70% to 80 % of the contribution in the economy generation of central zoo by the Nepali Adult visitors. This shows that there was more attraction of the adult age group to visit central zoo rather than other age groups. The age groups also affect the visitor’s number in the zoo and so as the revenue [25-29].](/fulltextimages/9188/fig_2.png)
Conclusion and Recommendation
The trend of revenue collection of the Central Zoo was increasing with the growing visitor’s interest to visit the Zoo. The highest number of visitors was from the Nepali adult. Visitors choose information System and importance of attractive viewpoints are the more important aspects in Central Zoo. However, they gave less value to some other items such as a friendly greeting by cashier, allowing the people to see animals without destroying the natural habitat and entry fee of zoo because. Visitors showed satisfaction in the most of the features although, some items like private place for the animals away from visitor’s, ease of car parking, provision of the guides for the visitors were ranked as the highly-dissatisfied items and hence seems work to improve such items.
Acknowledgement
We wish to acknowledge Dr. Chiranjibi Pokhrel and Mrs. Lina Chilese for their kind support to provide data from zoo official, Mr. Sujan Kumar Karmacharya, Tejindra Regmi, Kiran Rayamajhi and Subash Bhandari for helping to collect data in the central zoo.
References
-
Princee F (2001) Research in zoological Gardens. Lutra 44(2): 75-80.
-
Mullan B, Marvin G (1999) Zoo Culture. Nature Press, University of Illinois, London.
-
Waza WA (2012) Zoo and aquarium of worlds.
-
Michelle M (2017) Omaha’s Henry Doorly Zoo and Aquarium Sets Economic Impact Record for City and State in 2016.
-
UK (2011) Economic and fiscal impact of omaha’s Henry Doorly Zoo on omaha and Nebraska. University of Nebraska Bureau of Business Research.
-
Danvey G (2007) Public perception in urban china towards Zoos and Their animal welfare. Human dimensions of wildlife 12(5): 367-374.
-
Turley SK (1999) Exploring the Future of tradational UK Zoos. Journal of Vacation Marketing 5(4): 340-355.
-
Enright K, Fabian A, Clemens P, Schrepfer S, Lears TJ, et al. (2009) Maximum of Wilderness : Naturalists & the Image of the Jungle in American Culture (Doctoral dissertation), Rutgers University.
-
Rookmaaker K (2010) From the Jungle to Kathmandu: Horn and Tusk Trade by Esmond Bradley Martin. Pachyderm 47: 124.
-
Pastor AV, Tzoraki O, Bruno D, Kaletová T, Mendoza-Lera C, et al. (2022) Rethinking ecosystem service indicators for their application to intermittent rivers. Ecological Indicators 137: 108693.
-
Reynolds PC, Braithwaite D (2001) Towards conceptual framework for wildlife tourism. Tourism Management 22(1): 31-42.
-
Wilson A, Phillips CJ (2021)Identification and Evaluation of African Lion (Panthera leo) Cub Welfare in Wildlife- Interaction Tourism. Animals 11(9): 2748.
-
MacKinnon, Xie Yan (2008) Regional Action Plan for the Protected Areas of East Asia. Bangkok, Thailand, pp: 82.
-
Mir RA, Shrivastava S (2022) An eco‐friendly management of organic waste by using exotic earthworms: A case study of revenue generation in Gandhi Zoological Park. Environmental Quality Management 31(3): 413- 422.
-
Oduro C, Anti-Boasiako C, Yao AFC (2001) Visitors Assessment of the Accra Zoo from 1989 to 1997. Ghana Journal Forestry 27-33.
-
Rahman MJ, Shinwary SS, Uddin MM (2009) Zoo as ecotourism attraction: Case of Dhaka zoo. ASA University Review 3(2).
-
Ryan C, Saward J (2004) The zoo as ecotourism attraction–visitor reactions, perceptions and management implications: the case of Hamilton Zoo, New Zealand. Journal of sustainable Tourism 12(3): 245- 266.
-
Whitworth AW (2012) An investigation into the determining factors of zoo visitor attendances in UK zoos. PLoS One 7(1): e29839.
-
Carr N, Cohen S (2011) The public face of zoos: Images of entertainment, education and conservation. Anthrozoös 24(2): 175-189.
-
Frost W (2011) Zoos and tourism: Conservation, education, entertainment? Channel View Publications 46(1): 20-34.
-
Clayton S, Prevot AC, Germain L, Saint‐Jalme M (2017) Public support for biodiversity after a zoo visit: Environmental concern, conservation knowledge, and self‐efficacy. Curator The Museum Journal 60(1): 87- 100.
-
Clubb R, Mason G (2002) A review of the welfare of zoo elephants in Europ. RSPCA, Horsham, UK, pp: 303.
-
Gibson HJ, Willming C, Holdnak A (2003) Small- scale event sport tourism: Fans as tourists. Tourism management 24(2): 181-190.
-
Cohen E (2010) Panda and elephant–contesting animal icons in Thai tourism. Journal of Tourism and Cultural Change 8(3): 154-171.
-
Lee HS (2015) Measurement of visitors satisfaction with public zoos in Korea using importance-performance analysis. Tourism management 47: 251-260.
-
Alarape AA, Yager GO, Salmam KK (2015) Assessment of tourists satisfaction and perception in Makurdi zoological garden, Benue state, Nigeria. Journal of Research in Forestry Wildlife and Environment 7(1): 1-12.
-
Clifford-Clarke MM, Whitehouse-Tedd K, Ellis CF (2021) Conservation education impacts of animal ambassadors in zoos. Journal of Zoological and Botanical Gardens 3(1): 1-18.
-
Miller (2004) Evaluating the conservation mission of zoo, aquariums, Botanical Garden and Natural History Museums. Conservation Biology 18: 86-93.
-
Muraoka D (2008) The mission of Accrediated U.S Zoos and Aquarium. In Review of Business Research, US, pp: 146-150.
- Electronic Waste Management in the Top Ten Economies in the World: A Critical Review on Waste Generation, Regulations, Collection, Recycling and Environmental Challenges
- Some Challenging Transdisciplinary Aspects of the Sustainable Waste Management in the Permacrisis Context
- Use of Mobile Autonomous Systems for Pollution Control of Inland Water Bodies
- Environmental Impact Perspective Sustainable Online Textile Retailing: Harnessing Augmented Reality-Based Digital Twins in Bangladesh
- Composite Treatment Module for Removing Acidity and Metal (Loid)S from Acid Rock Drainage
- Household E-Waste Management Systems [E-Wms] in Malaysia