Medicare and Medicaid Unifying or Crushing? This is the Dilemma
<p>Introduction: The increase in medical spending by the United States is unmatched in other developed countries, as evidenced by OECD analyses. The Medicare spending grew 4.5% to 646.2 billion, 20% of total NHE. The Medicaid spending grew 9.7% to 545.1 billion in 2015 or 70% of the total National Health Expenditure (NHE), private health insurance 7.2% to 1,072.1 billion compared to 33% of the total NHE. These increases, while disturbing, cannot be interpreted in and of themselves because the spending increments depend upon inflation, the overall status of the economy, and the growth of population. To view matters from a long-term perspective, such that decisions might better be made, we posited that analyzing the proportions of health care expenditures over time would better inform policy makers. Methods: Table NHE2015, provided the data for this analysis. Using a linear equation and the grid search method, permitting the data itself to correct for autocorrelation. Evaluated and compared were 1966-2015 annual percent of total health care expenditures represented by 1) Out of Pocket and Insurance Expenditures, 2) Private Insurance and CMS (Medicare, Medicaid, CHIP), 3) Medicare and Medicaid Expenditures, 1966-2015 4) Hospital and Physician/Clinical Expenditures. Results: Whereas private health insurance stopped increasing in 1990, CMS entities (Medicare, Medicaid, CHIP) continued to rise throughout the period. Hospitals costs rose rise may have reflected the ability of hospitals to capitalize on their captive patient market. For physicians and care givers there was a steady decline in the proportion of health care spending. Adoption of nurse practitioners and physician’s assistants did not decrease the expenditure. Affordable Care Act included an increase beginning in 2013 in Private Insurance and a decrease beginning in 2013 in Hospital care. Conclusion: The ACA likely will not forestall the increase in government spending that is required. The similarity of the rise in Medicare and Medicaid spending argue for combining the two into a single program. The role of private health insurance in this respect would then be to provision non-catastrophic coverage for the working public. A solution to the funding problem associated with such a chance lies in making the Medicare tax rate, which would cover this, 4% on the first $200,000 and add 6% above $200,000. Medicaid and Medicare thus united will have better streamlined protocols and a stronger financial base.</p>
Eldo E Frezza1* and Mitchel Wacthel2
NM, USA, Email: eefrezza@msn.com
better inform policy makers.
and Medicaid Expenditures, 1966-2015 4) Hospital and Physician/Clinical Expenditures.
Insurance and a decrease beginning in 2013 in Hospital care.
and Medicare thus united will have better streamlined protocols and a stronger financial base.
expenditures; Medicare Prescription Drug, Improvement and Modernization Act
Introduction
The health care system is always at the center of attention for its expenditure. The increase in medical spending by the United States is unmatched in other developed countries, as evidenced by OECD analyses [1, 2]. Here are some examples of the expenditures. In 2013, Medicare spending grew 3.4% to about 585.7 billion in 2013 or 20% of the total net health expenses while Medicaid instead grew 6.1% to 449.4 billion in 2013 or 15% of the total net health expenses [3, 4, 5, 6]. Private health insurance spending grew 2.8% to 961.7 billion in 2013 or 33% of the total expenses [7]. Hospital spending grew 5.6% to 1,036.1 billion in 2015, faster than 4.6% grew in 2014. In 2015, the National Health Expenditure, (NHE) [8, 9] grew 5.8% to 3.2 trillion in 2015, about $9,990,000 per person and accounted for 17.8% of gross domestic product, Gross Domestic Product (GDP) [10, 11]. The Medicare spending grew 4.5% to 646.2 billion, 20% of total NHE. The Medicaid spending grew 9.7% to 545.1 billion in 2015 or 70% of the total NHE, private health insurance 7.2% to 1,072.1 billion compared to 33% of the total NHE, out of pocket spending grew 2.6% to 338.1 billion in 2015 compared to 11% of total NHE. Physician and clinical surveys expenditure grew 6.3% to 634.9 billion compared to 4.8% of 2014 [12, 13, 14]. Prescription drug spending increased 9% to 324.6 billion compared to 12.4% in 2014 [15, 8]. The Federal Government therefore supported the largest share of total health expenditure, 20.7% and household 27.7%. The private business share of spending accounted for 19.9% [10, 12, 16] These increases, while disturbing, cannot be interpreted in and of themselves because the spending increments depend upon inflation, the overall status of the economy, and the growth of population [16, 17, 18]. In this paper, we evaluated the expenses of Medicare and Medicaid between1966-2015 and calculate the annual percent of total health care expenditures represented by Insurance Expenditures, including CMS (Medicare, Medicaid, CHIP), and Hospital and Physician/Clinical Expenditures. The goal is to find out if the CMS is well founded and with the increase of the baby boomer pocketing Medicare funding if the system will be valuable and sustainable in the future. We going to evaluate the numbers and the information’s release by the CMS Centers for Medicare & Medicaid Services [19] to evaluate the expenditures and based on those see if they match between federal and private insurance and check for simulations and divergences. To view matters from a long-term perspective, such that decisions might better be made, we posited that analyzing the proportions of health care expenditures over time would better inform policy makers and help to understand where the programs are going and if there is a possibility to match the programs in one.
Methods
Source of information Centers for Medicare & Medicaid Services [19]. Table NHE2015, provided the data for this analysis. Join point regression (Join point Program 4.4.0.0 [20] produced estimates and standard errors of annual changes in percent’s (ACP) and join points (years at which ACP changed), using a linear equation and the grid search method, permitting the data itself to correct for autocorrelation. Evaluated and compared were 1966- 2015 annual percent of total health care expenditures represented by 1) Out of Pocket and Insurance Expenditures, 2) Private Insurance and CMS (Medicare, Medicaid, CHIP), 3) Medicare and Medicaid Expenditures, 1966-2015 4) Hospital and Physician/Clinical Expenditures.
Results
The (Figure 1) displays annual percentages of total medical expenses by category, estimated join points (black dots), and annual changes in percent (ACP, slopes of line segments). When the 95% CI of the ACP excluded 0, a ^ symbol is placed beside the value. The vertical line at 2010 demarcates the adoption of the Affordable Care Act.
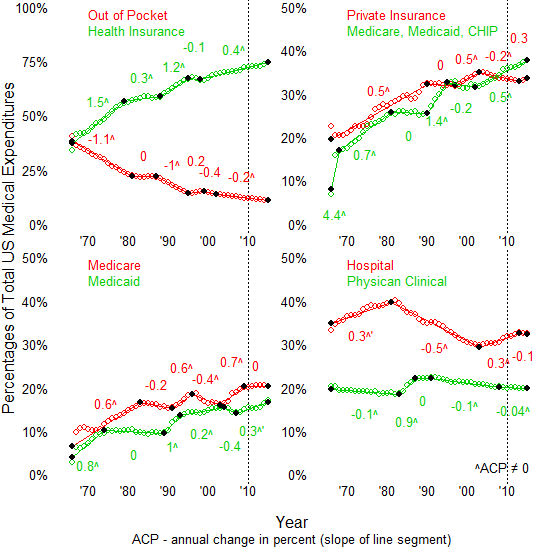
the proportion of health care spending devoted to physicians and clinical care. The final point should be emphasized, as the relatively recent adoption of nurse practitioners and physicians assistants cannot be said to have influenced the proportion of health care spending that goes to clinicians; if anything, the change halved the annual rate of decline after 2008. Changes that can reasonably be said to have resulted from the adoption of the Affordable Care Act included an increase beginning in 2013 in Private Insurance, likely due to increased affordability of insurance, and a decrease beginning in 2013 in Hospital care, possibly due to decreased visits to emergency rooms occasioned by an increase in the proportion of the population that was insured.
Discussion
Although diverse and many are studies of health care costs over time, this is likely the first to use join point regression to analyze proportions of health care spending over time. Join point regression analyses of proportions are valuable because they eliminate the need to adjust dollar figures for inflation, consider autocorrelation as part of the assessment, and permit generalized conclusions by virtue of percentages that cannot be made with as great facility as with annual spending figures [21, 22]. Perhaps most significant is the steady increase in the proportion of spending accounted for by CMS programs, which, if trends continue, will soon surpass 50% of all health care spending [23, 24, 25]. At such a time, the debate over single payer health care will be moot as, for the most part, the US will then be a single payer state no matter how private insurance is provisioned. The long term effects of the Affordable Care Act cannot be adjudged with certainty given the limited number of years in which it has been effective; the initial results, however, look promising. Recessions have been noted [5, 6, 26, 27, 28] in 1969-1970, 1973-1975, 1980-1982, 1990-1992, 2001, and 2007- 2009; the figure shows that no consistent effect can be discerned from recessions upon the different components of medical spending. Precisely because the changes in tax revenue are not reflected in changes in components of medical expenditures, it is important that States consider, when preparing budgets, the revenue shortfalls that will of necessity occur as respects Medicaid and CHIP [29, 30]. From the perspective of the hospital and clinicians, the decreasing general role, provided the ACA does not retain its present effect, of insurance must be considered; Medicare and Medicaid rose in generally similar terms, while private insurance dropped, meaning that both hospitals and clinicians will increasingly see the government as the payer [31]. A difference between Medicaid and Medicare is that the former has catastrophic coverage, while the latter does not, meaning that the ability of hospitals and clinicians to recoup expenses associated with high cost patients will be more favorable as respects Medicaid; currently there exists a 62% rate increase for the hospital safety net associated with Medicaid [32]. A point of interest is the Safety Net Care Pool Program, which is part of the ACA; the benefits of this program are geared towards rural, not urban hospitals [33, 34]. The nurse practitioners and physicians assistants cannot be said to have influenced the proportion of health care spending that goes to clinicians actually the expenditures for nurse practitioner is similar to the physician for insurance porpoise. The effects of crash funding, called disproportionate share hospital payments (DSH), remain a source of interest. DSH assists hospitals with a high level of Medicaid and low income insurance patients, often being a vital factor as respects financial stability of such hospitals [35, 36, 37]. Because the number of patients applying for Medicaid has increased under ACA [18, 38, 39, 40, 41, 42], the resources of hospitals even with DHS have been strained, likely requiring additional federal assistance in this respect. This difficulty, as shown by this study, will partly be mitigated, if ACA retains its current role, by the increased role of private insurance in the medical economy. More data came out while we were writing the paper up to 2017, but we stop at 2015 because we though that we already showed: 1) the expenditures increase over the last 20 years, no need to check 2 years more and that 2) Medicare and Medicaid will eventually produce the same expenditures and they are going towards a collision which can make the health care crush once and forever if we do not do anything substantial.
Conclusion
The ACA, although promising in respect to changing the declining role of private insurance in the medical economy, likely will not forestall the increase in government spending that is required. For this reason, a frank conversation as respects the role of government in health care is warranted. The similarity of the rise in Medicare and Medicaid spending argue for combining the two into a single program, with the addition of catastrophic insurance for all not currently covered by these two programs. The role of private health insurance in this respect would then be to provision non- catastrophic coverage for the working public. A solution to the funding problem associated with such a chance lies in making the Medicare tax rate, which would cover this, 4% on the first $200,000 and add 6% above $200,000. Medicaid and Medicare thus united, will have better streamlined protocols and a stronger financial base.
References
-
OECD 2017 health care analysis.
-
US Health care from a global prospective.
-
The analysis assumes that payments rates increase at 1% per year from 2013-2035 and does not reflect the 0% update in the American Taxpayers Relief Act of 2012.
-
Medicare Spending Per Beneficiary from 1970-2010 from OACT data on incurred costs; GDP per capita for 1970-2010 from BEA historical data.
-
Congressional Budget Office (2010) “Letter to the Honorable Nancy Pelosi”.
-
Center for Medicare and Medicaid Center. National Health Expenditure Data.
-
Congressional Budget Office (2015) Medicare Baseline.
-
2015 Annual Report of the Boards of Trustees of the Federal Hospital Insurance and Federal Supplementary Medical Insurance Trust Funds.
-
Congressional Budget Office the 2015 Long-Term Budget Outlook.
-
Center for Medicare and Medicaid Center NHE fact sheet.
-
The Facts on Medicare Spending and Financing.
-
Medicare spending by claims.
-
Centers for Medicare & Medicaid Services, Office of the Actuary, National Health Statistics Group, National Health Expenditures Tables (December 2014).
-
Gretchen Jacobson, Anthony Damico, Tricia Neuman, Marsha Gold (2015) "Medicare Advantage 2015 Spotlight: Enrollment Market Update." Kaiser Family Foundation.
-
Centers for Medicare & Medicaid Services, Office of the Actuary, National Health Statistics Group, National Health Expenditures Tables (December 2014).
-
What is the spending of Medicaire?
-
Effect of Health care spending on the US economy.
-
Congressional Budget Office, March 2015 Medicare Baseline, March 9, 2015.
-
Robert Farley (2014) ACA Impact on Per Capita Cost of Health Care.
-
Source of information. Centers for Medicare & Medicaid Services.
-
Joint Point Regression Analysis.
-
Growth in Medicare spending by beneficiary.
-
Medicare future budgets.
-
Keehan SP, Cuckler GA, Sisko AM, Madison AJ, Smith SD, et al. (2015) National health expenditure projections, 2014–24: Spending growth faster than recent trends. Health Aff (Millwood) 34(8): 1407- 1417.
-
Trend in Medicaid Spending.
-
Bachrach D, Boozang AP, Herring, Reyneri DG (2016) States expanding Medicaid see significant budget savings and revenue gains. Princeton, NJ: State Health Reform Assistance Network, Robert Wood Johnson Foundation.
-
Medicare budget and performance.
-
Mark VP (2003) Should We Be Worried About High Real Medical Spending Growth in The United States? Health Aff (Millwood).
-
Health Spending Projections Through 2013. Health Affairs Web Exclusive. Stephen Heffler, Sheila Smith, Sean Keehan, M. Kent Clemens, Mark Zezza, and Christopher Truffer, 11 February 2004.
-
Lorenzoni L, Belloni A, Sassi F (2014) Health-care expenditure and health policy in the USA versus other high-spending OECD countries. The Lancet 384(9937): 83-92.
-
Holahan J, McMorrow S (2012) Medicaire and Medicaid Spending trends and the deficit debates. N Eng J Med 367(5): 393-395.
-
de Rugy V Facts on Medicare spending and Finances.
-
Foertsch T, Antos J (2005) The Economic and Fiscal Effects of Financing Medicare's Unfunded Liabilities.
-
Safety Net pool care program. http://federalsafetynet.com/safety-net- programs.html
-
Health care safety net resources.
-
Medicaid Disproportionate Share Hospital (DSH) Payments.
-
Federal Medicaid Disproportionate Share Hospital (DSH) Payments.
-
Disproportionate Share Hospital (DSH). The Medicare DSH Adjustment (42 CFR 412.106).
-
Who is paying for Medicaid.
-
How Medicare if funded?
-
How Medicaid works?
-
What is Medicare and Medicaid?
- Measuring What Matters: Data Gaps, Certificate of Need Reform, and Pediatric Psychiatric Inpatient Capacity in North Carolina
- Intersecting Epidemics and Climate Vulnerabilities in Conflict- Driven Displacement: Epidemiology, Systemic Challenges, and One Health Gaps in South Sudan
- Advancing Domestic Health Financing for Community Health System Sustainability in South Sudan: The Boma Health Initiative Model (2025–2035)
- Prevalence and Correlates of Post-Exposure Prophylaxis Uptake among Men Who Have Sex with Men in Kisumu County, Kenya
- Medical, Ethical, and Legal Conflicts Surrounding Euthanasia in Argentina. Its Global Implications
- Knowledge and Attitude on Menstrual Hygiene among Adolescent Girls Studying in Secondary Level in Public Schools of Chitwan District, Nepal