Hospitalization-Related Indicators of Second Wave COVID-19 Pandemic in Eight European Countries
Background: Time dependent reproduction number is the most relevant parameters to track the spread of COVID-19 pandemic. However, especially at the initial stages, Rt can be highly underestimated because of remarkable differences between the actual number of infected people and the daily incidence of people who are tested positive. In our work, we analyzed the daily cumulative number of hospitalized (HP) and intensive care unit (ICU) patients both in space and in time in the early phases of second wave COVID-19 pandemic across eight different European countries. Methods: We derived simple model equations to fit the time dependence of these two variables where exponential behavior is observed. Growth rate constants of HP and ICU are listed, providing country-specific parameters able to estimate the burden of SARS-COV-2 infection before extensive containment measures take place. Results: A trend between the HP and ICU constants is confirmed for almost all the countries considered. This paves the way to delineate a more general correlation where for a given amount of HP a given amount of ICU can be then associated. Conclusions: Our quantitative parameters, fully related to hospitalizations, are disentangled from the capacity range of the screening campaign, for example the number of swabs, and they cannot be directly biased by the actual number of infected people. This approach can provide reliable indicators which can be used to monitor the dynamics of COVID-19 in the peaks of epidemic.
Introduction
Even if with some differences between the regions/ countries, since the first days of September 2020, SARS-COV2 quickly spread through almost all the Europe, as confirmed by the cumulative incidence of official reported COVID-19 confirmed cases, reaching the huge number of more than 13 million of infected people on November 9th [1, 2]. In the control of epidemics, the time dependent reproduction number _R_t (i.e. the average number of secondary cases generated by an infectious person at time t) is considered one the most relevant parameter to track the trends of the infection [2, 3]. However, when the morbility or morbidity rate, MB is huge, as in COVID-19 pandemic, Rt could be largely underestimated, for the simple reason that the diagnostic possibilities of the healthcare national systems are overwhelmed and there are significantly high differences between the actual number of infected people and the daily incidence of people who are tested as positive. In this challenging context, the determination of Rt is susceptible to faults not easily to be disentangled [3, 4, 5, 6]. On the other hand, mortality rate, which is considered the most reliable indicator of the epidemic trend, suffer from a significant time delay (in the COVID-19 epidemic about 15 days) compared to the trend of the infection diffusion, temporally too far from the real situation to be used in the challenging epidemic context, making it virtually unusable in the real-time decision making process [7].
E from the start of COVID-19 pandemic, two variables represented the major problems which the national health care systems must face with: the number of hospitalized patients (HP) and the number of Intensity Care Units (ICU) patients. In each European country, HP and ICU are affected by the objective limitations imposed by the available resources, an insurmountable limit for an adequate care of all the patients affected. Hence, because of the pitfall of Rt and mortality rate due to their intrinsic nature HP and ICU could be considered as a good compromise between reliability and solidity making them potentially useful in the decision making related to the COVID-19 pandemic. Mathematical modeling of a respiratory infectious disease spreading is a well-established field in epidemiology and, recently, many works focused to model SARS-COV2 transmission dynamics [3, 8, 9]. Statistical parameters derived by the ongoing epidemiological data may provide a starting point to perform more reliable predictive calculations.
In this work, we discussed on the relationship between the number of HP and ICU by deriving a simple model equation able to fit the observed time evolution of cumulative incidence for eight European countries, i.e. Austria, Czech Republic, Italy, France, Belgium, Portugal, Spain, United Kingdom (UK), during second wave COVID-19 pandemic, in the autumn of 2020 in order to find consistent parameters to rigorously monitor the dynamics of COVID-19 epidemic.
Methods
Demographic and Epidemiological Data
The official demographic data of the resident population updated on January 1st, 2020 for each European country considered were derived from the European statistical system (Eurostat). We collected data of COVID-19 epidemic for Austria, Belgium, Czech Republic, France, Italy, Portugal, Spain and United Kingdom from Governative or governative- endorsed websites where data are updated at national levels and published in form of dashboard, periodical reported. All the data are accessible and have been publicly published (see also Table S1, supporting information, for all the details on demographic and epidemiological data sources). The data of COVID-19 pandemic were collected from August 1st to October 31st, 2020, except for Spain (from August 20th to October 31st, 2020).
| Resident population, Jan 1st, 2020 * | Source of COVID-19 epidemic data | ||
|---|---|---|---|
| Organization | Website | ||
| Austria | 89,01,064 | Austrian Agency for Health and Food Safety (AGES) | ages.at |
| Belgium | 1,15,49,888 | Belgian Institute for Health (SCIENSANO) | sciensano.be |
| Czech Republic | 1,06,93,939 | Czech Ministry of Public Health | mzcr.cz |
| France | 6,70,98,824 | French Government | gouvernement.fr |
| Italy | 6,02,44,639 | Italian Ministry of Public Health | salute.gov.it |
| Portugal | 1,02,95,909 | Portuguese National Health System | sns.gov.pt |
| Spain | 4,73,29,981 | Spanish Ministry of Health and Social Welfare | mscbs.gob.es |
| United Kingdom | 6,70,25,542 | British Government | gov.uk |
Table S1: Population and sources of data for countries considered. * Data taken from EUROSTAT (website ec.europa.eu/Eurostat)
Derivation of The Time Evolution Equation Of Daily Cumulative Incidence of The Number of Hospitalized and Intensive Care Unit Patients Related To COVID-19
We assume that HP at time t is N’HP and, over a short time interval of duration t ∆ from t to ( ) t t + ∆ , HP evolves to ' HP HP k tN ∆ for some constant HP k defined as growth rate constant of HP. We can then approximate the change of population size ' (t ) ' ( ) HP HP N N t + ∆− to ' ( ) HP HP k tN t ∆ according to the following equality:
' ( ) ' ( ) ' ( ) HP HP HP HP N t N t k tN t + ∆− ≈ ∆ (1.1)
Dividing both side by t
$$ \frac {N ^ {\prime} _ {H P} (t + \Delta) - N ^ {\prime} _ {H P} (t)}{\Delta t} \approx k _ {H P} N ^ {\prime} _ {H P} (t) $$ (1.2) The duration of
t
∆ must be short enough to ensure
that the population size does not change too much and by
considering the limit of
0 ∆→
under the assumption of
differentiable ' ( ) HP N
t function, it follows:
$$ \frac {d N ^ {\prime} _ {H P} (t)}{d t} = k _ {H P} N ^ {\prime} _ {H P} (t) \tag {1.3} $$ We can solve equation (1.3) using separation of variables and by imposing that , ' ( ) ( ) HP HP HP e N t N t N = − where ( ) HP N t is the ongoing cumulative HP at time t and , N_HP e_ is the cumulative HP of the “environment”. Since the COVID-19 second wave developed from a phase where NHP is not null, we accepted that the number of HP tends to an asymptotic “environmental” value exhibited before the ' ( ) HP N t started to grow exponentially.
( ( ) N )
d N t k dt N t
− ∫ = − , HP HP e HP HP HP e (1.4) Hence,
( ) N
, , ln | ( ) N | HP HP e HP N t k t C − = + (1.5)
Solving for we get the exponential growth equation:
, , ( ) N t HP k
HP HP e HP N t C e = + (1.6)
We applied the same assumptions to ICU, as:
ICU, ICU,e ( ) N K t HP ICU e N t C = + (1.7)
Since it is reasonable to consider that N_ICU(t) can be strictly related to NHP(t) such that a function like ( ) N [ ( ), ] _ICU ICU HP N t N t t = is more appropriate to describe its evolution.
However, our goal is to analyze ( ) ICU N t , ( ) HP N t separately to define an empirical relationship between them; hence we used equations (1.5), (1.6) to fit the time evolution of ICU N , HP N in order to obtain values of environmental HP and ICU and empirical constants( , N_HP e_ , ICU, N e HP C , ICU C , respectively) and exponential growth rate indices( HP k , ICU k ) directly against the observed data. Unit of measurement of HP k , ICU k are in reciprocal day (d-1) which allows to define generation time constants 1/ k HP HP G = , 1/ ICU ICU G k = as the time in days (d) which elapsed between initial population and the population at t of HP and ICU, respectively. Furthermore, we defined a rate of conversion between NHP and NICU patients as ICU rate of hospitalization patients ( ) ICU R to obtain a relationship between variables by adopting the simple equation:
ICU ICU HP R N N = ( ( (
(1.8) Where HP N (
, ICU N ( are expressed as cumulative incidence per 100000 inhabitants.
Results
Results are summarized in supporting information (Figures S1-S4), for all the countries considered. All the profiles were fitted by using equations (1.6), (1.7) and the results from non-linear squares regression are listed in Table 1, together with RICU obtained for all the countries and with R2 determination coefficient. HP and ICU data sets showed high goodness of fit, that is to say coefficient of determination R2, ranging from 0.956 to 0.997 and from 0.962 and 0.996 for HP and ICU, respectively. About the 37.5 % of investigated countries display a
0.06 HP k ≈ with an average HP k of 0.075 ±0.018, according to values distribution (Figure 1a).
| Hospitalization Indices | ICU Indices | R and Related Indices ICU | |||||||||
|---|---|---|---|---|---|---|---|---|---|---|---|
| N * HP,e | C HP | k HP | R2 | N * ICU,e | C ICU | k ICU | R2 | R ICU | SD | R2 | |
| Austria | 111.9 | 3.6 | 0.067 | 0.977 | 14.6 | 5.2 | 0.041 | 0.967 | 0.168 | 0.005 | 0.912 |
| Belgium | 226.9 | 3.2 | 0.084 | 0.993 | 66.1 | 0.3 | 0.09 | 0.996 | 0.161 | 0.002 | 0.986 |
| Czech Republic | 0 | 26.9 | 0.063 | 0.995 | 0 | 9.8 | 0.052 | 0.995 | 0.149 | 0.002 | 0.976 |
| France | 4806.7 | 11.1 | 0.082 | 0.996 | 230.5 | 76.1 | 0.041 | 0.992 | 0.178 | 0.006 | 0.819 |
| Italy | 1174.6 | 21.3 | 0.075 | 0.993 | 78.5 | 2.1 | 0.074 | 0.993 | 0.095 | 0.001 | 0.993 |
| Portugal | 320.5 | 10.7 | 0.056 | 0.993 | 32.6 | 2.9 | 0.049 | 0.99 | 0.153 | 0.003 | 0.964 |
| Spain | N.R. | 9 | 0.115 | 0.956 | N.R | 7 | 0.086 | 0.962 | 0.145 | 0.003 | 0.907 |
| United Kingdom | 560.8 | 64.2 | 0.058 | 0.989 | 0 | 37.2 | 0.039 | 0.989 | 0.109 | 0.003 | 0.944 |
Table 2: Results of Epidemic Parameters Considered for each Country. Legend: N.R = Not Reported for Spain because of the differen
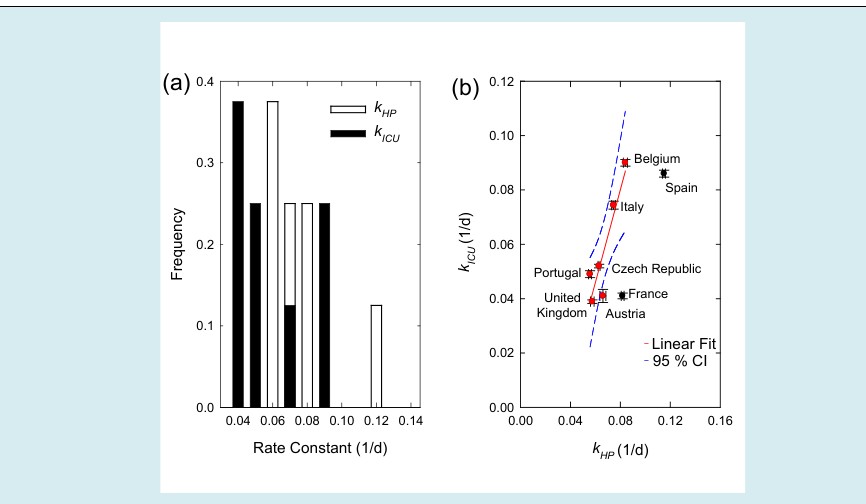
The same trends of HP were observed when ICU was considered, with similar values distribution (Figure 1a). Unexpectedly, average HP k and ICU k were correlating between each other as displayed in Figure 1(b), confirming a quasilinear trend between the HP and ICU constants for all the European countries, with the exception of France and Spain (Figure 1b). The correlation between HP N and ICU N obtained by replotting all the data according to equation (1.8) is shown in Figure 2a.
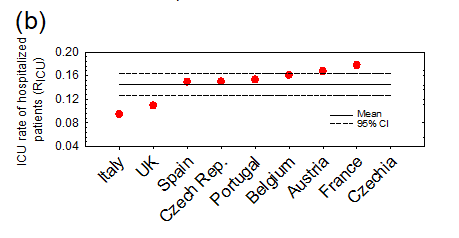
Figure 2: Correlation between Cumulative Incidence HP and Cumulative incidence ICU. Legend: (a) Correlation between cumulative incidence HP and Cumulative incidence ICU for each country analyzed. Data are normalized over Country Population. Solid lines are linear fitting model. (b) ICU rate of hospitalized patients ( ) ICU R compared and ranked for all the selected countries; red and black dots represent countries in which ICU R is included or not included in the CI=95% of the linear fit model, respectively.
For the most of the countries analyzed, RICU followed the relation (1.8), excluding Czech Republic and France (see Figure 2b). With five countries displaying an ICU R (%) close to the mean value 14.6% (95% CI: 12.7%, 16.4%)
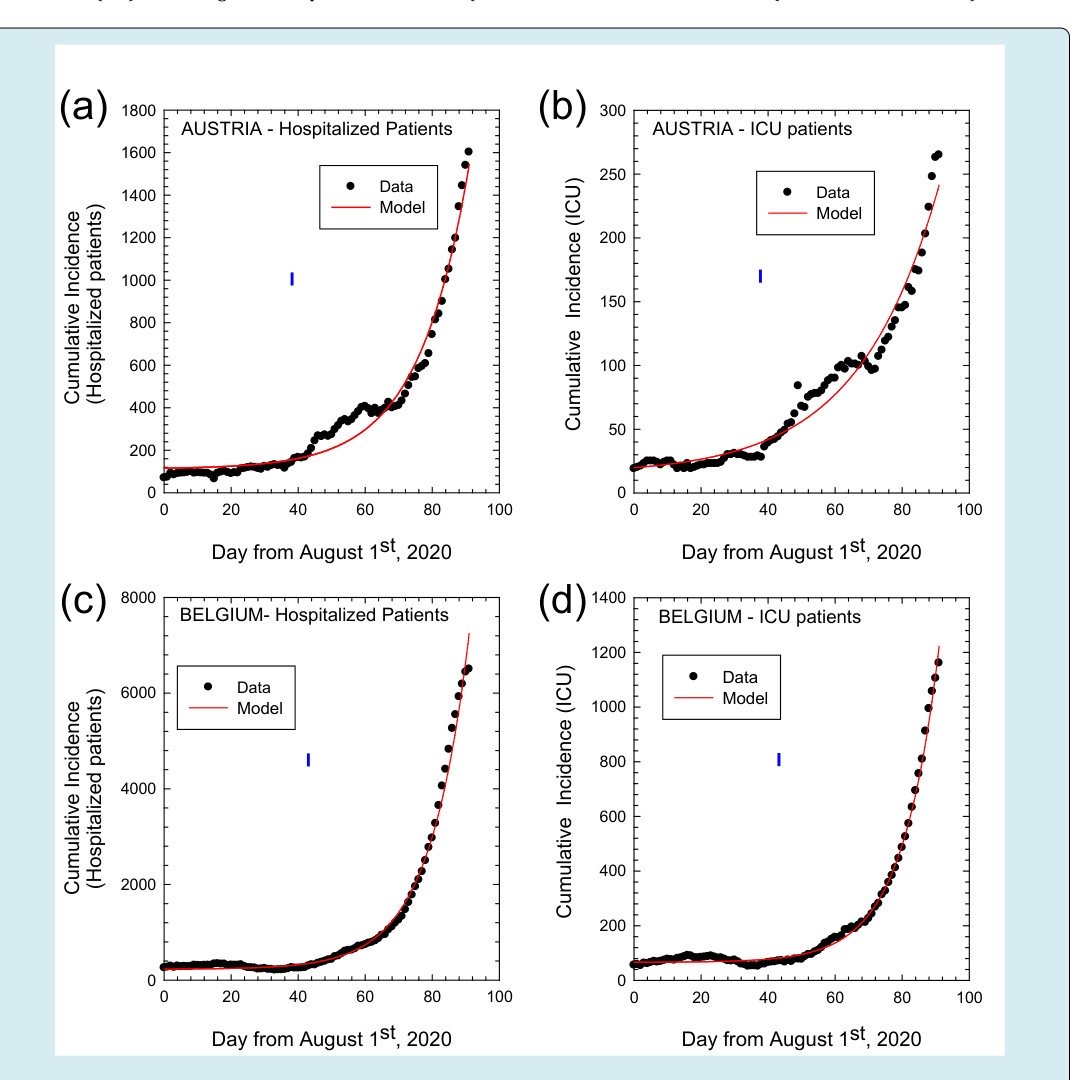
AUSTRIA - Hospitalized Patients AUSTRIA - ICU patients Figure S1: Cumulative Incidence for hospitalized and ICU patients. Legend: Cumulative incidence as numbers of total hospitalized patients (left panel) and ICU patients (right panel) from August 1st to October 31st, 2020 for COVID-19 in Austria (a), (b) and Belgium (c), (d), respectively. Dots represent observed data and solid lines the fitting curves, respectively. Vertical dashed lines mark the day after which exponential regime is observed.
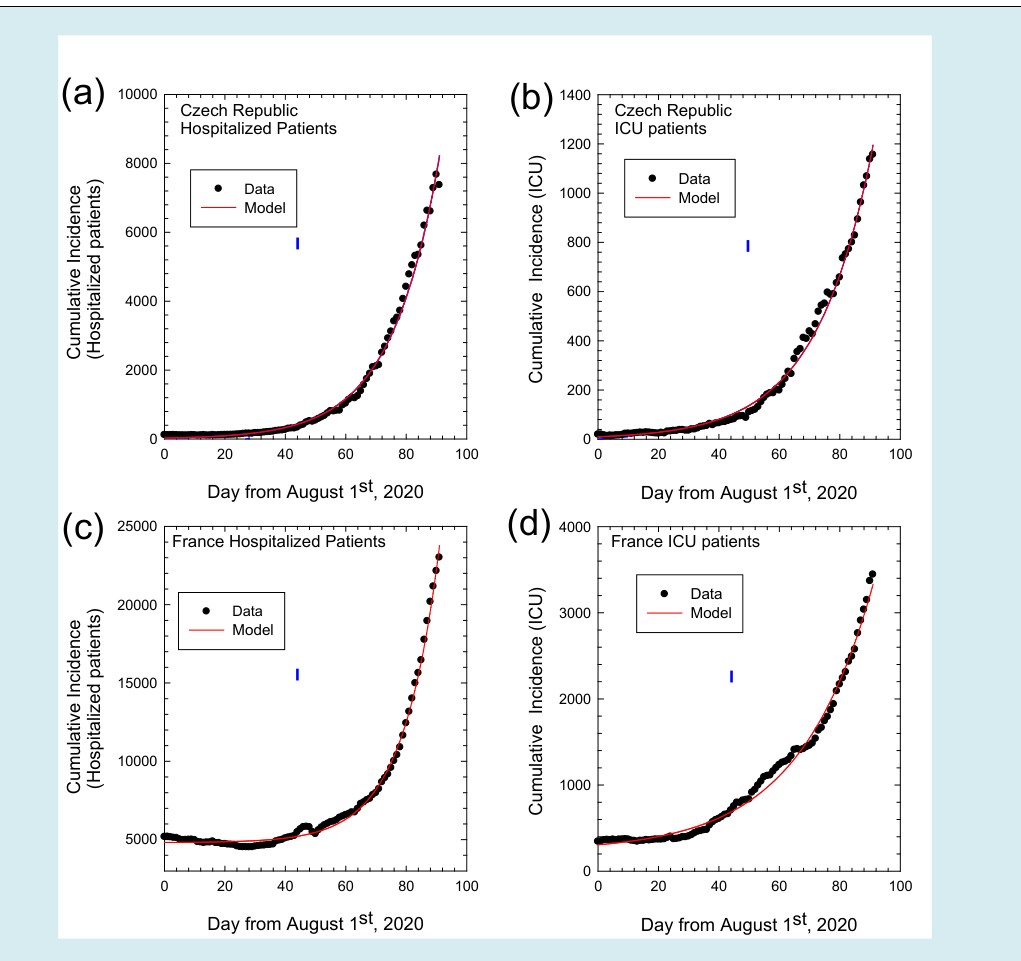
Figure S2: Cumulative Incidence for hospitalized and ICU patients. Legend: Cumulative incidence as numbers of total hospitalized patients (left panel) and ICU patients (right panel) from August 1st to October 31st, 2020 for COVID-19 in Czech Republic (a), (b) and France (c), (d). Dots represent observed data and solid lines the fitting curves, respectively. Vertical dashed lines mark the day after which exponential regime is observed.
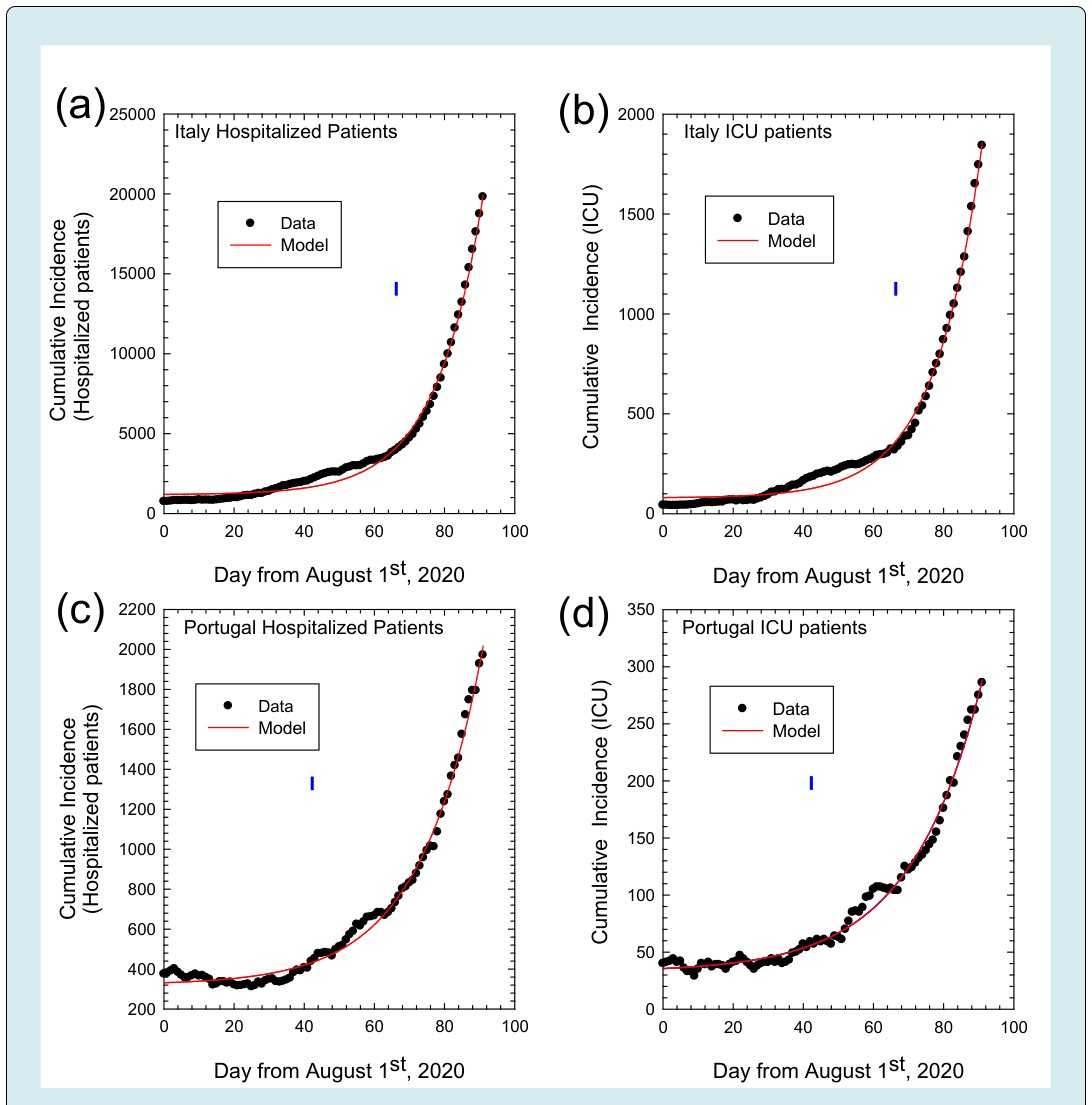
Figure S3: Cumulative Incidence for hospitalized and ICU patients. Legend: Cumulative incidence as numbers of total hospitalized patients (left panel) and ICU patients (right panel) from August 1st to October 31st, 2020 for COVID-19 in Italy (a), (b) and Portugal (c), (d). Dots represent observed data and solid lines the fitting curves, respectively. Vertical dashed lines mark the day after which exponential regime is observed.
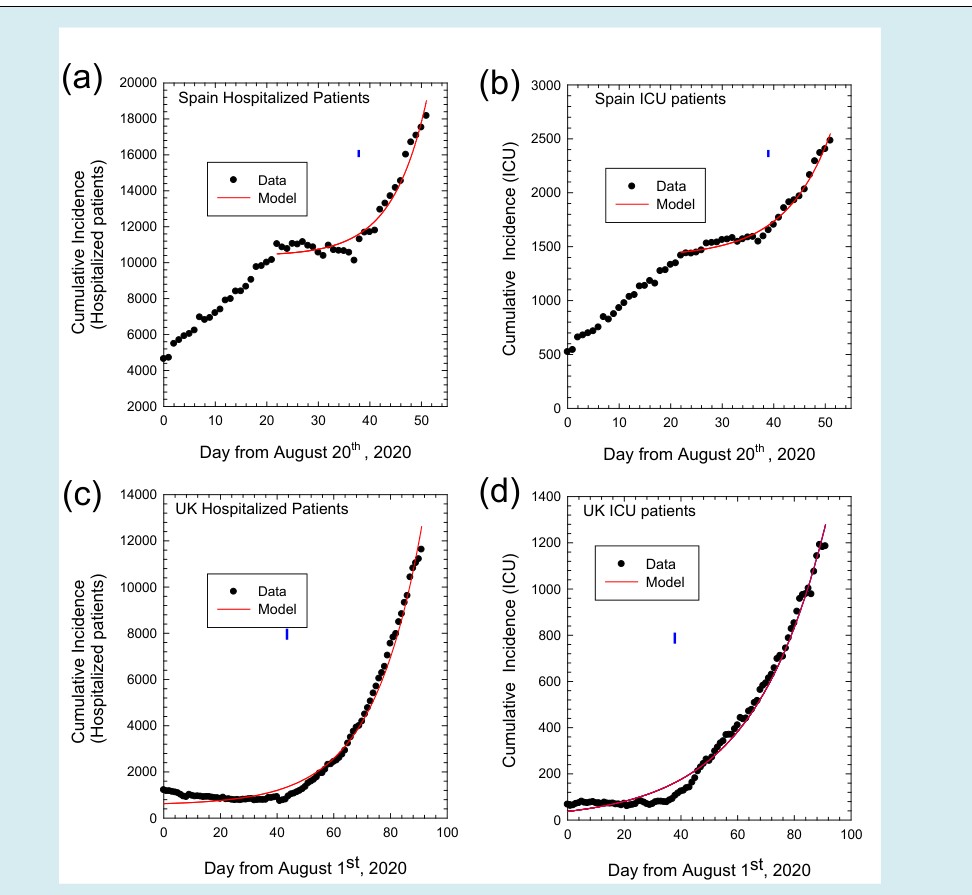
Figure S4: Cumulative Incidence for hospitalized and ICU patients. Legend: Cumulative incidence as numbers of total hospitalized patients (left panel) and ICU patients (right panel) from August 20st to October 31st, 2020 for COVID-19 in Spain (a), (b) and from August 1st to October 31st, 2020 for COVID-19 in United Kingdom (c), (d). Dots represent observed data and solid lines the fitting curves, respectively. Vertical dashed lines mark the day after which exponential regime is observed.
Discussion
For all the 2020, the COVID-19 pandemic influenced the healthcare system and economic policy of the European countries. Based on the example shown by the Chinese authorities to control the pandemic in the Hubei province, and lacking effective treatments against the SARS-COV-2 infection, before the start of the vaccination campaign, the most effective measures of public health to contain the pandemic were quarantine, social distancing, and isolation of infected people [10]. These restrictive measures caused and they are still causing massive difficulties at individual, social and economic levels. Hence, all European governments tried to achieve a satisfactory balance between economic and health needs, restricting or loosening the social constraints imposed, depending on the “warning levels”.
In this challenging context, it seems to be essential to have reliable and “manageable” indices to monitor situation of the COVID-19 epidemic trends. From a theoretical point of view, Rt is the most informative parameter, even if it could be biased by the large number of undetected infected people in an asymptomatic or mild condition, i.e. “asymptomatic infected” people [11]. Hence, the lacking of large-scale active tracing policies by the different European authorities could cause a serious underestimation of the actual number of COVID-19 cases in the population [3, 5, 6], namely in case of high-incidence of the epidemic [4, 12]. Under-reporting the total number of actual infected patients alters the epidemic trends, making containment measures ineffective or out of time [13]. Also mortality rate, the most reliable parameter, suffers of a mean delay of 15-20 days from the actual trend of epidemic (due to the COVID-19 infection and the death), making this parameter virtually unusable [7].
Here, we considered NHP and NICU taken as a cumulative incidence in Austria, Belgium, Czech Republic, France, Italy, Portugal, Spain and United Kingdom in the period between August 1st and October 31st, 2020 (for Spain between August, 20th and October 31st), to determine if some indices of them can be effective to monitor the pandemic trends. By considering August 1st as a beginning, we believe that the exponential growth of cumulative incidence observed up to November, could offer a wide time window to extract intrinsic variables related to the second wave of epidemic, before the effects of severe containment measures taken by European government. By first we point out that we did not consider the cumulative number of new tested positive cases (Nt), because Nt is strictly related to the total amount of swabs performed; moreover it could be biased by underreporting, delays and errors in classification of cases. Then, we concentrated on the data of the second wave of pandemic because of the difference in the first wave of the pandemic across the European countries considered and of the fact that the molecular swabs were developed during the pandemic peak. Moreover, the last part of the boreal summer could be considered as a kind of steady-state of the epidemic. Indeed, similar approach was impossible to perform for the first wave, where the “submerged” infections were too much to allow an accurate estimation of the initial Rt (R0) and of trends of epidemic [14].
We found that the fitted growth rate constants are similar European countries, confirming that HP and ICU are strictly related in a linear time-independent correlation. Interestingly, geographically unrelated countries shared the same evolution of the epidemic: after forty days of linear growth rate of epidemic, the growth rate constants related to HP and ICU started to show an exponential regime. The origin of this change in the trend of epidemic is not completely explainable for the complex interaction of socio-demographic, environmental and climatic factors, even if three main reasons could have influenced the autumnal second wave: the opening of the schools [15], the lowering of the temperatures and the decrease of the solar irradiance [16, 17]. In this line it is imaginable the southern Mediterranean countries (Italy and Spain) had fewer infections due to the hot temperatures and values of solar irradiance reached in the summer of 2020.
“intrinsic” COVID-19-related epidemic trends of HP and ICU emerged from our data, obviously beyond the “absolute” numbers and again until the start of containment measures. Viceversa, other parameters seem to be specific to single countries, namely HP k and ICU k . Since HP k and ICU k are inversely correlated to the generation time, they could forecast when hospital and ICU become fully occupied potentially helping national governments in applying effective containment measures. The only limitation in the use of HP/ICU related indices is the delay of these indices with respect to the actual situation. However, this delay is definitely less than those of the mortality rate [7].
Finally, icu R could be interpreted as the rate of hospitalized patients who subsequently need to be transferred to ICU and, together with icu N could be indirectly utilized to assess the efficiency of the first-level health care (home therapy and prompt hospitalization). When both icu N and icu R are high, the number of patients in intensive care units depends on the high number of hospitalized patients. On the other hand, when icu N is high and icu R is low, the health system is probably inadequate and the high ICU could be probably related to the patients directly admitted to intensive care, due to insufficient first level health care.
Conclusion
Epidemiologically, Intrinsic characteristics of the transmission dynamics of the SARS-COV 2 and socio- demographic and environmental variables are connected with and not easy to disentangle. However, we demonstrated that HP and ICU could be used as reliable indicators to trace the trend of COVID-19 epidemic.
References
-
Han E, Tan MMJ, Turk E, Sridhar D, Leung GM, et al. (2020) Lessons learnt from easing COVID-19 restrictions: an analysis of countries and regions in Asia Pacific and Europe. Lancet 396(10261): 1525-1534.
-
Rypdal K, Bianchi FM, Rypdal M (2020) Intervention Fatigue is the Primary Cause of Strong Secondary Waves in the COVID-19 Pandemic. Int J Environ Res Public Health 17(24): 9592.
-
Riccardo F, Ajelli M, Andrianou XD, Bella A, Manso MD, et al. (2020) Epidemiological characteristics of COVID-19 cases and estimates of the reproductive numbers 1 month into the epidemic, Italy. Euro Surveill 25(49).
-
Fan C, Liu L, Guo W, Yang A, Ye C, et al. (2020) Prediction of Epidemic Spread of the 2019 Novel Coronavirus Driven by Spring Festival Transportation in China: A Population-Based Study. Int J Environ Res Public Health 17(5): 1679.
-
Perico L, Tomasoni S, Peracchi T, Perna A, Pezzotta A, et al. (2020) COVID-19 and lombardy: TESTing the impact of the first wave of the pandemic. EBioMedicine 61: 103069.
-
Whittaker R, Grosland M, Buanes EA, Beitland S, Bryhn B, et al. (2020) Hospitalisations for COVID-19 - a comparison of different data sources. Tidsskr Nor Laegeforen 140(18).
-
Garcia-Basteiro AL, Chaccour C, Guinovart C, Llupia A, Brew J, et al. (2020) Monitoring the COVID-19 epidemic in the context of widespread local transmission. Lancet Respir Med 8(5): 440-442.
-
Wallinga J, Teunis P (2004) Different epidemic curves for severe acute respiratory syndrome reveal similar impacts of control measures. Am J Epidemiol 160(6): 509-516.
-
Allieta M, Allieta A, Sebastiano RD (2020) COVID-19 outbreak in Italy: Estimation of reproduction numbers over two months toward the Phase 2. medRxiv.
-
Anderson RM, Heesterbeek H, Klinkenberg D, Hollingsworth TD (2020) How will country-based mitigation measures influence the course of the COVID-19 epidemic? Lancet 395(10228): 931-934.
-
Oran DP, Topol EJ (2020) Prevalence of Asymptomatic SARS-CoV-2 Infection: A Narrative Review. Ann Intern Med 173(5): 362-367.
-
Stefanelli P, Bella A, Fedele G, Pancheri S, Leone P, et al. (2021) Prevalence of SARS-CoV-2 IgG antibodies in an area of northeastern Italy with a high incidence of COVID-19 cases: a population-based study. Clin Microbiol Infect 27(4): 633.e1-633.e7.
-
Fernandez-Fontelo A, Morina D, Cabana A, Arratia A, Puig P (2020) Estimating the real burden of disease under a pandemic situation: The SARS-CoV2 case. PLoS One 15(12).
-
Apolone G, Montomoli E, Manenti A, Boeri M, Sabia F, et al. (2020) Unexpected detection of SARS-CoV-2 antibodies in the prepandemic period in Italy. Tumori.
-
Larosa E, Djuric O, Cassinadri M, Cilloni S, Bisaccia E, et al. (2020) Secondary transmission of COVID-19 in preschool and school settings in northern Italy after their reopening in September 2020: a population-based study. Euro Surveill 25(49).
-
Guasp M, Laredo C, Urra X (2020) Higher Solar Irradiance Is Associated With a Lower Incidence of Coronavirus Disease 2019. Clin Infect Dis 71(16): 2269-2271.
-
Rovetta A, Castaldo L (2020) Relationships between Demographic, Geographic, and Environmental Statistics and the Spread of Novel Coronavirus Disease (COVID-19) in Italy. Cureus 12(11).
- Intersecting Epidemics and Climate Vulnerabilities in Conflict- Driven Displacement: Epidemiology, Systemic Challenges, and One Health Gaps in South Sudan
- Advancing Domestic Health Financing for Community Health System Sustainability in South Sudan: The Boma Health Initiative Model (2025–2035)
- Prevalence and Correlates of Post-Exposure Prophylaxis Uptake among Men Who Have Sex with Men in Kisumu County, Kenya
- Medical, Ethical, and Legal Conflicts Surrounding Euthanasia in Argentina. Its Global Implications
- Knowledge and Attitude on Menstrual Hygiene among Adolescent Girls Studying in Secondary Level in Public Schools of Chitwan District, Nepal
- Biological Efficacy of an Adulticide Mixture (clothianidin + deltamethrin) as an Indoor Residual Spray against Adult Anopheles flavirostris in Palawan, the Philippines