Marital Satisfaction: Toward an Integrated Understanding. Structural Equation Modelling Helps Unravel the Complexity of Factors that Impact Marital Success
A data set of 1030 individuals (including 392 married couples) was employed to create a comprehensive picture of the interactive impact of many variables on marital satisfaction. Predictor variables were eventually combined into 20 composite variables and structural equation modeling resulted in 78.6% of the variance in marital satisfaction being explained for men; 79.8% for women. The primary dependent variable was Relational Satisfaction. Primary predictors (all composite variables) included emotional engagement, emotional-regulation skills, destructive interactions, shared activities, family and friend support, compatibility, strength of personal identity, accuracy of perception (of their partner), personality traits, temperaments (from the DISC measure), improvement over time, and positive illusions. To measure change over time, participants answered questions for both “now” and in the “first year of marriage”. Further, a criss-cross technique (rate self and partner across all variables) facilitated many comparative predictors. The structural models found the primary predictors of relational satisfaction (with only minor differences between mens’ and womens’ models) to be: emotional engagement (with values of .56 for both), family and friend support, improvement over time, accuracy of perception, (absence of) destructive interactions, compatibility and positive traits. Equally important were predictors of emotional engagement—the greatest predictor of relational satisfaction: emotional-regulation skills (men), emotional-regulation skills (women), shared activities, accuracy of perception, family and friend support, and looking for the good explained 75% of the variance in the emotional engagement.
Introduction
The desire for a satisfying marital relationship continues to be an important life goal for many people. However, the US divorce rate, that has hovered around 50% since the 1970’s [1], suggests that this is no easy task. Researchers have sought to discover relevant principles and therapists have sought to apply those principles in their efforts to help people experiencing marital difficulty. But, the sheer number of factors and complexity of factors that impact marital success has motivated psychologists to move toward “mid- range” theories [2] designed to explore only limited aspects of the marital puzzle. Gestalt psychologists, however, argue that it is necessary to step back from time to time and look at the complete picture. That is the objective of the present research. We step back and examine how the dynamic of many interactive factors contribute to couples’ marital success and marital satisfaction.
Students enrolled in a research-methods class at a liberal arts university in central Alberta, Canada, first explored which variables might contribute toward a “complete picture”.
Eventually broad categories of questions emerged based on theoretical perspectives of leaders in the field and other research findings. The broad categories employed (referenced in detail later in this section) included: emotional engagement, destructive interactions, personal qualities/ traits, the influence of family and friends, shared activities, emotional-regulation skills, strength of identity, congruence between personal qualities (compatibility), improvement over time, accuracy of perception of their partner, personal temperament, and enhancement of their partner (often called “positive illusions”).
To measure several of these constructs required innovations in the questionnaire that extended beyond the norm. For instance, to measure improvement over time required that participants answer questions both for “now” and for “the first year of their marriage”. To measure constructs of congruency, accuracy of perception, and enhancement required a criss-cross technique to allow comparisons of the perspectives of both partners in the relationship, and to increase the objectivity of the predictor variables.
For most questions, four responses occurred. For instance, one questions used in the study was “How good a listener are you when your partner speaks?” The man would rate how good a listener he was in the 1st year of marriage and how good a listener he is now. Then he would rate how good a listener his wife was in the first year of marriage and how good a listener she is now. The woman would answer the same four questions about herself and her husband. Criss- cross allows greater objectivity by averaging the subjects’ self rating with the partners’ rating of the subject. The use of Criss-cross has a long history in couples research as a means to not only to create greater objectivity of measures, but also to gain insight into alternative perspectives of partners [3].
A question that is typically reserved for the Results section is so central to the challenges of this type of research that it is addressed prior to the Literature Review. It is the issue of multi collinearity or linear dependency. As the number of variables increases the issue of multi collinearity becomes increasingly challenging [4]. The first line of defense is to create the dependent variable (Relational Success in this case) in such a way that no questions that assess the DV are included as predictors. The DV was created with that objective in mind. In this study the DV is not only highly internally consistent (α = .97) but no questions that measure Relational Satisfaction are included as either predictors or as indicators of other composite predictor variables. The Method section adds detail.
Then there is the problem of intercorrelations between the many variables that predict Relational Success. Regressions, partial correlations, factor analysis (both confirmatory and exploratory), and internal consistency measures (Coefficient alpha) are used to minimize intercorrelation between predictors. While it is impossible to eliminate multicollinearity, all statistical resources have been employed to minimize these challenges. The ultimate test is the final structural model. If there are major challenges of multicollinearity the model will be afflicted by an array of awkward links and intercorrelated residuals (to improve the model fit) that leave interpretation many times unintelligible. Perhaps the author’s greatest pride in the study is that the final Structural model is not only an excellent fit of the data, but is also easily interpretable.
Literature Review
The topics covered in this research are so extensive, authors could come up with a thousand articles that provide background and shed light. Clearly such a task is impractical. What we do is base many of our predictors on the theoretical perspectives of key researchers in this area without further reference. Particularly we consider the work of Sue Johnson as the foundation for variables associated with emotional engagement and John Gottman with what he calls “the four horsemen”, that is, destructive interactions between couples.
Emotional Engagement. In the 1980’s Sue Johnson and Les Greenberg developed Emotionally Focused Therapy (EFT) [5]. This therapeutic style of intervention was grounded in the attachment theory of John Bowlby [6]. The idea that attachment theory relates only to young children has expanded to include attachment as a universal human need equally as important to adults and their relationships. Attachment theory sees all humans as wired for and in need of secure emotional bonds and that a secure attachment develops when partners are responsive to their partners needs and emotions [7]. According to Johnson, the EFT model prioritizes emotion engagement and emotional regulation as the key organizing agents in relationship interactions [5].
Research has found that emotional engagement is associated with both short-term and long-term enhancement of marital satisfaction [8, 9], ability of partners to respond to each other in ways that are emotionally satisfying [10], and to encourage emotional responsiveness and strengthen the emotional bonds between partners [11].
The specific positive activities associated with emotional engagement include, among others, verbal expression of love; expression of affection; physical intimacy, being available when your partner reaches for you; and understanding the emotional needs of each other [5].
A seeming omission from this project (in the context of emotional engagement) is the topic of communication. Clearly authors considered communication as a possible predictor. However, recent research by Lavner, et al. [12] questions the causative nature of communication on marital satisfaction. The two constructs (good communication skills and marital satisfaction) are significantly correlated, but the causal direction has not been clearly established. This study holds that emotional engagement and regulation are more important pathways underlying communication in predicting marital satisfaction than the communication style itself.
Destructive Interactions. John Gottman [13, 14] identified four types of interactions between couples that are so destructive that, if unchecked, invariably leads to termination of the relationship. Gottman calls them “The four horsemen of the apocalypse” and they include the initiator’s expression of criticism, and contempt, and the respondent’s reactions of defensiveness, and stonewalling. Gottman’s extensive research in this area (summarized in the references listed above) substantiates the validity of his statement.
Personality constructs. The influence of certain personality constructs on RS is widely acknowledged, however, in the present study our interest focuses on what personality traits uniquely contribute to the dynamic of factors that influence relational satisfaction. Past research has revealed that emotional stability, social skills, and agreeableness are associated with greater relational satisfaction [15, 16, 17, 18, 19, 20, 21]. By contrast, hostility and depressiveness are predictors of lower relational satisfaction [22, 23].
Family and friends influence. An article currently under review [24] dealing with impact of outside friends on relational satisfaction provides some insights. For both men and women, the support of family and friends was the greatest single predictor of Relational Satisfaction of all friendship-related variables.
Earlier research finds that the presence of in-law relationships is associated with greater RS [25]; as is the support by parents of their children’s marriages [24]. Equally as strong was the finding that strain between parents and their married children was associated with poorer RS [26, 27].
Past literature on the influence of outside friendships on couples’ relationships has indicated that a rich network of friends is associated with greater relational satisfaction [28, 29]; approval from friends and family increases couples’ stability [30, 31]; incorporation of outside friendships substantially benefits relational satisfaction of couples [32]; and that the increase of perceived network support is associated with a decrease of intention to break off a relationship [33].
Behavioral Activities/Engagement. Research has explored many dimensions of this topic. For instance, Reissman, et al. [34] in an experimental setting explored the impact of exciting or pleasant shared activities on marital satisfaction with the result that marital satisfaction was enhanced more by exciting activities than pleasant activities. Kaplan, et al. [35] exploring the impact of shared goals on marital satisfaction found that both mutual support and shared efficacy between partners correlated strongly with marital satisfaction. Reimnitz, et al. [36] in a study of older couples (mean age ≈70) discovered that mutual conversation and shared problem solving played a substantial role in marital satisfaction of the couple. Bailey, et al. [37] found that marital satisfaction was highly correlated with shared meals and number of dates in a month. Parker-Pope, in a [38] New York Times article provided anecdotal evidence (with generous reference to experts in the field) of the benefits to reasonably-stable married couples of new and innovative date nights. Freise, et al. [39] research revealed that religious traditions significantly enhanced relational satisfaction of the couple although the impact for men and women differed. Fiese, et al. [40] found that family traditions with young children (5 years and younger) not only enhanced the family dynamic but also increased the marital satisfaction of the couple.
Emotional regulation skills. The best article the authors found that explores and defines the general topic of emotional regulation is Campos, Walle, et al. [41]. Essentially this perspective acknowledges that much of the research on emotional regulation involves an intrapersonal approach (what internal resources allow a person to regulate their emotions) but for effectiveness must also incorporate the relational component as well (regulation of emotions in the context of interaction with another). Their conceptualization of emotional regulation is what the present study embraces. Bloch, et al. [42] conducted innovative longitudinal research exploring the impact of emotional regulation skills on conflict resolution and on the marital satisfaction of couples. Results found the couples’ ability to regulate the emotional content of their interactions was strongly correlated with marital satisfaction. Damankeshan, et al. [43] explored the impact of emotional regulation with 306 Iranian women. Results found that emotional-regulation skills were associated with lower levels of (a) anger, (b) feelings of revenge, (c) anger rumination, and greater marital satisfaction. Shahid, et al. [44], with a sample of 200 Pakistani married couples, found Emotional
regulation skills highly correlated with Marital satisfaction. They also discovered gender differences in which men had significantly better emotional regulation skills than women. Feeney with a sample of 238 Australian married couples, found that the expression of positive emotion and the control of negative emotions (emotional regulation) was significantly correlated with marital satisfaction. Consistent with Campos and colleagues’ definition of emotional regulation, Mazzuca, et al. [45] explored the interactive nature of intrapersonal and interpersonal aspects of emotional regulation. Their study found a strong link between both types of regulation and marital satisfaction.
Essence qualities. The term “essence qualities” is identified as the specific contents of one’s personal identity. The construct has only recently been introduced to research literature [46, 47]. The concept parallels the theories of personal identity [48] and self complexity [49]. All three constructs have similar effects on relational satisfaction: Those with a stronger identity (Erickson), who have greater self complexity (Linville) and possess stronger essence qualities (that is, more heavily defined across many personal characteristics) have an array of desirable personal traits (e.g., higher self-esteem, emotional stability, agreeableness; lower depression and hostility), including more successful personal relationships. For instance, in the George, Wisdom and colleagues’ article, strength of essence qualities correlated .34 with relational satisfaction (p < .001), congruence between essence qualities (a measure of compatibility) among couples correlated .32 (p < .001) with relational satisfaction.
Accuracy of Perception. Tucker, et al. [50] found that anxiously attached married men experienced poorer marital satisfaction due to their inability to accurately perceive their Partner’s feelings. Solomon, et al. [51] discovered that the best relational outcomes occur when couples learn to see beyond biases and achieve accuracy of perception in romantic relationships. An older study [52] found that greater relational satisfaction was associated with congruence between the husband’s expectations and the wife’s perception of those expectations. Recently George & Wisdom [53] revealed perceptual accuracy to enhance couples’ satisfaction in the context of both married and dating relationships. The Neff & Karney [53] phrase “Individual accuracy and global enhancement” supports the concept of the importance of accuracy of perception but expands on how enhancement (not positive illusions) characterizes good marriages.
Temperament. The topic of temperament has received little attention in quantitative psychological literature because temperament, by definition, is a combination of qualities. Popular instruments such as the MBTI and the DISC are widely used in counselling or seminar settings, but, again, are difficult to research because of their multidimensionality.
In a 2020 article [47] the four DISC temperaments were used as part of a compatibility measure by assessing congruence of temperament among married couples. And, those who were more congruent on these measures, had significantly greater marital satisfaction. The DISC temperaments will be used in the present study in a similar way.
Change over time. That marriages change over time is axiomatic, and a fair number of studies have explored those changes. This study, however, is the first to attempt to quantify the amount of change over time across a wide array of predictor variables; then, measure how that change impacts relational satisfaction. Past research focuses on what changes take place, why these changes occur, why evaluation of the marriage declines over time despite high motivation to maintain initial feelings [54]. Other research explored the contrasts between cross-sectional and longitudinal research and performs a meta-analysis to uncover how the marriage quality and stability change over time [55]. In longitudinal research, Sprecher [56] explored how perceived changes in a couples’ love, commitment, and satisfaction changed over time. Consistent with the Karney [54] and Karney and Bradbury [55] his research indicated that even couples who stayed together did not experience an increase in love, commitment or satisfaction. Montgomery [57] explored the contradictory concepts of stability and consistency in marriage with the reality that change is at the heart of all social processes.
Hypotheses
The authors felt that to document 20 or 25 different hypotheses would be distractive rather than elucidating. In general, we anticipate results similar to those cited in literature above. But the task of the study extends well beyond confirmation of hypotheses or replication of prior studies. We seek to understand the dynamic of factors that moves us toward a more complete picture of components that contribute to overall relational satisfaction of married couples.
Method
Participants. A total of 1030 subjects returned valid, completed forms. A total of 1486 individuals opened the questionnaire link, yielding 456 “incomplete” forms. Common to online survey research, the majority of the incomplete forms entered no data at all; others completed only a small subset of questions. Of the 1030 valid forms, 784 were paired with their spouse, or, 392 couples. The remaining 246 participants were unpaired. For essentially all analyses the data set of 392 couples is employed. All but one of the 392 couples were heterosexual yielding a gender break down of 391 men and 393 women. For all analyses (in the Results
section), the N for men is 391, the N for women is 393, and the N for couples is 392—unless otherwise specified.
The ethnic composition of the group (couples only) included 347 Whites (44%), 325 Blacks (41%), 76 Asians (10%), 23 Hispanics (3%) and 13 DTS or other (2%). The mean age of men was 48.2 (range 21 - 89); the mean age of the women 45.6 (range 19 - 83). The mean duration of the marriages was 19.6 years (range <1 – 63 years). Religious affiliations included 80 Catholics (10%), 587 Protestants (75%), 75 Atheist or Agnostic (10%), and 39 Eastern Religions (Buddhist, Muslim, Hindu, Sikh) (5%). Education levels averaged 3.7 years of university for men; 3.4 years for women. (range: <HS - doctorate).
This study was approved by the university Ethics Board prior to data collection.
Materials
Materials included separate but identical questionnaires for the subjects and the partners. The survey was crafted with gender-neutral wording allowing men or women to complete the same forms. This questionnaire was hosted by Survey Monkey Inc.
The questionnaires were structured in the following way: The initial screen included instructions that identified the sponsoring organization, brief description of the study, assurance of confidentiality, informed consent, debriefing and further instructions about how to complete the questionnaire. Instructions were followed by 12 demographic items, then 33 questions, randomly distributed, assessed issues of emotional engagement, emotional regulation, destructive interactions, shared activities and the support of family and friends. The next set of questions assessed strength of essence qualities in 14 different areas, followed by 4 questions dealing with temperament 5 ratings of personality traits, and 11 questions that assessed Relational Satisfaction. Of 62 questions (following the demographic items), the final 52 questions required four responses (1st year and now, self and partner) and another 10 questions were couple-specific and required two responses (1st year and now).
Procedure
Participants were acquired by students enrolled in a research methods class at a liberal-arts university in central Alberta, Canada. Students contacted individuals they knew to ask their willingness to participate in the study. Contacts were made in person, by telephone, e-mail or social media. Links were sent out to all who agreed to participate. Couples were instructed to complete the questionnaires separately. Clicking the link opened the questionnaire. When participants were finished, data was automatically forwarded to the Survey Monkey data base.
Variables
There are many individual and composite variables (several of them mathematically complex) involved in this study; 20 composite variables alone. To streamline the paper, we provide a “Variables” section that includes components of both the Method and Results. Common to any Method section we identify how variables are crafted and measured. In addition, a number of the composites are mathematically complex and often involve factor analysis to support their creation. By incorporating mathematical underpinnings into this section, all composite variables are reported in one location and in order. Table 1 then provides a single reference that summarizes how each variable was created, indicators involved, and lists standard psychometrics.
Clarification on terminology is important. A “Criss- crossed” variable refers to the mean of the self-rating of the subject and the partner-rating the subject. A “Couple- specific” variable (or composite) identifies questions that refer to the couple as a unit, such as “how often do the two of you have a stimulating exchange of ideas?” A “gender- neutral” variable refers only to composite variables that includes both the male and the female perspective; such as, “how well do you understand your partner’s emotional needs (men),” and “how well do you understand your partner’s emotional needs (women).” Whether composites were Gender-specific or gender-neutral was entirely based on factor analysis results. For clarity all variable names are capitalized. Example: emotional engagement is measured by the variable “Emotional Engagement”. We begin with an explanation of the factor analysis procedure that contributed to the formation of composites.
Factor analysis. The composite variables were created based on support from literature and factor analysis. Most of the composites are simply based on literature support. However, some constructs are the result of the factor analysis of all predictor variables. In this sense we employ both confirmatory (to support hypothesized structure) and exploratory (to explore alternative options) factor analysis all in one model. For example: Factor analysis grouped traits for men and traits for women into two separate factors. Based on literature, it is unlikely that we would have predicted that.
Factor analysis was conducted with 60 predictor variables. The only variables not included were the demographics, the Relational Satisfaction indicators, Essence Qualities, and, due to their multi-dimensionality, the temperament variables. In short, all valanced variables were included except for Relational Satisfaction. The objective was to aid in the clustering of variables described in the Introduction. The sample size of 392 couples yields a 13:1 ratio of participants to variables, entirely adequate for factor analysis [58]. Factors were extracted by the Generalized Least Squares procedure and were rotated to a final solution by the Varimax method with Kaiser normalization.
Relational Satisfaction (men and women). The primary dependent variable was a composite of two different relationship satisfaction questionnaires: The 8-item George- Wisdom Relationship Satisfaction Scale (GWS) [59] and the 3-item Kansas Marital Satisfaction Scale (KMS) Schumm, et al. The George-Wisdom scale asks questions about 8 specific areas that measured relational satisfaction, including: security, feeling loved, experience of joy, appreciation, trust, respect, shared activities, fun and laughter. The KMS asks three global questions about satisfaction with the relationship, satisfaction with their partner, and how well the partner fulfills their needs. All 11 items were assessed on 7-point scales; anchors varied based on the nature of the questions. The final measure of RS was the mean of the 11 items. These 11 questions, with a mix of specific and global, yielded excellent internal consistency (alphas of .97 for both men and women).
Predictor Variables overview. The predictors were selected so as to ensure that none were linearly dependent with any of the indicators of Relational Satisfaction. Specifically, none of the predictors measure a response of feeling secure, loved, joyful, appreciated, trusted, respected and so forth.
For the 51 predictors used in analyses (or in creating composites) all were scored on 7-point scales. Anchors varied based on the nature of the question. Forty-one of the questions required four responses: self in the 1st year, self now; partner in the 1st year, partner now. The other 10 questions were Couple specific and required two responses, 1st year and now. Further, in crafting the final values, variables are criss-crossed unless otherwise specified.
Emotional Engagement (gender neutral). The first composite was the mean of 14 variables, included Sexual Interaction (m/w), expressing Affection (m/w), expressing Love (m/w), expressing Feelings (m/w), being Kind Caring & Considerate (m/w), effective use of Love Languages (m/w), and Understanding Emotional Needs (m/w). Factor loadings ranged from .794 to .347; Internal consistency: α = .95.
Destructive Interactions (gender neutral). The second composite was the mean of nine variables and included: Defensiveness (m/w), Criticism (m/w), Shutdown (m/w), Overreacting (m/w), and the couple-specific variable Argument, Contention and Criticism pervades. Factor loadings ranged from .788 to .596; Internal consistency: α = .90.
Traits (men). The next composite was the mean of the five traits for men: Emotional Stability, Agreeableness, Social Skills, and (absence of) Depression and Hostility. A single factor uniquely defined traits for men; Factor loadings ranged from .740 to .545 Internal consistency: α = .80.
Traits (women). Traits for women was the mean of the five traits and included: Emotional Stability, Agreeableness, Social Skills, and (absence of) Depression and Hostility. Factor loadings ranged from .740 to .545 Internal consistency: α = .78.
Family and Friends. The mean of four variables, included the gender-neutral (a) Support of Friends, (b) Support of Family, (c) the woman’s Baggage, and (d) the men’s Baggage. The inclusion of baggage is based on high inter correlations and factor analysis results. Factor loadings ranged from .766 to .355 Internal consistency: α = .75.
Shared activities. The mean of the five variables; all activities were Couple Specific and involved (a) Shared projects, (b) Stimulating Exchange of Ideas, (c) Shared Passionate Goals, (d) a pattern of Dating and (e) shared Traditions. Factor loadings ranged from .514 to .303; Despite low factor loadings, internal consistency was good: α = .75.
Emotional Regulation Skills for women. The next composite was the mean of eight variables and included: No urge to respond, Patience, Focus on Resolving rather than Blaming, Understanding, Supporting the Growth of her Partner, excellent Listening Skills, Addressing Pressing Needs, and Skill at bringing up a Difficult Topic. Factor loadings ranged from .743 to .415 Internal consistency: α = .85.
Emotional Regulation Skills for men. The next composite was the mean of eight variables and were the same qualities as those listed for women. Factor loadings ranged from .677 to .365; Internal consistency: α = .88.
Look for the Good (gender neutral). This composite was the mean of men Looking for the Good and women Looking for the Good with factors loadings of .795 and .803. Although there was an argument for including this factor under Emotional Regulation Skills, the factor loadings were so high that we kept it as a single variable; Internal consistency: α = .87.
The computed variables; overview. The computed variables include Accuracy of Perception for men and for women, Compatibility as measured by congruence of essence qualities (Couple Specific), Strength of Identity for men and for women, Improvement over time for men and for women, Enhancement for men (viewing his wife more positively than the wife views herself), Enhancement for women (viewing her husband more positively than the husband views himself), and a combination of the “S” and “C” qualities from the DISC measure (abbreviated S&C) for men and for women.
Since “essence qualities” are central to the computation of two of those variables, we pause to explain this construct before we continue the description and computation of composites. Essence qualities was first introduced to academic literature in 2020 [47]. These are qualities that identify the contents of the identity of an individual. In the present study, 14 essence qualities are listed and participants rate (on a 7-point scale) to what extent each quality defines them. For example, one of the 14 is “Enthusiastic pursuit of fitness” with anchors of Avoid activity at all cost (1) to moderately (4) to fitness enthusiast (7). These ratings can be used to calculate the strength of essence qualities (the mean of the 14) and also to construct a PSC (Personal Similarity Correlation) to identify how congruent the couple are on these essences. Topics covered include: Understanding, Social, Perceptive, Generous, Cherish family and family events, Love of learning, Deeply Spiritual, Ever Growing, Creative, Disciplined, Neat and orderly, Musical, Logical, Enthusiastic Pursuit of Fitness.
Compatibility: PSC of the essence qualities (gender neutral). PSC stands for Personal Similarity Correlation and has been gaining visibility in the relationship-satisfaction literature in recent years [47, 60, 61, 62]. A PSC involves the calculation of the correlation between constructs shared by Variable code computation indicators mean std. dev skew kurtosis alpha Emotional Engagement GN mean of indicators Emotional Regulation skills M mean of indicators pressing problems, difficult topics, listening, support growth, patient, no urgency, no blame, understanding Emotional Regulation skills W mean of indicators 5.49 0.79 -0.71 0.67 0.85 Destructive Interactions GN mean of indicators Traits M mean of indicators agreeableness, emotional stability, social skills, (lack of) depression, hostility Traits W mean of indicators 5.44 0.85 -0.62 0.18 0.78 both couples. In this case it is the correlation between the 14 essence qualities that couples share. For this PSC the self- ratings are employed (not the criss-crossed values) as we are measuring the congruence of the self-perception of the man with the self-perception of his partner. A negative correlation suggests that that their essences contrast with each other— such as a professional musician married to someone who hates music. A zero correlation suggests that their essences are unrelated to each other. A positive correlation suggests that their essence qualities are shared—one measure of compatibility.
Strength of identity (men and women). For men, this is the mean of the self rating of the 14 Essence Qualities. For women it is also the mean of the self-rating of the 14 Essence Qualities. The rationale is that the higher the rating across these 14 contrasting qualities, the stronger their self-identity.
Accuracy of perception (men and women). Accuracy measures are calculated for men and for women. For all variables employed, Accuracy is the mean of the absolute values for all the variables for the man’s rating of his wife minus the wife’s self-rating; or, the mean for all variables for the woman’s rating of her husband minus the husband’s self-rating. See (Table 1) for the formula. The objective is to measure how accurate the couples are at perceiving each other. All scores are positive and range from 0 (identical perspectives) to 6 (polar opposite perspectives). Actual discrepancies ranged from .33 to 3.25 (men) and .22 to 3.50 (women).
sex, affection, express love, love languages, express feelings, understand needs, kind- caring-considerate
5.78 0.93 -1.08 1.2 0.95
5.41 0.85 -0.7 0.87 0.88 defensive, critical, shutdown, overreact, angry-contentious environment
4.38 1.06 -0.19 -0.14 0.9
5.58 0.85 -0.93 1.11 0.8
Family & Friends’ support GN mean of indicators family support, friends support, absence of baggage 6.12 0.79 -1.12 1.15 0.75 Shared Activities CS mean of indicators Look for the Good GN mean of indicators look for good men, look for good women 5.6 1.12 -0.82 0.41 0.87 $$ \text{Accuracy of Perception} \quad \mathrm{M} \quad \frac{1}{n} \sum | \text{woman self rate} - \text{man rate wife} | $$ Accuracy of Perception W $$ \frac {1}{n} \sum | m a n s e l f r a t e - w i f e r a t e m a n | $$ $$ \frac {1}{n} \sum | m a n r a t e w i f e - w o m a n r a t e m a n | $$ Enhancement M $$ \frac {1}{n} \sum | \mathrm {w i f e} r a t e m a n - m a n r a t e s e l f | $$ Enhancement W Improve over time M
1
CC ratenow CC rate first year
$$ \frac {1}{n} \sum C C r a t e n o w - C $$
Improve over time W
1
CC ratenow CC rate first year
$$ \frac {1}{n} \sum C C r a t e n o w - C $$
Compatibility GN PSC of men with women 14 essence qualities r = .36 0.34 -0.54 -0.21 -- on essence qualities S&C M Mean of “S” and “C” scores from the DISC S&C W C: organized, hard working 5.77 0.76 -0.43 -0.19 -- Strength of Identity M
1 14_CC essence qualities_ n∑ Strength of Identity W 5.38 0.61 -0.31 0.3 -- traditions, dates, stimulating conversation, shared projects, passionate goals
- Code: M = men, W = women, GN = gender neutral, CS = Couple specific, CC = criss-crossed.
Table 1: Psychometrics, Computation and Indicators of all Composite Variables.
S&C (men and women). This variable name refers to the “S” and “C” dimensions of the DISC scale. Preliminary correlational analyses suggested that a combination of those two temperaments could be a significant predictor. “S” is the nurturing, caring, supportive dimension whereas “C” is the organized, results oriented, hard worker. The theory is that nurturing, caring, supportive combined with organized and hardworking is likely to have a significant benefit on relational satisfaction. The variable is simply the mean of the two values.
Enhancement (men and women). The impact of enhancement (often referred to as “positive illusions”) on relational satisfaction has been heavily researched in the last few decades—with mixed results [47, 53, 63] In this study Enhancement is the mean of the sum of discrepancies (across all primary variables) between the subject’s self rating and the partner’s rating of the subject. A positive value indicates that the partner enhanced (rated the partner higher the partner rated him or herself). A zero value refers to neither enhancement or diminishment. A negative score refers to the partner rating the subject lower than the subject rates him or herself. This variable ranges theoretically from -6 (polar opposite negative ratings) to +6 (opposite positive ratings). Actual enhancement scores ranged from -2.50 to 3.00 (men) and -2.53 to 2.78 (women).
Improvement (men and women). The authors are aware of the difficulty of analyses using retrospective data [64, 65]. The error variance is known to be larger when remembering from the past. However, evidence suggests that the variance, in this setting, would tend be random or unbiased, see Piasecki, et al. Thus, retrospective data can be used in analyses, but statistical power will often be lower due to these challenges.
Two different Improvement measures are calculated: one for men, one for women. The calculation of this score is the mean of the difference between scores in the first year and scores now across all valanced variables. A negative value indicates there has been decline. A zero value indicates no improvement. A positive score represents improvement over time, the larger the score, the greater the improvement. Actual scores ranged from -2.0 to +3.0 for both men and women.
Results
Psychometrics of Relational Satisfaction. The primary dependent variable is Relational Satisfaction (abbreviated RS throughout the paper). Psychometrics of RS-in-the-first-year-of-marriage (for both men and women) were acceptable with skewness and kurtosis values ranging between -1.25 and 1.31. The RS measures for the present revealed challenges that occur with essentially every relational-satisfaction questionnaire: So many participants rate the quality of their relationship high, that it generates skewness and kurtosis challenges. The values for RSmen are -1.56 and 2.17, for RSwomen are -1.47 and 1.90; log manipulations did not improve psychometrics. While not ideal, these values are generally considered acceptable for further analysis [4].
The Influence of Demographics
Age, duration of the relationship, level of education (plus educational discrepancy), and joint family income showed no significant association with any of the Relationship Satisfaction variables. Shifting to the data set where individuals were assessed (prior to coupling) we find an overall N of 1030 from six broad world regions. One-way ANOVA did not find significant differences with the Relational Satisfaction variable. However, we list the six groups with their N and Relational Satisfaction score (combined genders) for perspective on the breadth of the sample: Canada (N = 614, M = 6.03); United States (N = 128, M = 6.11); Caribbean (N = 103, M = 5.92); Europe (N = 54, M = 6.23); East Asia (N = 32, M = 6.53); Africa (N = 91, M = 5.94). The other 18 individuals were from Australia/New Zealand or Central/South America. There were no differences in Relational Satisfaction based on four denominational groupings (Catholic, Protestant, Atheist/ Agnostic, and Eastern Religions). Finally, we did find one significant difference based on ethnicity of the participants, F(3, 381) = 3.97, p = .008. Asians (M = 6.53) had greater relational satisfaction than Blacks (M = 6.03).
Bivariate Correlations
Correlations between predictors and Relational Satisfaction were computed first, followed by a correlation matrix of key predictors to check for linear dependency. Since there are so many variables it would add unnecessary text to describe the matrix in this paper. Detail on the composite variables is covered later in this section.
Nevertheless, to give a feel for the most influential of the individual variables we list a number of the highest correlations with Relational Satisfaction (roughly in order) found in these early analyses: Correlations values ranged from .62 to .79 and all are significant at the p < .001 level. Kind, Caring & Considerate-men with RS_women_ (r = .79) and RS_men_ (r = .76); Effective use of Love Languages-men with RS_women_ (r = .75), Effective use of Love Languages- women with RS_men_ (r = .72); Express Feelings-men with RS_women_ and Express Feelings-women with RS_men_ were both (r = .68); Support Growth-men with both RS_men_ and RS_women_ (r_s = .69, .68); Shared Passionate Goals with RS_women (r = .66) and RS_men_ (r = .64); Expression of affection-men with RS_women_ (r = .67), Expression of affection-women with RS_men_ (r = .66); Express love-men with RS_women_ (r = .67), Express love-women with RS_men_ (r = .67); Stimulating Exchange of ideas with RS_women_ (r = .65) and RS_men_ (r = .64); Focus on Solutions rather than Blame-men with RS_women_ (r = .63); Enjoyable sex-women with RS_women_ (r = .63) and RS_men_ (r = .62); and Patience- men with RS_women_ (r = .62).
Bivariate correlations between composites and Relational Satisfaction
We choose to not multiply words here as (Table 2) provides all information about bivariate correlations between each composite and Relational Satisfaction for men and women. Also, the Beta weights from the regressions (following section) are also included. In (Table 2) variables are listed from highest bivariate correlations to lowest. One comment about the beta weights from regression: It is interesting how incomplete a picture they provide compared to the structural model. For instance, It shows that Emotional Regulation Skills and Look for the Good have no impact in regressions; both are major players in the structural models.
| Correlation (r) | Regression (β) | |||
|---|---|---|---|---|
| RSmen | RSwomen | RSmen | RSwomen | |
| Emotional Engagement (GN) | 0.85 | 0.85 | 0.56 | 0.56 |
| Emotional Regulation skills (men) | 0.74 | 0.75 | -- | -- |
| Emotional Regulation skills (women) | 0.71 | 0.71 | -- | -- |
| Shared Activities (CS) | 0.72 | 0.73 | 0.15 | 0.15 |
| Family & Friends’ support (GN) | 0.63 | 0.63 | 0.18 | 0.19 |
| Accuracy of Perception (men) | -0.5 | -0.5 | 0.08 | 0.09 |
| Accuracy of Perception (women) | -0.52 | -0.54 | -- | -- |
| Traits (men) | 0.51 | 0.51 | 0.05 | -- |
| Traits (women) | 0.4 | 0.43 | -- | -- |
| Improve over time (men) | 0.47 | 0.48 | 0.07 | 0.09 |
| Improve over time (women) | 0.44 | 0.45 | -- | -- |
| Look for the Good (GN) | 0.47 | 0.48 | -- | -- |
| S&C (men) | 0.46 | 0.49 | -- | 0.05 |
| S&C (women) | 0.4 | 0.41 | -- | -- |
| Strength of Identity (men) | 0.4 | 0.42 | -- | -- |
| Strength of Identity (women) | 0.38 | 0.4 | -- | -- |
| (avoiding) Destructive Interactions (GN) | 0.44 | 0.43 | 0.12 | 0.11 |
| Compatibility (CS) | 0.34 | 0.34 | 0.05 | 0.05 |
| Enhancement (men) | -0.13 | -0.15 | -- | -- |
| Enhancement (women) | 0.01 | 0.02 | -- | -- |
Table 2: Bivariate correlations and Standardized Regression Coefficients for Composite Variables on Relational Satisfaction.
Code: GN = gender neutral, CS = Couple specific. Table 2: Bivariate correlations and Standardized Regression Coefficients for Composite Variables on Relational Satisfaction.
Percent of Relational Satisfaction Explained
Regression analysis was conducted with Relational Satisfaction as the dependent variable. Two regressions were run; one with the mens’ RS and the other with the womens’ RS as dependent variables. Only the composite variables are included as predictors. Both models employed the Stepwise method with a p-to-enter of .07 for the men’s model, .05 for the women’s model.
Men’s relational satisfaction. For men, 8 variables entered the regression equation: R(1, 383) = .886, _R_2 = .785, p < .001. Thus, this analysis reveals that 78.5% of the variance in relational satisfaction for men is determined by the predictors. Significant predictors ranked ordered from high to low are: Emotional Engagement of the couple (β = .56), the influence of family and friends (β = .18), shared activities (β = .15), avoiding destructive interactions (β = .12), the man’s accuracy at perceiving his wife (β = .08), the man’s improvement over time (β = .07), positive personal qualities (β = .05), and congruence on the couples shared essence qualities (β = .05).
Women’s relational satisfaction. For women, 8 variables entered the regression equation: R(1, 383) = .893, _R_2 = .798, p < .001. Thus, this analysis reveals that 79.8% of variance in relational satisfaction is determined by predictors. Significant predictors rank ordered from high to low are: Emotional Engagement of the couple (β = .56), the influence of family and friends (β = .19), active engagement in activities (β = .15), avoiding destructive interactions (β = .11), the man’s improvement over time (β = .09), the man’s accuracy at perceiving his wife (β = .09), the strength of the man’s S&C (β = .05), and congruence on the couples shared essence qualities (β = .05).
Gender differences: Men and women did not differ on ratings of relational satisfaction. However, there were some differences among the predictors. Note: only differences with a Cohen’s d greater than .25 are reported. Men were found to be older [M_s = 48.2 vs. 45.6; _t(391) = 11.76, p < .001]; to be more logical [M_s = 5.69 vs. 5.17; _t(391) = 8.39, p < .001]; were more likely to overreact [M_s = 4.02 vs. 4.63; _t(391) = 8.00, p < .001]; were more emotionally stable [M_s = 5.58 vs. 5.19; to _t(391) = 5.59, p < .001]; were more critical [M_s = 4.14 vs. 4.44; _t(391) = 5.40, p < .001]; more defensive [M_s = 4.15 vs. 4.45; _t(391) = 5.07, p < .001]; and more likely to shut down during a difficult conversation [M_s = 3.93 vs. 4.34; _t(391) = 6.08, p < .001]; Women were found more likely to cherish family and family events [M_s = 6.18 vs. 5.85; _t(391) = -5.92, p < .001]; were more spiritual [M_s = 5.51 vs. 5.14; _t(391) = 6.30, p < .001]; were neater [M_s = 5.58 vs. 4.96; _t(391) = -8.01, p < .001]; were more nurturing and supportive [M_s = 6.01 vs. 5.68; _t(391) = -6.50, p < .001]; and were more creative [M_s = 5.21 vs. 4.95; _t(391) = 3.82, p < .001].
Structural Equation Modeling: Recall that SEM serves at least three masters in constructing the model. First, you want a model that is a good fit of the data, and many fit indices allow the researcher to assess the quality of fit. Second, you want your model to be as parsimonious as possible without the loss of valuable information. If you connect all significant links, you get a good fit, but the model will often be too complex to interpret. Finally, you want a model that has good face validity. It needs to make sense to the reader, even a reader who is not fluent in SEM.
The sample size (N = 392 couples) is entirely adequate based on the Bentler and Chow criterion of a 5:1 ratio of participants to free parameters [66]. With 23 free parameters (men) and 23 free parameters (women) both models have a 17:1 ratio.
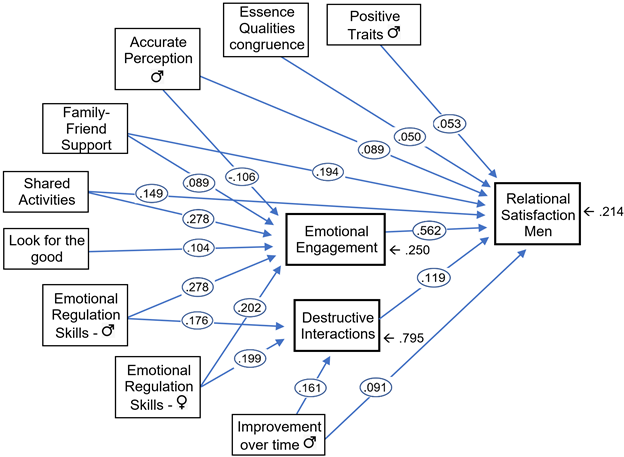
Relational Satisfaction for men. For the men’s model, Fit indices include: c2 (13, N = 392) = 14.106, p = .37, The Root Mean Square Error of Approximation (RMSEA) was .015; the 90% CI ranged from 0 to .05. The Comparative Fit Index (CFI) was .999. All predictors are allowed to covary. These values indicate an excellent model fit [67].
The Model for men employs three dependent variables and 11 predictors. The primary dependent variable is men’s Relational Satisfaction. The other two dependent variables are Emotional Engagement and the Destructive Interactions which are also predictors of RSmen.
Predictors of the Destructive Interactions (reduction of) include women’s Emotional Regulation Skills (β = .20), men’s Emotional Regulation Skills (β = .18), and Improvement over Time (β = .16).
Predictors of Emotional Engagement include the couple’s Active Engagement (β = .28), men’s Emotional-Regulation Skills (β = .28), women’s Emotional-Regulation Skills (β = .20), Accuracy of Perception (β = -.11), Looking for the Good in one’s partner (β = .10), and Influence of Family and Friends (β = .09).
Predictors of men’s Relational Satisfaction include Emotional Engagement (β = .56), The Influence of Family and Friends (β = .18), the couple’s Active Engagement (β = .15), the (lack of) Destructive Interactions (β = .12), Accuracy of Perception (β = .08), Improvement over Time (β = .07), Personal Traits (β = .05), Congruence of Essence Qualities (β = .05). These predictors accounted for 78.6% of variance explained in men’s Relational Satisfaction. Figure 1 includes the Structural Model for men.
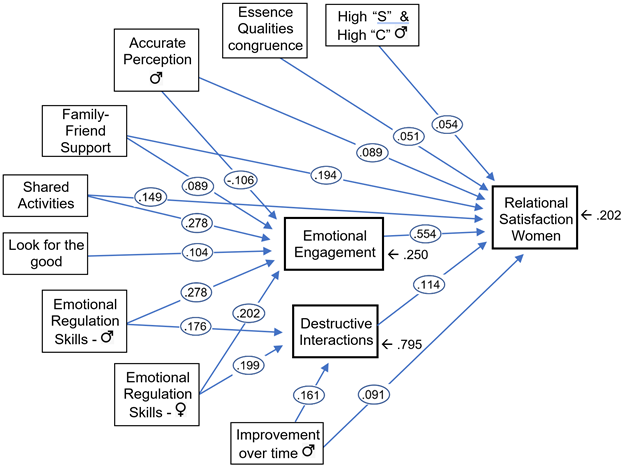
Relational Satisfaction for women. For the women’s model, Fit indices include: c2 (13, N = 392) = 17.569, p = .17, The Root Mean Square Error of Approximation (RMSEA) was .030; the 90% CI ranged from 0 to .06. The Comparative Fit Index (CFI) was .996. These values indicate an excellent model fit.
The Model for women also employs three dependent variables and 11 predictors. The primary dependent variable is women’s Relational Satisfaction. The other two dependent variables are Emotional Engagement and the Destructive Interactions which are also predictors of RS women.
Predictors of the Destructive Interactions include women’s Emotional Regulation Skills (β = .20), men’s Emotional Regulation Skills (β = .18), and men’s Improvement Over Time (β = .16).
Predictors of Emotional Engagement include the couple’s Shared activities (β = .28), men’s Emotional-Regulation Skills (β = .28), women’s Emotional-Regulation Skills (β = .20), Accuracy of Perception (β = -.11), Looking for the Good in one’s partner (β = .10), and Influence of Family and Friends (β = .09).
Predictors of women’s Relational Satisfaction include Emotional Engagement (β = .55), The Influence of Family and Friends (β = .19), the couple’s Active Engagement (β = .15), fewer Destructive Interactions (β = .11), Accuracy of Perception (β = .09), Improvement over Time (β = .09), High S and C for men (β = .05), and Congruence of Essence Qualities (β = .05). These predictors accounted for 79.8% of variance explained in women’s Relational Satisfaction. Figure 2 includes the Structural Model for women.
Comparison of the two models. The two models are extraordinary in their similarity. The predictors of Emotional Engagement and the Destructive Interactions (both gender- neutral variables) are identical. Predictors of Relational satisfaction are almost identical with differences in Beta weights no greater than .02. The only difference was that traits was a modest (but significant) predictor of Men’s relational satisfaction whereas men being high in “S” and “C’ on the DISC was a modest predictor for women.
Discussion
We provide a sequence for the order in which items will be discussed. We begin with perhaps the most notable result from the study, that is, the extraordinary amount of variance explained in relational satisfaction for both men and women and the intuitive clarity of the structural model. The following topics will then be discussed in the order indicated: (a) Emotional Engagement and factors that predict, (b) the impact of Emotional Regulation, (c) Destructive Interactions and expansion on the concept of attunement, (d) Improvement over Time, (h) the impact of Family and Friends, (i) the influence of Accuracy of Perception, (j) compatibility as measured by congruence between partners on essence qualities and temperament, (k) gender differences, (l) final thoughts and conclusion.
Effect size and clarity of the structural model. The sheer magnitude of the variance explained in models for both men and women is unprecedented. It is common for R2 values when predicting marital satisfaction to range from .20 to .50 from a more limited set of predictors. In both regressions and the structural models 78.6% of variance in relational satisfaction was explained by predictors for men and 79.8% was explained for women.
The inclusion of many factors, rather than adding complexity, resulted in a highly intuitive structural model with an exceptionally good fit of the data. Typically, as the number of variables in a structural model increase (whether predictor or criterion) the clarity often becomes compromised. As researchers add, for instance, correlations between residuals and other links to improve the fit, it typically increases the complexity of the model. We experienced just the opposite;
the fit of the model is good and the intuitive logic of the model provides excellent face validity. For instance, the predictors of Emotional Engagement (the greatest single predictor of relational satisfaction) provides clarity as to what factors feed and maintain Emotional Engagement. Even new and rarely used variables clearly contribute. For instance, improvement over time is a significant predictor in mens’ and women’ structural models of both Emotional Regulation and Relational Satisfaction. There is also an intuitive clarity to the predictors of Destructive Interactions, the third of the dependent variables in the model.
Emotional Engagement and Factors that predict. Emotion is variable. The only constant about feelings is that they change. In-love couples are intensely emotionally engaged, but following the “in love” phase, the euphoretic emotions wane and engagement becomes less intense. The present study shows Emotional Engagement to be the greatest single predictor of relational satisfaction for both men and women (βs = .55 and .56) with beta values that dwarf those of all other predictors. But emotions change and along with them, emotional engagement. What are the factors that keep positive emotional engagement alive and vibrant? The findings of this study created some clarity. Emotional Engagement has multiple predictors, and, perhaps the most interesting number in the structural model is the residual for Emotional Engagement: .25. This means that 25% of the variance in Emotional Engagement is unexplained, but it also means that 75% of the variance in Emotional Engagement is explained by predictors. So which variables contribute to that 75% explained? The greatest single predictor of Emotional Engagement was activities (stimulating exchange of ideas, dates, shared projects, shared traditions, and shared passionate goals). These represent actions the couple can choose to do in order to keep the flame burning (thus strengthening the emotional bond). Equal in magnitude (referenced earlier) is emotional regulation skills for men, and, slightly lower but still robust is emotional regulation skills for women. If a couple do things together and practice emotional regulation in interactions with each other, emotional engagement remains vibrant and positive. The other three predictors include: accuracy of perceiving your partner—attunement comes to mind; the support of family and friends, and actively looking for the good in your partner.
Emotional regulation. Another factor is the clarity in which the major players enact their role. Emotional Engagement dominates the field as a predictor of relational satisfaction. However, emotional regulation skills play almost as large a role. Emotional Regulation Skills for men predicts both enhancement of Emotional Engagement (β = .28) and reduction of Destructive Interactions (β = .18). Likewise, emotional regulation skills for women enhances Emotional Engagement (β = .20) and reduces Destructive Interactions (β = .20). The skill at emotional regulation appears to be the causative agent in creating harmony between partners (emotional engagement) while reducing its opposite, destructive interactions. But it is not just any emotional engagement that is desirable, as destructive interactions may also be intensely emotional.
Destructive interactions. Couples who are frequently involved in bickering and argument are intensely emotionally engaged, but it doesn’t predict satisfaction. The emotional engagement, spoken of earlier, needs to be in harmony (or attunement) between members of the couple. The destructive interactions are the opposite; Emotionally engaged, yes, but creating disharmony in the relationship. Consider Gottman’s four horsemen: One criticizes and the partner is defensive. In time, the criticism becomes globalized into contempt and the weary partner sinks into a depressed silence (stonewalling or distancing). Often couples who fight do so because they want the attunement to be restored. The most common complaint that marital therapists hear is that members of the couple don’t feel heard or understood. Attunement cannot take place until a couple shares this understanding that they seek.
The word “attunement” has arisen several times in this discussion. Let’s take a closer look. In academic works, the word was used initially to describe the desirable interaction between a mother and her infant [68]. But, just like attachment theory, attunement has increasingly infiltrated the study of couples’ relationships. John Gottman’s book (2012) The Science of Trust: Emotional Attunement for Couples places the concept of attunement at the center of his discussion. In this study it is the encouragement of positive emotional engagement through shared activities and the emotional regulation skills that keep interactions harmonious. The emotional regulation skills also holds at bay the destructive interactions that works to undo a couples’ attunement. And this is a dynamic process. Notice that in the structural model the impact of improvement over time. Improvement over time (β = .16) ranks right up with mans emotional regulation skills (β = .20) and the womans emotional regulation skills (β = .18) as one of the three primary factors that reduce destructive interactions.
Improvement over time. While many studies have explored how marriages change over time (cited earlier) this project is the first to attempt to quantify that concept and to measure its impact on Couple Relational Satisfaction. As you recall, the measure involved many variables, in fact it included all 30 valanced variables in the study except the indicators of the primary dependent variable, Relational Satisfaction. Authors had their own doubts about how well participants could remember how they related as a couple on these interactions during the first year of their marriage. As
mentioned earlier, any retrospective research is fraught with multiple challenges.
More than analysis, however, anecdotal comments by a few participants was elucidating. The general consensus was something along the lines of “it was amazing how clearly we were able to remember specifics from that first year of our marriage.” Add to that the robust impact of improvement over time on the two primary dependent variables. Correlations between improvement over time and RS for both men or women ranged from .44 to .48. Further, Improvement over Time significantly predicted reduction of Destructive interactions (β = .16) and improvement of Relational satisfaction (β = .09).
The impact of family and friends. We cited an article earlier (George, Saugh, et al., under review) that focuses entirely on the impact of family and friends on relational satisfaction of couples. In the structural model created in that study, the support and encouragement of family and friends was the single greatest predictor (of all friendship-related variables) of couple relational satisfaction, with betas of .42 for women and .31 for men.
In the present study bivariate correlations between the impact of (a) support of family, and (b) support of friends on relational satisfaction ranged from .39 to .52. In the structural models, the support of family and friends predicted greater Emotional Engagement (β = .09) and greater relational satisfaction (β = .19). The values (rounded off) were identical for both men and women.
Accuracy of perception. The accuracy of perception composite involved even more variables than Improvement over Time. Recall that the measure was (the mean of) the sum of the absolute values of the subjects’ self rating minus the partners’ rating of the subject. This variable included not only the valanced variables used for improvement over time, but also the essence qualities and the temperament measures.
Bivariate correlations showed great promise as the four possible effects (man’s Accuracy on man’s RS and woman’s RS; woman’s accuracy on the man’s RS and the woman’s RS) ranged from .50 to .54. In regressions the effect was diminished as the unique impact of accuracy on relational satisfaction is measured. The woman’s accuracy dropped entirely out of the picture, but the man’s accuracy made the cut predicting his wife’s relational satisfaction (β = -.08) and his own (β = -.09). In the structural models the impact of the mans accuracy of perception on Emotional Engagement (not Relational Satisfaction) yielded a beta of -.11 in both models. We spoke of attunement earlier and accuracy of perception is a required element for attunement to thrive in a relationship.
Compatibility and congruence of essence qualities. The personal similarity correlation (PSC) for the essence qualities of men and women provides a reasonable measure of compatibility. If the couple share many essences the PSC will be high suggesting greater compatibility. Bivariate correlations were not so robust as for Improvement over Time or Accuracy of Perception, but were still substantial. The enhancement of compatibility on relational satisfaction for both men and women was r = .34, p < .001. In regressions and the structural models, compatibility was a significant predictor of both men’s and women’s relational satisfaction (β = .05). Although not robust, compatibility appears to play its unique role in the marital puzzle.
Gender differences. Gender differences were consistent with gender stereotypes and are supported by research. All values listed are significant at p < .001 level; Cohen d values range from .26 to .42.
Men were found to be more likely to overreact, to be critical, to shut down during a difficult conversation, and were more defensive. Women were found to be neater, more nurturing and supportive, more spiritual, more likely to cherish family and family events, and were more creative. A good deal of research support many of these gender differences. John Gottman particularly points out that men are more poorly equipped to handle emotional discord than women. Present results are consistent with Gottman’s theory [13].
Conclusion
Prior discussion has identified the greatest takeaways of the present study: The extraordinary size and diversity of the sample; the unprecedented amount of variance explained for Relational Satisfaction and Emotional Engagement; the robust impact of Emotional Engagement on Relational satisfaction; the impact of Emotional Regulation at enhancing Emotional Engagement and reducing Destructive interaction; the centrality of specific actions at enhancing both Emotional Regulation and Relational Satisfaction; the influence of Destructive Interactions and factors that reduced their presence in the marriage; the benefit of the Support of Family and Friends, the influence of Accuracy of Perception at encouraging attunement between couples, and the small but important contribution of looking for the good, positive traits and compatibility [69, 70, 71].
An unexpected discovery was that 75% of variance in Emotional Engagement was predicted by six composite independent variables. The number could be easily missed and the factors that feed Emotional Engagement was not an original objective of the study. In light of the power of the influence of Emotional Engagement on Relational
Satisfaction, future studies might explore in greater detail how to keep that Emotional Engagement alive. Also, the contrast between Emotional Engagement (75% of variance explained) and Destructive Interactions (only 21% of variance explained), suggest that it might be instructive to explore which additional factors reduce the incidence of those destructive interactions.
And finally, the results of the study have solid application to the entire field of couples counseling. The study allows both therapist and client to pin-point challenges or strengths of the relationships by considering the different components of the present study. In fact, as the authors were working on the article we more than once commented that, with the array of factors considered, that it felt like we were writing a manual on marital success.
References
-
Clyde TL, Wikle JS, Hawkins AJ, James SL (2020) The effects of premarital education promotion policies on US divorce rates. Psychology Public Policy and Law 26(1): 105-120.
-
Taylor SE, Peplau LA, Sears DO (2000) Social psychology. Pearson.
-
Szinovacz ME, Egley LC (1995) Comparing one-partner and couple data on sensitive marital behaviors: The case of marital violence. Journal of Marriage and the Family 57(4): 995-1010.
-
George DM, Mallory P (2021) IBM SPSS Statistics 27, Step by Step. Routledge pp: 418.
-
Johnson SM (2019) Attachment theory in practice: Emotionally focused therapy (EFT) with individuals, couples, and families. Journal of Sex & Marital Therapy 46(7): 717-719.
-
Bowlby J (1988) A secure base: Parent-child development and healthy human development. NY: Basic Books, New York.
-
Mikulincer M, Shaver PR (2007) Attachment in adulthood: Structure, dynamics, and change. New York, NY: Guilford Press pp: 690.
-
Doss BD, Roddy MK, Wiebe SA, Johnson SM (2021) A review of the research during 2010–2019 on evidence‐ based treatments for couple relationship distress. Journal of marital and family therapy 48(1); 283-306.
-
Wiebe SA, Johnson SM, Moser MB, Dalgleish TL, Tasca GA (2016) Predicting follow-up outcomes in emotionally focused couple therapy: The role of change in trust, relationship-specific attachment, and emotional engagement. Journal of Marital and Family Therapy 43(2): 213-226.
-
Wiebe SA, Johnson SM, Lafontaine M, Moser MB, Dalgleish T, et al. (2016) Two-year follow-up outcomes in emotionally focused couple therapy: An investigation of relationship satisfaction and attachment trajectories. Journal of Marital and Family Therapy 43(2): 227-244.
-
Kennedy N, Johnson SM. Wiebe S, Willett J, Tasca G (2018) Conversations for connection: An outcome assessment of the Hold-Me-Tight Relationship-Education program, and recommendations for improving future research methodology in relationship education. Journal of Marriage and Family Therapy 45(3): 431-446.
-
Lavner JA, Karney BR, Bradbury TN (2016) Does couples’ communication predict marital satisfaction, or does marital satisfaction predict communication?. Journal of Marriage and Family, 78(3): 680-694.
-
Gottman JM, Joan D (2002) The relationship cure. New York: Random House, Psychology pp: 336.
-
Gottman JM, Nan S (2015) The seven principles of making marriage work. New York: Random House pp: 320.
-
Utz S, Beukeboom CJ (2011) The role of social network sites in romantic relationships. Journal of Computer- Mediated Communication 16(4): 511-527.
-
Watson D, Hubbard B, Wiese D (2000) General traits of personality and affectivity as predictors of satisfaction in intimate relationships: Evidence from Self- and Partner- ratings. Journal of Personality 68(3): 413-449.
-
Wenzel A, Graff Dolezal J Macho M, Brendle JR (2003) Communication and social skills in socially anxious and non-anxious individuals in the context of romantic relationships. Research & Therapy 43(4): 505-519.
-
Flora J, Segrin C (1999) Social skills are associated with satisfaction in close relationships. Psychological Reports 84(3): 803-804.
-
Villa MB, Del Prette ZAP (2013) Marital satisfaction: the role of social skills of husbands and Wives. Paideia 23(3): 379-387.
-
Klosterman M (2012) Self-esteem and relationship perception. Ursidae 2(2): 97-103.
-
Erol RY, Orth, U (2013) Actor and partner effects of self- esteem on relationship satisfaction and the mediating role of secure attachment between the partners. Journal of Research in Personality 47(1): 26-35.
-
Anderson CA, Deuser WE, DeNeve K (1995) Hot temperatures, hostile aggression. Personality and Social Psychology Bulletin 21: 434-448.
-
Lovibond SH Lovibond PF (1995) Manual for the depression anxiety stress scales 2nd (Edn.) Psychology Foundation.
-
George DM, Saugh D, Ridderhof S, Unger E, Snyder M (under review). Influence of Outside Friendships on Relational Satisfaction for Dating and Married Couples. Journal of Marriage and the Family.
-
Serovich J, Price S (1994) In-law relationships: a role theory perspective. International Journal of Sociology of the Family 24(1): 127-146.
-
Recze C, Liu H, Umberson D (2010) Just the two of us? How parents influence adult children’s marital quality. Journal of Marriage & the Family 72(5): 1205-1219.
-
Oruch TL, Bauermeister JA, Brown E, McKinley BD (2013) Early family ties and marital stability over 16 years: The context of race and gender. Family Relations 62(2): 255-268.
-
Connolly J, Johnson AM (1996) Adolescents’ romantic relationships and the structure and quality of their close interpersonal ties. Personal Relationships 3(2): 185- 195.
-
Bryant CM, Conger RD, Donnellan MB (2004) The big five and enduring marriages. The Journal of Research in Personality 38: 481-504.
-
Felmlee DH (2001) No couple is an island: A social network perspective on dyadic stability. Social Forces 79(4): 1259-1287.
-
Parks M, Stan C, Eggert L (1983) Romantic involvement and social network involvement. Social Psychology Quarterly 46(2): 116-131.
-
Walsh CO (2016) How you and I become we: Examining partner, family, and friend incorporation in romantic relationships. Dissertation Abstracts International 76.
-
Felmlee D, Sprecher S (2000) Relationships and social psychology: Intersections and future paths. Social Psychology Quarterly 63(4): 365-376.
-
Reissman C, Aron A, Bergen MR (1993) Shared activities and marital satisfaction: Causal direction and self- expansion versus boredom. Journal of Social and Personal Relationships 10(2): 243-254.
-
Kaplan M, Maddux JE (2002) Goals and marital satisfaction: Perceived support for personal goals and collective efficacy for collective goals. Journal of Social and clinical Psychology 21(2): 157-164.
-
Reimnitz SJ, Rauer AJ (2022) Mutual enjoyment in older couples’ conversations and its links to marital satisfaction. Personal Relationships.
-
Bailey J, Kerley S, Kibelstis T (2012) A brief marital satisfaction screening tool for use in primary care medicine. Family Med 44(2): 105-109.
-
Parker-Pope T (2008) Reinventing Date Night for Long- Married Couples. New York Times.
-
Fiese BH, Tomcho TJ (2001) Finding meaning in religious practices: The relation between religious holiday rituals and marital satisfaction. Journal of family psychology 15(4): 597-609.
-
Fiese BH, Hooker KA, Kotary L, Schwagler J (1993) Family rituals in the early stages of parenthood. Journal of Marriage and the Family 55(3): 633-642.
-
Campos JJ, Walle EA, Dahl A, Main A (2011) Reconceptualizing emotion regulation. Emotion review 3(1): 26-35.
-
Bloch L, Haase CM, Levenson RW (2014) Emotion regulation predicts marital satisfaction: More than a wives’ tale. Emotion 14(1) 130-144.
-
Damankeshan A, Sheikhoslami R (2019) Emotional regulation and marital satisfaction: the mediating role of anger rumination. Quarterly Journal of Women and Society 10(38): 1-18.
-
Shahid H, & Kazmi SF (2016) Role of emotional regulation in marital satisfaction. International Journal for Social Studies 2(4): 47-60.
-
Mazzuca S, Kafetsios K, Livi S, Presaghi F (2019) Emotion regulation and satisfaction in long-term marital relationships: The role of emotional contagion. Journal of Social and Personal Relationships 36(9): 2880-2895.
-
George DM, George EE (2011) The Compatibility Code. Englewood, CO: Hugo House.
-
George DM, Wisdom A, Linrud A, Hall S, Ballais M, et al. (2020) The Influence of Self-and Partner-Enhancement, Perceptual Congruence and Personal Identity on Relational Satisfaction among Married Couples, Dating Couples and Same-Sex Roommate Dyads. In Interpersonal Relationships.
-
Erikson EH (1968) Identity, Youth and Crisis, New York: Norton.
-
Linville PW (1985) Self-complexity and affective extremity: Don’t put all of your eggs in one cognitive basked. Social Cognition 3: 94-120.
-
Tucker JS, Anders SL (1999) Attachment style, interpersonal perception accuracy, and relationship satisfaction in dating couples. Personality and Social Psychology Bulletin 25(4): 403-412.
-
Solomon BC, Vazire S (2014) You are so beautiful . . . to me: seeing beyond biases and achieving accuracy in romantic relationships. Journal of Personality and Social Psychology 107(3): 516-528.
-
Stuckert R (1963) Role perception and marital satisfaction. Marital and Family Living 24: 415-419.
-
Neff LA, Karney BR (2002) Judgments of a relationship partner: Specific accuracy but. global enhancement. Journal of Personality 70(6): 1079-1112.
-
Karney BR (2015) Why marriages change over time. In: Mikulincer PRM, Simpson SJA, et al. (Eds.), APA handbook of personality and social psychology, 3: PP: 557-579.
-
Karney BR, Bradbury TN (1995) The longitudinal course of marital quality and stability: A review of theory, methods, and research. Psychological bulletin 118(1): 3-34.
-
Sprecher S (1999) I love you more today than yesterday: Romantic partners perceptions of changes in love and related affect over time. Journal of Personality and Social Psychology 76(1): 46-53.
-
Montgomery BM (1993) Relationship Maintenance versus Relationship Change: A Dialectical Dilemma. Journal of Social and Personal Relationships 10(2): 205- 223.
-
Mundfrom DJ, Shaw DG, Ke TL (2005) Minimum sample size recommendations for conducting factor analyses. International journal of testing 5(2): 159-168.
-
George DM, Wisdom A (2016) A measure of marital satisfaction. Unpublished manuscript.
-
Luo S, Klohnen EC (2005) Assortative mating and marital quality in newlyweds: A couple-centered approach. Journal of Personality and Social Psychology 88(2): 304- 326.
-
Luo S, Chen H, Yue G, Guangjian Z, Zhaoyang R, wt al. (2008) Predicting marital satisfaction from self, partner, and couple characteristics: is it me, you, or us. Journal of Personality 76(5): 1231-1265.
-
George D, Luo S, Webb J, Pugh J, Martinez A, et al. (2015) Couple similarity on stimulus characteristics and marital satisfaction. Personality and Individual Differences 86: 126-131.
-
Taylor SE, Brown JD (1988) Illusion and well- being: a social psychological perspective on mental health. Psychological bulletin 103(2): 193-210.
-
Moffitt TE, Caspi A, Taylor A, Kokaua J, Milne BJ, et al. (2010) How common are common mental disorders? Evidence that lifetime prevalence rates are doubled by prospective versus retrospective ascertainment. Psychological medicine 40(6): 899-909.
-
Solhan MB, Trull TJ, Jahng S, Wood PK (2009) Clinical assessment of affective instability: comparing EMA indices, questionnaire reports, and retrospective recall. Psychological assessment 21(3): 425-436.
-
Bentler P, Chow C (1987) Practical issues in multivariate analysis. Sociological Methods and Research 16: 78-117.
-
Hu LT, Bentler PM (1999) Cutoff criteria for fit indexes in covariance structure analysis: Conventional criteria versus new alternatives. Structural equation modeling: a multidisciplinary journal 6(1): 1-55.
-
Haft WL, Slade A (1989) Affect attunement and maternal attachment: A pilot study. Infant mental health journal 10(3): 157-172.
-
Gottman JM (2011) The science of trust: emotional attunement for couples. American Psychological Association.
-
Johnson SM (2004_)_ The practice of emotionally focused couple therapy: Creating connection. New York NY: Brunner-Routledge: 332.
-
Troy A (2000) Determining the factors of intimate- relationship satisfaction: interpersonal communication, sexual communication, and communication affect. Colgate University Journal of the Sciences 32: 221-230.
- Occupational Stress and Mental Health Outcomes Among Police Officers: A Mini Review
- The Experience of Counterproductive Leadership on Mental Health and Impact on Retention in U.S. Marines: A Phenomenological Study
- Nomophobia in the Digital Age: A Study on College and University Students
- Emotional Regulation in Children with Autism and Learning Disabilities
- Antisemitism on American College Campuses and Its Impact on Jewish Students
- Exploring the Role of Empathy in the Associations of Family Functioning and Purpose in Life with Attitude towards Abortion among Undergraduates: A Moderation Analysis