Hydrodynamic Analysis of Oscillating Water Column Using CFD Code
Oscillating water Column (OWC) methods for power extraction from the oceans and sea waves have been actively investigated for quite a number of years but there is still much work to do in this promising area of wet renewable energy source. In the past, most of the OWC installations have been shore based, thus; a move toward the use of near and off-shore buoys is taken into consideration. Thereby the extension of the predictive capabilities to cover these installations is highly desirable. Hence, the use of commercial Computational Fluid Dynamics (CFD) codes for this type of application is relatively novel and offers great modelling promises. Therefore, the paper presentation of hydrodynamic analysis of OWC using CFD code is a way forward in analyzing the effectiveness of OWC for power generation. The CFD simulation code has the proficiency in the prediction of hydrodynamics analysis results in the OWC device. Thus, it is used to generate pneumatic pressure results, air flow velocities and volume fraction results at different vent diameters. A summarized result confirms 0.8m vent diameter opening of OWC construction for effective power production. Also, a wave height ratio of 0.238 with 1.7m water depth yields a maximum hydrodynamic efficiency of 45.57%. This is an indication that water depth is one of the controlling factors for the production of high magnitude of wave which is an influencing characteristics of the turbine efficiency of the OWC device. Therefore, the consideration of offshore OWC at a reasonable water depth in the nearby seas and oceans will generate effective power supply to support a nation’s power grid for proficient consumers.
Introduction
Energy has been the bedrock for techno-industrial development globally. Hence, researching into its sources will never cease. This has been the reason for the scouting of environmentally friendly energy source devoid of any kind of health and environment challenging issues. So the introduction of OWC wet energy source is significantly imperative at this time. The OWC energy source is a sea or ocean based energy source capable for the generation of electric power. Its effectiveness and workability is immeasurable as the sector is set to compete with its rivals and the conventional source of energy. This affirms an established European Union (EU) report which attests that the global energy demand could be fulfilled with just 0.1% availability of ocean energy if fully harnessed [1, 2]. Thus, a scholarly research unveils that this energy source may contribute significantly to the electrical energy supply of countries with coasts facing the ocean [3, 4]. Conversely, a similar investigative research upholds that 100% total energy consumption will be achieved if renewable energy sources like the solar, wind and wave respectively is exploit extensively [5, 6, 7].
In this respect a wide variety of technologies has been proposed, studied, and tested in some cases at full size in real ocean conditions. Therefore, it has become necessary to overview analytically the hydrodynamics of OWC in this paper presentation. However, the evaluation of related studies shows that the hydrodynamic performance of OWC depends on the interactions with ocean waves [8]. Thus, different scholarly research performs a hydrodynamic model test and numerical analyses on an inclined OWC wave energy converter. According to their separate findings, results from their practical evaluation affirms an improved economic viability of the OWC wave energy converter. This has enhanced an improvement in the applicability of the sloppy breakwater section thus reducing cost in construction of chamber structure [9, 10, 11, 12].
Consequently, reviewed literature reveals the application and incorporation of complex physical effects such as non-linearity and Power Take-Off (PTO) damping in the analysis of OWC hydrodynamics for more reliable performance of the device. It has been systematically proven the effect of the OWC efficiency by magnitude and amplitude as non-linearity is introduced to the device. This tends to decrease with increase in wave height; reversely it increases with decrease in wave height [13, 14, 15, 16]. This is a clear attestation for this application that even smaller wave height is capable of reliable performance from the device. However, a comparative analytical study to determine a 2D OWC efficiency between a linear and nonlinear PTO confirms maximum efficiency of the device with strongly nonlinearity PTO which is slightly inferior to linear PTO [17].
In bid of analyzing the performance of OWC device different methods has been carried out by different researchers. The adoption of a finite element model to study scattered waves around single and multiple OWC wave energy conversion devices based on linear wave theory has been carried out in a research study. It was found that the presence of neighboring OWCs has a significant influence on the power captured and the efficiency of the individual devices [17]. Another is a numerical study of the hydrodynamic performance of a shoreline-mounted OWC device using boundary element method. This assures the topographical effects of the bottom slope and water depth on the OWC device [18]. The application of a commercial 3D linear boundary element method was carried out on a model in a study to fix the dynamic chamber pressure of OWC [19].
Meanwhile, in this paper presentation of hydrodynamic analysis of OWC using CFD code is aimed to improve on the performance of the OWC device as recently studied by different scholars. All these are targets to ensure effective performance of the device for better productivity, reliability and sustainability for better electric power supply.
OWC Modelling and Simulation
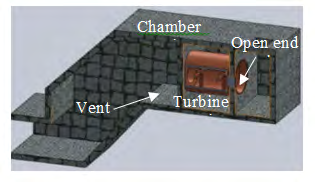
The modelling process of the OWC was carried out in solidworks modelling software which has friendly interface as shown in Figure 1 and it is imported to the CFD simulation code. This code enables the numerical analysis of the device and is initiated by the geometry creation, meshing, simulation setup. The process is followed up with physics constraint initiation parameters, materials selection, model theory specification, boundary loading conditions, solution initialization and calculation.
The meshing process was carried out where components were divided into smaller elements for the application of uniformly distributed loads. It produces the most appropriate mesh for accurate, efficient and multiphysics solutions. Hence, the model of the OWC chamber yields the following discretization meshing output of 302603 tetrahedral cells. This is with zones 1 – 3 having 595589 triangular interior faces, 672 triangular velocity-inlet faces and 18202 triangular wall faces respectively. Others are zones 6 – 8 with 42 triangular pressure-outlet faces, 318 triangular pressure- outlet faces, and 55440 nodes flags respectively.
Conversely, with the completion of the meshing process a simulation setup was conducted where all the mathematical models for computational analysis are assigned to a domain in the CFD fluent solver. Meanwhile, this simulation physics is governed by fluid flow equations which analyze the hydrodynamics of the working fluid within the OWC device. Equations 1 – 6 are capable of estimating the turbulent-flow behaviour, the turbulent dissipation rate, momentum, energy and partial mass balance, as well as Shear Stress Transport (SST) [19].
Turbulent Kinetic Energy (k) Equation:
( ) i t k b M k i j k j $$ + \frac {\delta \rho k u _ {i}}{\delta x _ {i}} + \frac {\delta}{\delta x _ {j}} \left[ \left(\mu + \frac {\mu_ {t}}{\sigma_ {k}}\right) \frac {\delta k}{\delta x _ {j}} \right] + P _ {k} + P _ {b} + P \in - Y _ {M} + S $$ k ku k P P P Y S t x x x δ ρ δρ µ δ δ µ δ δ δ σ δ (1) Turbulent Dissipation rate (∈) equation:
( ) ( ) $$ \frac {\left(\rho \in\right)}{\partial t} + \frac {\delta \rho \in u _ {i}}{\delta x _ {i}} + \frac {\delta}{\delta x _ {j}} \left[ \left(\mu + \frac {\mu_ {t}}{\sigma_ {\epsilon}}\right) \frac {\delta \in}{\delta x _ {j}} \right] + C _ {1 \in} \frac {\in}{k} \left(P _ {k} + C _ {3 \in} P _ {b}\right) - \rho C _ {2 \in} \frac {\in^ {2}}{k} + S $$ δ ρ δρ µ δ δ µ ρ δ δ δ σ δ ∈ ∈ ∈ ∈ ∈
2 u C P C P C S t x x x k k
1 3 2 i t k b i j j (2)
Momentum Equation:
$$ \frac {\delta \rho U}{\delta t} + \nabla \bullet \rho U U = - \nabla \rho + \nabla \tau + \rho g \tag {3} $$ Species Mass Fraction Equation:
$$ \frac {\delta \rho m _ {i}}{\delta t} + \nabla \bullet \rho U m _ {i} = \nabla \bullet D _ {e} \rho \nabla m _ {i} - R _ {i} \tag {4} $$ SST Model Equations:
( ) ( ) * j k t j j j $$ + \frac {\delta \rho u _ {j} k}{\delta x _ {j}} = \frac {\delta}{\delta x _ {j}} \left[ \left(\mu + \sigma_ {k} \mu_ {t}\right) \frac {\delta k}{\delta x _ {j}} \right] + \rho - \rho $$ u k k k k t x x x δρ δ ρ δ δ µ σ µ ρ β ρω δ δ δ δ (5) ( ) ( ) 2 j d u k k P t x k x x x x ω δ ρ ω δ ρω ρσ γω δ ρ δω δ δω βρω µ σ δ δ δ ω δ ω δ δ $$ \frac {1}{\lambda} + \frac {\delta \left(\rho u _ {j} \omega\right)}{\delta x _ {j}} = \frac {\gamma \omega}{k} P - \beta \rho \omega^ {2} + \frac {\delta}{\delta x _ {j}} \left[ \left(\mu + \sigma_ {\omega} \frac {\rho k}{\omega}\right) \frac {\delta \omega}{\delta x _ {j}} \right] + \frac {\rho \sigma_ {d}}{\omega} \cdot \frac {\delta k}{\delta x _ {j}} \cdot \frac {\delta}{\delta x _ {j}} $$ j j j j j (6)
Presentation of Results
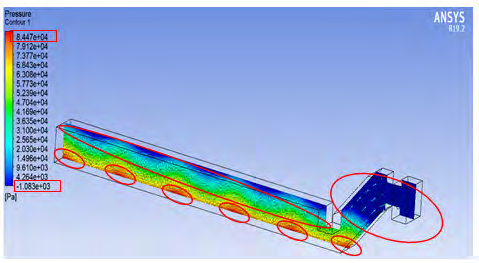
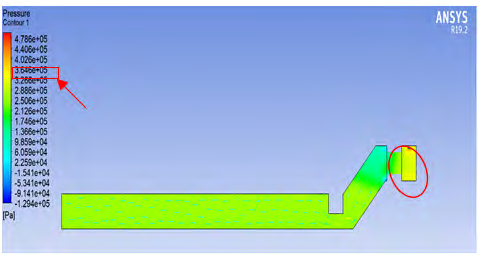
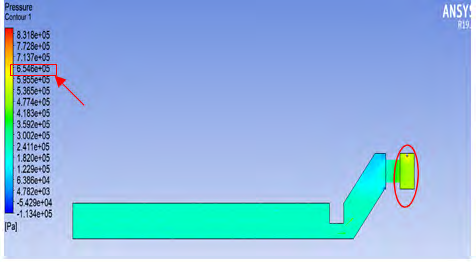
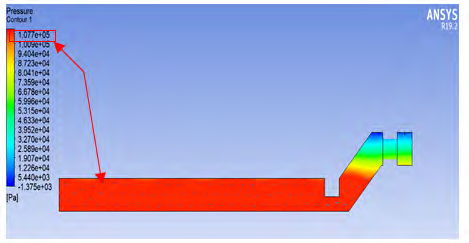
The following are presentation of pneumatic pressure results according to variation of vent opening. It shows the pressure distribution across the interior of the OWC chamber with varying open chamber vent diameter (OCVD) undergoing 2 – phase (water-liquid and air) volume of fluid (VOF) flow process simulation. They are shown in Figures 2-5.
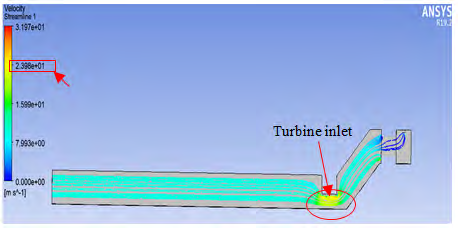
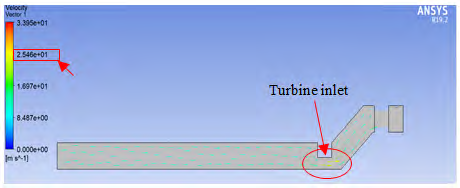
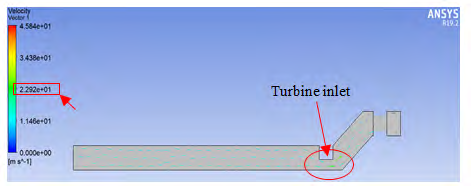
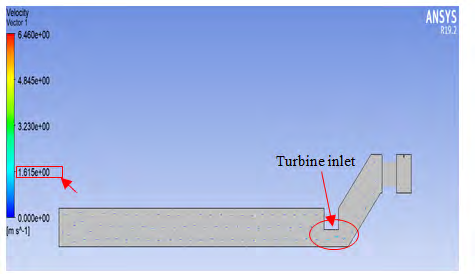
Other results are contour plots of air flow velocity across the OWC chamber with variation in the vent opening. They are presented in Figures 6-9.
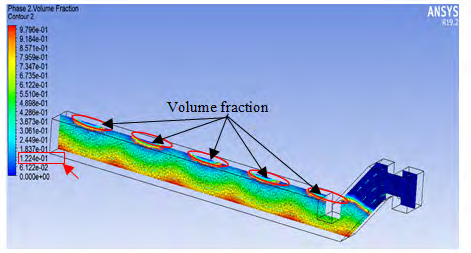
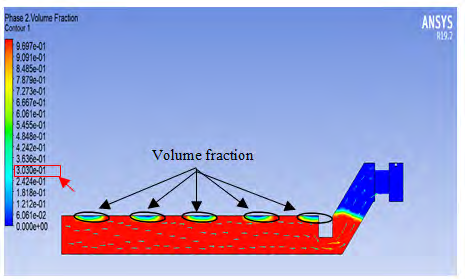
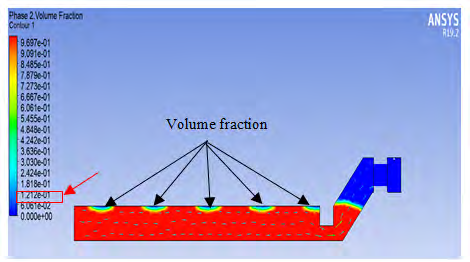
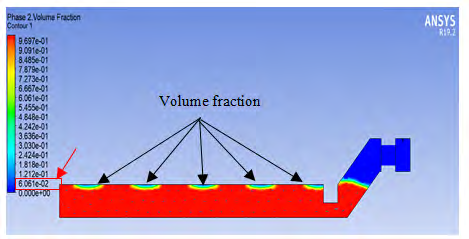
Similarly, the results for volume fraction for both water- liquid and air phases are equally presented for discussion. The solver is made to simulate and computes the ratio of the equation of continuity for the phases and the density of the material operating on it. Figures 10-13 are the contour plots for the volume fraction.
Other simulation results automatically generated are presented in the graphical plots to analyze the performance variations as some desirable parameters of the wave are considered. These illustrations are shown in Figures 14 & 15.
Discussion of Results
The contour plots of the pneumatic pressure is an ideal illustration of the hydrodynamics and the physics behind the fluid motion in the OWC device. The pressure distribution across the interior section of the device varies with respect to the variation of the vent diameter of the chamber. In the simulation results, the highest and lowest pneumatic pressure of 8.447E+4Pa and −1.083E+3Pa is observed at the bottom (red spots) and top (blue spots) respectively of the chamber in figure 2 with a vent diameter of 1m. Apparently, in the simulation results of figures 3 – 5 a similar scenario is observed with the highest values of pneumatic pressure of 3.646E+5Pa, 6.546E+5Pa and 1.077E+5Pa respectively. Conversely, the simulation of the estimated air velocity at the inlet of the turbine is observed to be 23.98, , 22.92 and 1.615 respectively at the vent opening is programmed to decrease from 1m to 0.2m. However, the investigation of the volume fraction at the different vent diameters from the simulation results are also observed as 0.1224, 0.3030, 0.1212, and 0.06061 for 1.0m, 0.8m, 0.6m and 0.2m respectively.
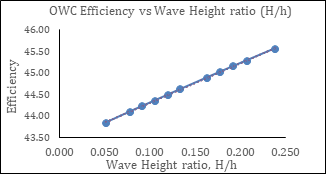
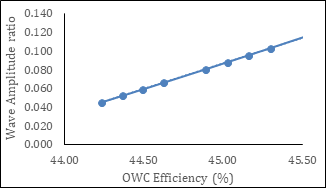
The effect of wave height variation on the OWC efficiency is shown in figure 14. It indicates that the hydrodynamic efficiency of the OWC is in relationship with the wave height. Records attests that the highest and lowest hydrodynamic efficiencies of 45.57% and 43.85% are observed at wave height ratios of 0.238 and 0.051 respectively. This affirms that the hydrodynamic efficiency increases with corresponding rise in wave height. Similarly, figure 15 is a demonstration of the ratio of wave amplitude against efficiency of the OWC. It shows that there is progressive increase in wave amplification with the increase of relative wave height which is an influencing factor to the component efficiency. Also, to achieve the maximum height of a wave is depending upon the depth of water bodies. Consequently, in the graphical plot a maximum wave amplitude of 0.119 gives the highest OWC efficiency of 45.57% at water depth of 1.7m. Meanwhile, an amplitude of 0.026 gives 43.85% at a water depth of 0.4m. It therefore attests that OWC efficiency increases with increase in amplitude. This is a clear indication that the wave amplification is an important criterion in deciding the OWC geometry.
Conclusion
In the above discussion a common sequence of results is identified. At the pneumatic pressure, result of vent diameter 0.6m is confirmed as the highest, whereas result for vent diameter 0.8m for air velocity and volume fraction are observed as the highest likewise. Therefore, the summary of the contour plots of results attests that 0.8m vent diameter opening for the construction of OWC device will produce efficient output. In another test of result indicate wave height as a controlling factor to the hydrodynamic efficiency of OWC. Thus, the turbine efficiency is a direct dependent to the hydrodynamic efficiency. Hence, it could be concluded that the wave height is directly proportional to the turbine efficiency in an OWC device. Analyzed results attest that the effect of the wave period in the determination of its amplitude can vary the OWC efficiency. However, the depth of water where an OWC device is constructed is a serious consideration mostly for site selection analysis.
References
-
Garrido AJ, Otaola E, Garrido I, Lekube J, Maseda FJ, et al. (2015) Mathematical Modeling of Oscillating Water Columns Wave-Structure Interaction in Ocean Energy Plants. Mathematical Problems in Engineering 727982.
-
European Commission (2016) Ocean Energy Forum.
-
Barstow S, Mork G, Mollison D, Cruz J (2008) The Wave Energy Resource. In: Cruz J (Ed.), Ocean Wave Energy. Green Energy and Technology (Virtual Series), Springer, Berlin, Heidelberg, pp: 93-132.
-
Falcao AFO, Henriques JCC (2016) Oscillating-water- column wave energy converters and air turbines: A review. Renewable Energy 85: 1391-1424.
-
Madaci M, Kerdoun D (2017) Conception Optimization and CFD Structure Study of Wind Firm Power Generation Based on OWC-WTGS Combined Generation System with Battery Storage Element. International Journal of Renewable Energy Research (IJRER) 7(2): 496-512.
-
Jacobson MZ, Delucchi MA (2011) Providing all global energy with wind, water, and solar power, part I: technologies, energy resources, quantities and areas of infrastructure, and materials. Energy Policy 39(3): 1154-1169.
-
Jacobson MZ, Delucchi MA (2011) Providing all global energy with wind, water, and solar power, part II: reliability, system and transmission costs, and policies. Energy Policy 39(3): 1170-1190.
-
Ahmed E, Alan F, Gregor M, Zhi L (2017) Numerical Hydrodynamic Analysis of an Offshore Stationary floating OWC – Wave Energy Converter using CFD. International Journal of Naval Architecture and Ocean Engineering 9(1): 77-99.
-
Iino M, Miyazaki T, Segawa H, Iida M (2016) Effect of inclination on oscillation characteristics of an oscillating water column wave energy converter. Ocean Eng 116: 226-235.
-
Kim JS, Nam BW, Kim KH, Hong K (2017) Cross-sectional shape design of OWC chamber of wave energy converter e to breakwater. Proceedings of the 8th East-Asian Workshop for Marine Environment and Energy, Jeju, Korea.
-
Park S, Nam BW, Kim KH, Hong K (2018) A Parametric Study on Oscillating Water Column Wave Energy Converter Applicable to Breakwater. Journal of Advanced Research in Ocean Engineering 4(2): 66-77.
-
Jeong Seok K, Nam BW, Kyong Hwan K, Sewan P, Seung HS, et al. (2020) A Numerical Study on Hydrodynamic Performance of an Inclined OWC Wave Energy Converter with Nonlinear Turbine-Chamber Interaction based on 3D Potential Flow. Journal of Marine science and Engineering 8(3): 176.
-
Koo W, Kim MH (2010) Nonlinear time-domain simulation of a land-based oscillating water column. Journal of Waterway, Port Coast. Ocean Engineering 136: 276-285.
-
Ning DZ, Shi J, Zou QP, Teng B (2015) Investigation of hydrodynamic performance of an OWC (oscillating water column) wave energy device using a fully nonlinear HOBEM (higher-order boundary element method). Energy 83: 177-188.
-
Kim SJ, Koo W, Kim MH (2015) Nonlinear Time-Domain NWT Simulations for two types of a Backward Bent Duct Buoy (BBDB) compared with 2D Wave-Tank Experiments. Ocean Engineering 108: 584-593.
-
Wang RQ, Ning DZ, Zhang CW, Zou QP, Liu Z (2018) Nonlinear and Viscous Effects on the Hydrodynamic Performance of a Fixed OWC Wave Energy Converter. Ocean Engineering 131: 42-50.
-
Nader JR, Zhu SP, Cooper P, Stappenbelt B (2012) A Finite- Element Study of the Efficiency of Oscillating Water Column Wave Energy Converters. Ocean Engineering 43: 72-81.
-
Konispoliatis DN, Mavrakos SA (2016) Hydrodynamic Analysis of an Array of Interacting Free Floating Oscillating Water Colum Devices. Ocean Engineering 111: 179-197.
-
Delaure YMC, Lewis A (2003) 3D Hydrodynamic Modeling of Fixed Oscillating Wave Power Plant by a Boundary Element Methods. Ocean Engineering 30(3): 309-330.
- Sense, Gravity, Parity & Chirality in Mathematical Physics
- Quantum Lattice Simulations PHYSICS: Microcircuit Particle Formation and Observable Macroscopic Irreversible Time - A Discrete Lagrangian with Cellular Automata Framework
- Quantum Biology from Biomacromolecule to Cell, and Central Dogma Described by Quantum Theory
- Focus, Agility, Speed and Technology (FAST) for Sustainability and Growth
- Square Root Metric Geometry and Pati-Salam Model in Curved Space-Time
- A Simple System Demonstrating the Mpemba Effect in Classical Mechanics