Research on Rolling Bearing Fault Feature Extraction and Diagnosis Method Based on Image Processing
In economic construction, there are many large and important machinery and equipment. Some equipment will continue to work in a harsh working environment, so many and various failures will occur. Rolling bearings are one of the widely used parts in rotating machinery. They are generally composed of inner ring, outer ring, rolling element and holding. The frame is composed of four parts, the failure of the bearing is particularly important, and its safe operation has a vital impact on the entire equipment, Feature extraction is the key link in the subsequent identification of fault types, Although feature extraction in the time domain and frequency domain is effective, it is also necessary to find new feature extraction methods in new areas. On the basis of the snowflake image obtained by using the principle of SDP(Symmetrized Dot Pattern), a method for extracting fault features of rolling bearings based on image processing is proposed, and the snowflake standard map for different working conditions is constructed. The number of snowflake images under different working conditions is different. The binary matrix of the test image is compared with it, and then classified and identified. Finally, the algorithm is validated, and the ideal result is obtained to verify its rationality and effectiveness.
Introduction
Rolling bearings have a unique characteristic, that is, their life cycle is not very stable, the use of the cycle is very discrete. In view of this characteristic, in the actual working condition, it is easy to happen: when the bearing is used be- yond the life of nearly scrap, but still can work normally, while some bearings in far from the life of a large number of failure will appear. Therefore, when the staff check the rolling bearings according to the design life: on the one hand, the bearings that reach the life time but still work will be dismantled and scrapped, and cannot be maximized; on the other hand, the bearings that fail before the life time will not be found and will not be dismantled and disposed of until the time of regular inspection and maintenance, which will reduce the efficiency of the equipment and the usage rate. This situation can reduce the efficiency and utilization of the equipment and even lead to the breakdown and scrapping of the machine before the safety inspection and maintenance is carried out. Therefore, it is particularly important to monitor and diagnose the working condition of rolling bearings and real-time faults in order to further the smooth operation of machines and equipment, which is of great importance to the project.
Rolling bearing use cycle is not stable, life dispersion is very large. If carried out in accordance with the design life cycle for repair and maintenance is unreasonable and inaccurate. When rolling bearings are used, the working condition should be monitored and fault diagnosis should be carried out anytime and anywhere, so that the accuracy and precision of the equipment work can be improved, and the failure rate of the machine and equipment can be reduced, and the rolling bearings can be made to play their maximum use value, and the failure in the project can be alarmed in advance to reduce the failure rate and improve the economic efficiency. Rolling bearings can be used from the state, for example, the bearing surface work wear, as well as bearings by other objects were contacted by scratches to analyze which is a situation that leads to failure. When the staff sees that the bearing has been destroyed, they can only roughly make a judgment by the degree of damage and the location of the damage, the time of damage and other conditions. But this situation cannot find out the cause of the failure from the root, and is not conducive to the subsequent judgment of its characteristics. Therefore, to prevent the occurrence of machine failure, both the judgment of the rolling bearing after the occurrence of the failure, but also the real- time monitoring of the vibration signal of the rolling bearing in operation, in its operation before the occurrence of failure to make certain speculation, from the root to reduce the frequency of its failure, to prevent the occurrence of major failures in the later stages, to reduce its economic, personnel unnecessary losses. However, the analysis and processing of early fault vibration signals still have certain limitations. In the face of complex and diverse signals, some common diagnostic methods will simplify the processing of its signal data, but it will lead to the loss of some data signals, making its accuracy greatly reduced, and then cannot reflect the real fault early information effectively, which is the imperfection of fault diagnosis processing, and will also be the future trend of fault diagnosis analysis and processing. Previously, many good ideas were proposed on the road of fault feature extraction and analysis, such as non-time series and so on. However, there are still some shortcomings, which cannot fully consider the changes of the signal. When industrialization came in the last century, people gradually improved their research on fault handling. Various methods and techniques were gradually upgraded and developed. Due to the development of sensors, control information theory, computer technology, etc., this technology is now gradually integrated, independent and mature. When these devices fail, various changes in parameters are generated. The changes in these data parameters are analyzed to initially determine the abnormality of the device. The current common diagnostic techniques in engineering include vibration and noise tests, temperature tests, etc. Nowadays, we can use advanced sensors to obtain data information of the device to perform a series of analysis, judgment, and comparison. With the maturity of various data technology methods, the combination of fault feature extraction and fault diagnosis with current science and technology will lead to a diversified, remote and multi-dimensional path in the future.
Rolling bearing is as one of the very important parts in rotating machinery, its normal operation is related to the production safety of the whole industrial industry, and it determines the information of mechanical equipment failure by studying the relationship between the physical phenomena (vibration, image, etc.) and the mechanical state accompanying the operation of machinery, so it builds the link between the internal state and the external physical data research. Therefore, it is extremely important for the detection and fault diagnosis of rolling bearings, and the whole fault diagnosis process can be roughly divided into four parts: processing of signals, fault feature extraction and fault analysis and classification. In this paper Gu Y [1], we study the feature extraction and fault diagnoses of rolling bearings based on image processing, and use the data from the failure test bench of Western Reserve University as the object of its research processing. This lab simulates the normal operation, inner ring, outer ring and rolling element failure and damage of bearings. Time and frequency domain images of the signals are first produced, and fault features are extracted and diagnosed based on the images. Fault feature extraction is the most important and difficult part of the whole process. The good or bad fault feature extraction will directly affect or even influence the accuracy and correctness of rolling bearing fault diagnosis and classification. Many scholars have made deep exploration on rolling bearing fault feature extraction. For example, by wavelet transform, empirical modal decomposition (EMD) [2], power spectrum [3], etc. The differences of vibration signals in normal and fault states of bearings were compared, and these methods [4, 5] were studied, improved to a deeper extent, and then realized for fault feature extraction and fault diagnosis, and these methods achieved relatively good results. In the literature Liu C, Wu Y, Zhen C [6], literature Lv Y [7], Zhao H [8], scholars proposed a SDP (Symmetric Dot Pattern) method for feature extraction and diagnosis of images. The SDP formula converts a one-dimensional discrete sequence into a mirror-symmetric snowflake pattern in the polar coordinate system, and then reflects the change of signal by the difference between the patterns to make the fault figurative, clear and explicit. In this article Li H [4], based on the snowflake images of four working conditions (normal, inner ring, rolling , outer ring) generated by the SDP method, in order to make the fault characteristics of rolling bearings better extracted, the images were grayed out, median filtered, binarized to obtain a set of snowflake images of four working conditions, and then the above process was repeated to reconstruct and process the images, and a total of 10 snowflake images of each group of working conditions were obtained. Then, the images are rebuilt and processed, and a total of 10 snowflake images are obtained for each group of conditions, and then averaged to obtain a set of standard and stable snowflake images for the four conditions. The features contained in the images are extracted through processing, and finally the test images are randomly compared with them in order to identify the types of rolling bearing failures and to test and verify the effectiveness of the rolling bearing failure mode procedure [9].
Scheme Design
Time Domain Frequency Domain Analysis
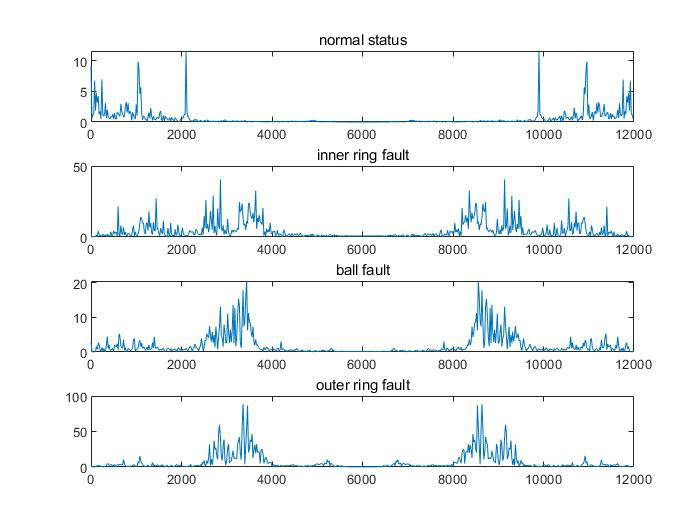
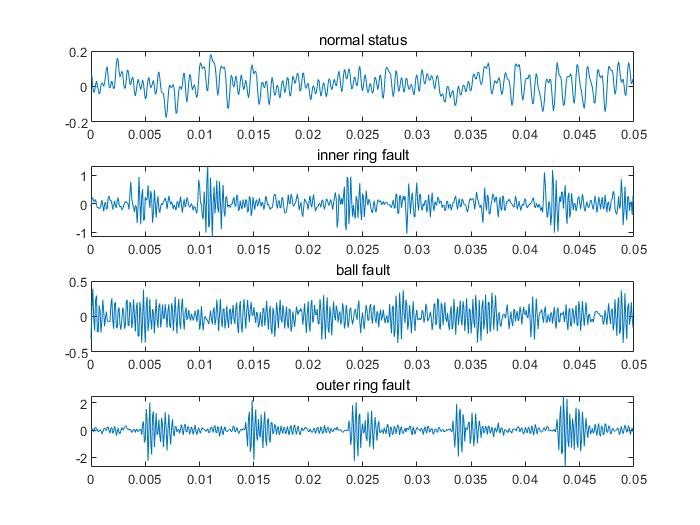
When the rolling bearing operates normally, the vibration is mainly due to the inherent vibration of the bearing; and when the rolling bearing fails, there will be some problems. On the one hand, it is the violent vibration caused by the bearing damage, on the other hand, it is the vibration that the bearing itself has but other bearings vibrate together to cause its own generated vibration spoke value to become larger. The vibration of rolling bearings will produce a large amount of information that we understand, and using some instruments to sample the bearings to collect and analyze the signals generated is the most effective way for us to understand the bearing failure. Bearing signal analysis is the use of time domain, frequency domain spectrum and time-frequency analysis and other technical means of vibration signal for feature transformation and parameter extraction. A number of scholars have previously found some relatively unique and ahead of their time methods in new areas. For example, on the basis of the research results of data analysis SDP (Symmetrized Dot Pattern) of getting the mirror symmetric image in polar coordinate system scholars proposed the method for image processing on the extraction of fault signal for the extraction of fault features of rolling bearings. The acquired data were processed in the time and frequency domains to obtain the images of four cases, which are shown in Figures 1 & 2.
Style files and templates provided here have been created to ensure that margin requirement is adequately met. If, for some reason, you are not able to use provided templates or style files, please observe the following margins and font settings strictly.
The Basic Principle of SDP Method
In the discrete data of vibration signal, the vibration amplitude of moment n is xn and the vibration amplitude of moment. The SDP formula, a symmetric image in the polar coordinate space ( ) ( ) ( ) , , p n n n γ θ ϕ is obtained. The schematic diagram of SDP (Symmetrized Dot Pattern) formula is shown in Figure 3.
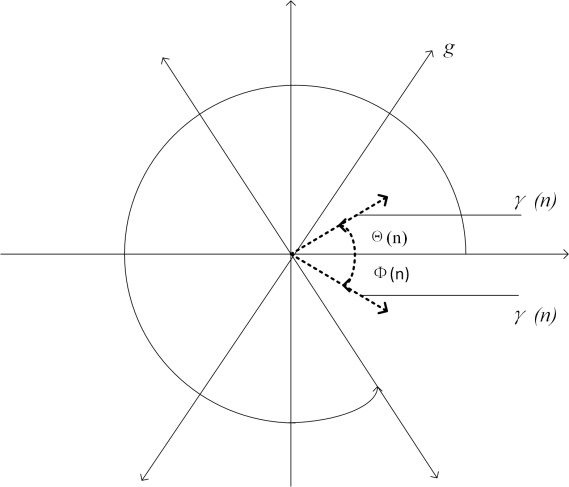
Unlike the time domain frequency domain analysis described above, the SDP can visualize the vibration signal as a mirror symmetric image, which is more obvious, more intuitive and simpler. The SDP equation is as follows.
max min ( ) nx x r n x x − = −
min (1) max min ( ) n l x x n g x x θ θ + − = + −
min (2) max min ( ) - n l x x n g x x θ θ − = −
+ min (3) In the above three equations, ( ) n γ represents the radius in the polar coordinate system; ( ) n θ represents the angle of rotation of the polar coordinates counterclockwise along the initial line; ( ) n ϕ while is the angle of rotation of the polar coordinates clockwise along the initial line. The specific calculation formula is shown above. In its calculation, min x in equation 1 is the minimum value in the discrete sequence of vibration signal; x_max is the maximum value in the discrete sequence of vibration signal; the vibration amplitude of moment n in equation 2 and equation 3 is _nx , the vibration amplitude of moment n l + is nx , g is the angle amplification factor, θ is the rotation angle of the mirror plane of symmetry, and l is the time interval of parameter.
Image Processing
Image processing is an important prerequisite for image feature extraction, and is also a key part of image feature extraction. The good or bad image processing is directly related to the accuracy of the subsequent image fault feature extraction and the correct rate of classification. In this paper, we gray scale the obtained image, then add pretzel noise and median filtering, and binarization and average the image to obtain the standard image for image feature extraction.
Image Grayscale: A picture is made up of multiple pixel dots, which are the smallest pixel units in a picture. The color of a pixel point is composed of three color matrices of RGB (RGB three matrices). Each picture formed is composed of 876×656 pixels, then we can understand that the picture is a large matrix com- posed of one by one. the image obtained by MATLAB is a color image, and RGB does not reflect the true morphological characteristics of the image, then we need to preprocess the image, and grayscale processing can be used as a preprocessing step of the image, grayscale processing is to this Grayscale processing is to manipulate the pixel point matrix, and grayscale processing is to assign equal values to the R matrix, G matrix, and B matrix in the pixel point matrix, and then the image is grayed out.
Median filtering: Pepper noise causes random black and white pixel dots on the image, using a noise caused by the intensity of the signal pulse and then also called impulse noise. In order to make the subsequent binarization processing image is affected, we add a noise density of 0.02 pretzel noise to the grayscale image after processing and then median filtering processing, so that the grayscale image is affected by the noise as little as possible, the so-called median filtering processing is based on an arrangement of pixel values in the neighborhood of a pixel, the median value of the pixel neighborhood The text adds a noise density of 0.02 pepper noise in order to make the image features better extracted, and the better means to deal with pepper noise is median filtering. After these two steps we get an image that facilitates better de-binarization and reduces the interference of other noises on this experiment.
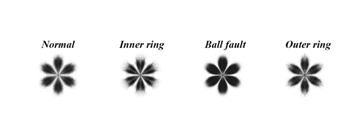
Binarization and Averaging: Binarization, which is to change the gray value of the pixels contained on the image to 0 or 255, will make the object you want to process show a clear black or white, before the binarization of the image, in order to make the effect better, appear black and white effect more prominent, using MAT- LAB we choose a certain threshold (0.603) for the appropriate binarization process. The binarization of the image is crucial for the next step of processing, it will make the image very simple, and reduce the unnecessary data on the image, reduce the workload and work time, and will not affect the overall image and the required local features, which is very convenient for feature extraction of image features. In or- der to keep the feature data we get as accurate as possible, the image in this paper is cropped and saved, and the image pixels obtained are (561×581). And when the binarization is over a work condition we got ten images, which were averaged, the so- called averaging, as mentioned in the above steps, the images are composed of a matrix of pixels, so we weighted its matrix averaging process. The images in a row are relatively stable, but not identical. However, each row is not nearly the same. Doing an averaging process in this way, we get the average images saved for the normal condition, the inner ring failure case, the rolling body failure case, and the inner ring failure case, as shown in Figure 4.
Extraction of Image Features
Feature recognition of images can be broadly classified into three categories. Feature statistics of color or grayscale, texture and edge features, and shape features. The ones we generate by using SDP are not the same in each working condition. So we can use the generated snowflake like images to extract features to distinguish the features of other working conditions. The image features are again very many parameters, image pixel area, perimeter, denseness, image pixel center of mass, etc.
In this paper, the features extracted are the number of pixels, and MATLAB is applied to extract the number of pixels of the binarized image objects. The number of pixels is extracted from 10 groups of standard image objects for four working conditions to obtain the pixel size range of the four working conditions. As shown in Table 1. It is easy to see that the number of pixels of the object of rolling body failure is the most, followed by the normal condition, the outer ring failure condition, and finally the inner ring failure. This pixel number can still reflect the difference of the fault visually, and also can make a good distinction between these several working conditions of the rolling bearing. This table can reflect that the normal condition pixel count range is concentrated in 138000∼152000, inner ring failure pixel count range is concentrated in 120000 130000, outer ring failure pixel count range is concentrated in 130000 137000,and rolling body failure pixel count range is concentrated in 157000∼179000.
| Group | Normal status | Inner ring fault | Ball fault | Outer ring fault |
|---|---|---|---|---|
| 1 | 142809 | 125265 | 172051 | 136556 |
| 2 | 143844 | 125784 | 167147 | 131174 |
| 3 | 144525 | 120872 | 178886 | 129767 |
| 4 | 147981 | 124920 | 157700 | 133997 |
| 5 | 138069 | 124928 | 169484 | 130625 |
| 6 | 147735 | 125017 | 167649 | 134613 |
| 7 | 152662 | 123811 | 170775 | 140369 |
| 8 | 151103 | 122984 | 170466 | 134204 |
| 9 | 137972 | 129887 | 165838 | 134012 |
| 10 | 142855 | 128049 | 172216 | 130249 |
Table 1: Number of pixels for four operating conditions of rolling bearings.
Fine Tuning
Data Source
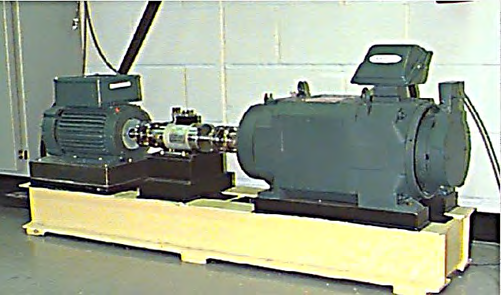
In this paper, the bearing fault vibration signal collected from the bearing fault test bench of Western Reserve University in the United States is selected as the basis for analysis. The structure of the test stand device is shown in Figure 5. The stand is mainly composed of a three-phase motor with an output power level of 1500 W, a torque sensor, a power test meter and an electronic controller and other components. It is connected to the fan by a coupling, which then drives the fan to continue running, and the magnitude of the simulated load is automatically adjusted by the coupling. Sensors that sense acceleration are installed above the bearings at the motor drive end of the test stand and at the fan end to collect vibration signals in the event of a fault. The bearings required for the test were deep groove ball bearings supplied by a company called SKF, the specifications of which are shown in Table 2. They mainly simulated four types of failures that can occur in rolling bearings and used an electric spark discharge system to simulate damage to them to generate the data we need.
| Diameter of Inner Ring | Diameter of Outer Ring | Thickness | Diameter of Rolling Element | Pitch Diameter |
|---|---|---|---|---|
| 25 mm | 52 mm | 15 mm | 7.94 mm | 39.04mm |
Table 2: 6205-2RS JEM SKF deep groove ball bearing specifications.
The three data from the motor drive side of the Western Reserve University test bench, the specific parameters are: vibration signal sampling frequency 12kHz, three- phase drive motor approximate speed 17500 r/min, failure diameter 0.1778mm, the vibration signal from the drive side was collected under the simulation of inner ring, outer ring, rolling body failure and normal operation. In order to construct a symmetrical snowflake image formed by SDP of the vibration signals of rolling bearings under four operating conditions, the data provided by the bench of the electrical engineering laboratory of Western Reserve University are selected in this paper. In this paper, the motor load of 2 hp, speed of 1750 r/min and sampling frequency of 12 kHz at the drive end are used, and the data (99.mat, 107.mat, 120. mat, 132.mat) of normal condition, inner ring failure, rolling element failure and outer ring failure (damage point placed at 6 o’clock direction) with a failure diameter of 0.1778 mm are selected respectively.
Fault Type Identification
In order to verify the correct rate of fault feature extraction and diagnosis based on image processing, this paper takes the motor speed of 1750r/min in the electrical engineering laboratory of Western Reserve University, the sampling frequency of the drive end is 12k, and the data of normal condition, inner ring fault, rolling body fault, outer ring fault (damage point placed at 6 o’clock direction) with the diameter of the fault point of 0.1778mm are selected respectively (99.mat, 107.mat, 120.mat, 132.mat) the first 6,000 data are divided into 10 groups equally, and the standard snowflake image is produced by pre-processing and other processes. And the test image will have the back of the 114000 data randomly selected from any one of the 6000 rows of the matrix as a test condition, in MATLAB with reshape command to produce a random number of columns to modify the dimension, to get a matrix of 600 rows and 10 columns. Then the symmetric mirror snowflake image in polar coordinate system is obtained by SDP formula, and then the standard image pixel matrix obtained by a series of grayscale processing, noise reduction processing, binarization processing, and averaging operation mentioned above is compared with it.
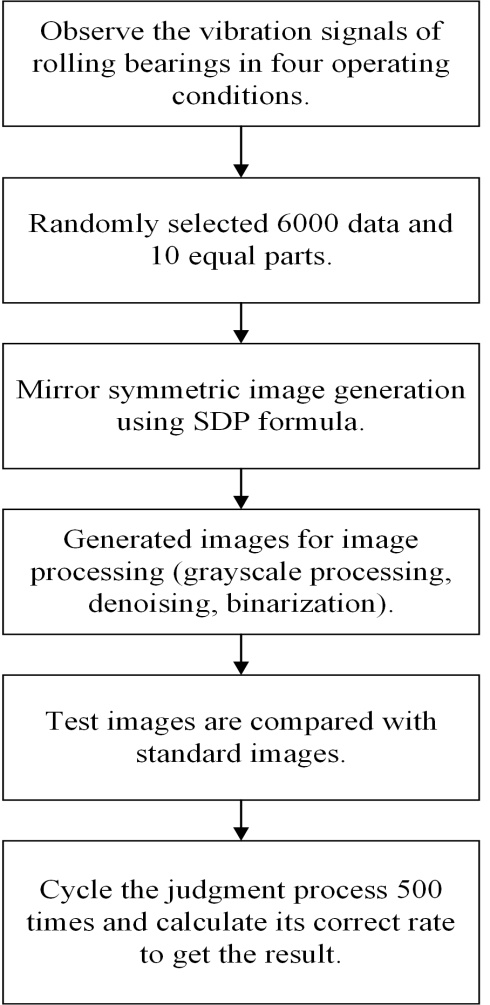
The generated test image and the standard image can be viewed as a large matrix, by taking each row and column of the pixel matrix of both and comparing the values with the matrix of the standard image to see if they are equal, the number of identical pixels is divided by the rows and columns of the matrix to get a degree of similarity, the test image and the four working conditions are discriminated by the image matrix to obtain four similarity values, so we process the obtained So we process the obtained value to take the maximum value, then we get which working condition is the closest, and then identify as this fault state. If the condition and the test condition are the same, it is correct. Otherwise, it is incorrectly identified. In this way, a process judgment is performed, and in order to ensure the correct ness, 500 pieces of data are taken for the same operation, and the same process is performed for the same operation as a set of test data. This is cycled 500 times as a set of test arrays, and this process is cycled 20 times to verify its average correctness. The process is shown below. The flow chart of the rolling bearing fault test discrimination is shown in Figure 6.
- Observe the vibration signals of rolling bearings in four operating conditions.
- Randomly selected 6000 data and 10 equal parts.
- Mirror symmetric image generation using SDP formula.
- Generated images for image processing (grayscale processing, denoising, binarization).
- Test images are compared with standard images.
- Cycle the judgment process 500 times and calculate its correct rate to get the result.
Test Results
The data for this test rolling bearing failure test is 20 groups, and each group contains 500 times. The large number of sample data makes the accuracy of the data guaranteed to avoid chance. Table 3 shows the correct rate for each of the 20 sets of data. There is not much difference between the data, and the correct rate is higher than 95%, reflecting the feasibility of this method. Averaging the correct rates yields an average correct rate of 98.56%.
| Group | Noun | Correct Rate |
|---|---|---|
| group 1 | 500 | 99.20% |
| group 2 | 500 | 98.80% |
| group 3 | 500 | 99.20% |
| group 4 | 500 | 97.60% |
| group 5 | 500 | 97.20% |
| group 6 | 500 | 99.60% |
| group 7 | 500 | 97.20% |
| group 8 | 500 | 99.60% |
| group 9 | 500 | 99.00% |
| group 10 | 500 | 98.60% |
| group 11 | 500 | 98.60% |
| group 12 | 500 | 99.40% |
| group 13 | 500 | 98.40% |
| group 14 | 500 | 98.80% |
| group 15 | 500 | 97.80% |
| group 16 | 500 | 97.60% |
| group 17 | 500 | 98.40% |
| group 18 | 500 | 99.40% |
| group 19 | 500 | 98.60% |
| group 20 | 500 | 98.20% |
| mean | 500 | 98.56% |
Table 3: Fault discrimination of 20 sets of data tested correctly.
Conclusion
From the above work, we get that image processing as rolling bearing fault feature extraction and classification discrimination is more concise and clear, after the steps of image grayscale processing, image noise reduction processing, image binarization processing, image homogenization processing resulting in the pixel points of the standard image and test data obtained from the test image pixel points to compare the difference, so as to identify is that kind of working condition, through the use of MATLAB written The test algorithm is used to test the feasibility of the comparison method of comparing the differences between the pixel points of the images. A large amount of sample data was used, divided into twenty groups to test the rate of this method, the above table we can easily see that the correct rate of image fault classification reached 98.56%, this correct rate fully reflects the feasibility of the method.
Acknowledgement: This work is supported by National Natural Science Foundation (NNSF) of China under Grant 00000000.
References
-
Gu Y, Zeng L, Qiu G (2020) Bearing fault diagnosis with varying conditions using angular domain resampling technology, SDP and DCNN. Measurement 156: 107616.
-
Sun Y, Li S, Wang X (2021) Bearing fault diagnosis based on EMD and improved Chebyshev distance in SDP image, Measurement 176: 109100.
-
Ren LH, Liu K, Zhang HY (2011) Progress on mechanical fault diagnosis based on image processing. Machine Design and Research 27(5): 21-24.
-
Li H, Wang W, Huang P, Li Q (2020) Fault diagnosis of rolling bearing using symmetrized dot pattern and density-based clustering, Measurement 152: 107293.
-
Guo J, Zhen D, Li H, Shi Z, Gu F, et al. (2019) Fault feature extraction for rolling element bearing diagnosis based on a multi-stage noise reduction method. Measurement 139: 226-235.
-
Liu C, Wu Y, Zhen C (2015) Fault diagnosis of rolling bearing based on variational mode decomposition and fuzzy c-means clustering, J Chin Electr Eng 35(13): 3358-3365.
-
Lv Y, Fang L, Zhang Q (2015) Research on Machinery Fault Diagnostics Based on Vibration Signal Analysis. Proceedings of the 2015 International Symposium on Material, Energy and Environment Engineering, China, pp: 580-583.
-
Zhao H, Zheng J, Xu J, Deng W (2019) Fault diagnosis method based on principal component analysis and broad learning system. IEEE Access 7: 99263-99272.
-
Fu D P, Zhai Y, Yu Q (2017) Research on Rolling bearing Fault diagnosis based on EMD and support Vector Machine. Machine Tools and Hydraulic Pressure 45(11): 184-187.
- Sense, Gravity, Parity & Chirality in Mathematical Physics
- Quantum Lattice Simulations PHYSICS: Microcircuit Particle Formation and Observable Macroscopic Irreversible Time - A Discrete Lagrangian with Cellular Automata Framework
- Quantum Biology from Biomacromolecule to Cell, and Central Dogma Described by Quantum Theory
- Focus, Agility, Speed and Technology (FAST) for Sustainability and Growth
- Square Root Metric Geometry and Pati-Salam Model in Curved Space-Time
- A Simple System Demonstrating the Mpemba Effect in Classical Mechanics