Inter Carbon Distance from Nearest Atom Reveal Presence of Various Functional Units in Proteins
Carbon plays an important role bio-molecular structure and function. Carbon distribution is responsible for bio-molecular association. This carbon distribution in proteins has been part of our activities in the last 15 years. It has been carried out from sequence to structure level. It required hydrogen atom added to the structure for analysis and all. Here the similar observations from carbon coordinates obtained from X-ray structure are reported. The carbon distance from nearest carbon is focus of this work. The distance is computed for a set of carbon atoms present in a particular spherical dia. The distances are grouped based on its values which are ranging from 2.1 to 3.1with group interval of 0.1. This distance distributed over different groups are analysed for presence of active site, order, disorder, carbon-rich and poor-carbon regions. The results are able to locate these sites as well as identify amino acids that need to be mutated for stability and function. The results are in agreement with other predictions obtained from sequence and all atom analysis. This distance distribution analysis gives guidance on how important the carbon distribution in these biological systems and to deal further with liveable material in the future to come globally or universally.
Introduction
Carbon seems to be playing an important role in biology and materials. Interestingly the newly identified carbon distribution is working out to be crucial for dealing of biochemical reactions [1, 2, 3]. One such a thorough understanding in biology is identified in proteins. Carbon value in proteins identified to be 0.3144 in global one [4, 5, 6, 7]. Whenever a protein having this fraction either in local or global structure is considered as stable, one accordingly any deviation considered as disorder [8, 9, 10]. Sometime this disorder helps in protein’s interactions with other macromolecules. This order and disorders in proteins can be identified using one dimensional sequence information and also from 3D structures. The 3D structures require being with hydrogen atoms attached to it. This is possible from NMR structures or otherwise X-ray structures added with hydrogen atoms computationally. These 3D structures yielded good results in predicting active sites, order, disordered, carbon-rich and poor-carbon regions. These structures require advanced technology to get the input parameters. Otherwise one cannot get this carbon fraction 0.3144 in protein’s 3D structures. Most often the 3D structures are obtained from X-ray crystallography which does not have hydrogen atoms. Having these difficulty and also observed to be the carbon-carbon distances are crucial in maintaining 3D structures, the current study focuses on how the carbon-carbon distances distributed all over the structures and how it vary from one locations to another. For example the distance distribution in active sites, carbon- rich or poor-carbon regions is analysed. Carbon optimised regions are expectedly form evenly distributed and particular carbon-carbon distance called optimum distance.
Methodology
Data
Optimum carbon protein is taken as super oxide dismutase (sod) on online one, 1DSW which contain Cu and Zn as well. This pdb one contains record for 153 amino acids.
Method
In order to find the carbon value in 3D structure of protein one, a PERL program called OPTCARd has been written that take the pdb structure of individual proteins and analyse for how the carbon distributed in a given Dia 16Å that are specified by the nearest carbon atom for each carbon one identified. During this analyse the nearest bonded one are neglected from consideration as only the non-bonded one are taken onto account. Any carbon atom that is distance more than 1.54 is taken into account. In fact it is 1.56 as some time bond elongation can take place by external factor. Actually the non-bonded one occurs between 2.1 and 3.1Å. Any deviation beyond these two values considered as unusual one where there is possible mutation for stability and all. Very often this value confine to 2.5-2.6Å. But it may fall in range 2.4-2.5Å. Here all values are counted for 2.1- 3.1 with interval of 0.1. Two separate accounting below 2.1 and exceeding 3.1 are analysed in the calculation. Values
Results and Discussion
accounting these fractions in each category are taken for further analysis and observation. Observations are further looked into COD, active one, carbon-rich or poor-carbon regions. Other parameter like number of carbon in each sphere is taken in the array for verification as to whether the centre of atoms is located near surface or in the interior of the protein. Here the center of atoms is taken to be alpha one but may be anything which are common in all amino acids that is to say O, C, N, HA etc. that and all found in the main chain of the protein. One comparison for different center atoms is done for variation in distribution. Side chain atoms are not considered as it varies from one another and observations cannot be generalised.
Value of carbon in protein one needs to be taken accurately to identify the defective part or domain one. In this value analysis it is considered here the carbon distribution in each amino acid center. Otherwise it is a detailed analysis on how close the carbon with one another fabricated for possible stability and function. As per analysis a center of atom is chosen from main chain and carbon atoms within the range of 16Å are taken for minimum distance verification. Minimum distance in the sense that closest non-bonded carbon atom to another one. Each carbon will have only one nearest atom. Let’s say there are 80 carbon atoms in a circle and there will be 80 minimum distance for distribution analysis.
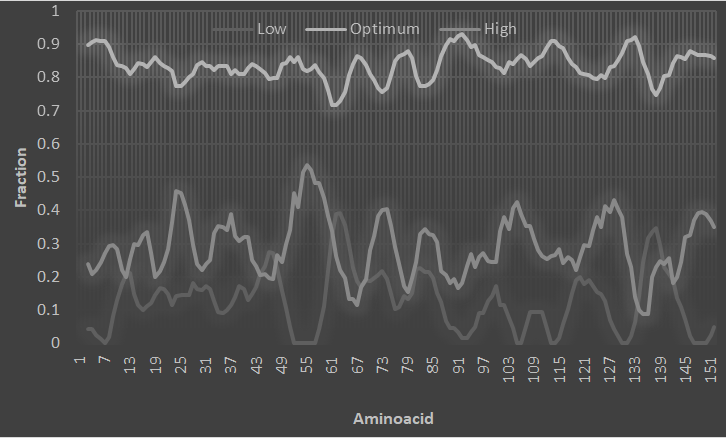
Carbon profile of protein one analysed in term of nearest carbon distance. It is analysed for several proteins. Observations are that the protein prefers to have minimum distance of carbon with one another near 2.5. Varying value is observed. Values vary from 2.1 to 3.1. But majority are observed between 2.4 and 2.6 (Figure 1). More than 80% of the distances are observed in this range. There are distances which are less than 2.1 and more than 3.1. These
are uncommon and observed to be defective one. Active sites are found out to be in domain one while the center of active one non-ICOD. So the active one mostly found near 2.5 with varying degrees at the centred. Otherwise the ICOD is found out to be near 2.5 whereas the carbon-rich regions are mostly found below 2.5. The poor-carbon regions managed to get sufficient number at 2.5 with significant numbers below 2.4. In these kinds of observations one can go on for possible mutations that lead to stability of the protein [11]. The higher end and lower values needs to be mutated leading to carbon values near 2.5. One can be analyse the active regions while in stability factor is considered. Active sites needed to be dealt separately for mutation whether going for stabilising the active site or activating further. Based on these observations one can go for active site finding from this carbon-carbon distance distribution.
This kind of analyses requires pdb structure with carbon coordinates only. That is structure need not have hydrogen atom. That is to say NMR structure not necessary. If there structure with hydrogen atom added to it well it helps further with other ICOD analyses which support these simple findings from carbon coordinates. Generally all these findings of active sites and ICODs can be achieved at sequence level. These also found using all atom 3D structure. Here it is reported with simple carbon coordinates alone. This way one can even identify single most amino acid contributing to instability or activity. The disease proteins involved based on carbon distribution [12, 13, 14] can be solved by this way. One such challenge is that the role of large hydrophobic residues in protein stability [15] is based on this carbon profile of interaction and also pattern recognition [16].
In order to identify any variation of distance distribution with respect to center of atom, it’s been tested with different center of atoms. Particularly variation of distance distribution with center of atoms CA and O are valuated. There is no significant change in distribution overall but mild variation at individual ranges.
Conclusion
The distance between carbon and a nearest carbon are analysed for a group of carbon atoms present in specified diameter. This nearest non-bonded distances is found maximum at 2.5Å. Any deviations from this value are found disordered regions. The disordered regions include carbon- rich and active regions. The analysis can also identify ICOD regions and amino acid sites for mutational study. Using this distance distribution analysis, one can identify active site, order, disorder, carbon-rich and poor-carbon regions. This analysis requires X-ray coordinates of carbon atoms alone.
References
-
Devprakash R, Akila K, Senthil R, Indupriya R, Meenal R, et al. (2021) Distribution statistics on carbon value points out good and bad portions of proteins: A viral sample in study. Challenges in disease and health research 6: 1-6.
-
Rajasekaran E, Indupriya R (2020) Nano level force in protein plays applications of maximum untold understanding of life form, Recent developments in engineering research. Book publisher international 1: 106-112.
-
Rajasekaran E (2018) Domains based in carbon dictate here the possible arrangement of all chemistry for biology. Int J Mol Biol-Open Access 3(5): 240-243.
-
Rajasekaran E, Vinobha CS, Vijayasarathy M, Senthil R, Sankarganesh P (2009) The nature of proteins, International association of computer science and information technology (IACSIT-SC), Singapore, pp: 464-465.
-
Rajasekaran E (2013) Scale for nature of hydrophobic interactions in proteins. J Proteomics Bio information 6(7): 31.
-
Rajasekaran E (2012) CARd: Carbon distribution analysis program for protein sequences. Bio information 8(11): 508-512.
-
Rajasekaran E, Akila K, Vijayasarathy M, Vinobha CS, Senthil R, et al. (2014) CARd-3D: Carbon distribution in 3D structure program for globular proteins. Bio information 10(3): 138-143.
-
Akila K, John SN, Rajasekaran E (2012) Study on carbon distribution at protein regions of disorder. Int J Biosci Biochem Bioinfo 2(2): 68-70.
-
Rajasekaran E, Akila K, Vijayasarathy M (2011) Allotment of carbon is responsible for disorders in proteins. Bio information 6(8): 291-292.
-
Akila K, Rajendran K, Rajasekaran E (2012) Carbon distribution to toxic effect of toxin proteins. Bio information 8(15): 720-721.
-
Rajasekaran E (2013) Carbon distribution in protein structure might influence thermo stability of modified form. J Adv Biotech 12(9): 9-10.
-
Jayaraj V, Senthil R, Selvaraj L, Rajasekaran E (2009) Computational studies on carbon distribution in enzymes involved in neural disorder. J Comput Intelli Bioinfo 2(1-2): 7-11.
-
Rajasekaran E, John SN, Vennila J (2012) Carbon distribution in protein local structure direct superoxide dismutase to disease way. J Proteins and Proteomics 3(2): 99-104.
-
Akila K, Balamurugan P and Rajasekaran E (2012) The nature of proteins in Influenza. Health 4(10): 991-994.
-
Jayaraj V, Suhanya R, Vijayasarathy M, Anandagopu P, Rajasekaran E (2009) Role of large hydrophobic residues in proteins. Bio information 3(9): 409-412.
-
Rajasekaran E, Vijayasarathy M, Senthil R (2009) Pattern recognition in proteins based on carbon content. J Comput Intelli Bioinfo 2(3): 99-102.
- Carbon Code for Analysis of Protein Stability in Protein Mutation
- Number of Contiguous Amino Acids in Nanon of 16A Diameter
- Identification of Hub Genes and Pathways in Cervical Cancer by Statistical and Bioinformatics Analysis
- Effect of Dietary Inclusion Levels of Moringa Olerifera Oil on the Growth Performance and Nutrient Retention of Broiler Starter Chicks
- Proteomics Loans in Kinetoplastids during the Last Decade
- “Identification of SARS-CoV-2 in Human Genome based on Protein Dynamics Conversion and Target Genes Marking via Bioinformatics Approaches”