Body Mass and Biochemical Indexes in Obese Children: Changes in Metabolic Syndrome Development
Biochemical indices in obese children for early metabolic syndrome (MS) diagnostics were analyzed. Prospective study enrolled control (n=32, -1.0≤BMI SD score ≤+1.0) and obese (n=40, BMI SD score>+2.0) groups of children (12 yr mean age). Obese children demonstrated enhanced total cholesterol, triglycerides, LDL, ALT, fasting insulin, HOMA-IR and elevated atherogenic index (AI). In most obese children, cardiovascular (40%) and hepatic (85%) disturbances were observed. Association of obesity with hepatic pathology was reflected in all examinees by correlations between BMI and ALT (r=0.511, p=0.001) and between BMI and ALT/AST ratio (r=0.638, p=0.001). AI increased in parallel with ALT/AST ratio elevation (r=0.436, р=0.006). Value of ALT/AST ratio in obese children group with signs of MS was 1.0 (0.5-1.6), exceeding value in control group (0.6; 0.3-1.1). To clarify ALT/AST ratio reference values as a manifestation of MS in obese children, an analysis of data from a larger number of patients is required. Control group demonstrated correlations between plasma coenzyme Q10 and total cholesterol (r=0.474, p=0.009) as well as between coenzyme Q10 and ALT (r=0.412, p=0.023) attesting to adequate lipoprotein antioxidant function and normal action of liver. In obese children, these relationships were distorted indicating advisability to prevent MS with membrane-stabilizing and/or antioxidant agents.
Introduction
In early 2000s, a certain ‘rejuvenation’ trend of some somatic diseases became especially apparent. At this, the growing negative roles are played by such factors as sedentary lifestyle, improper diet, and repeated stress resulting in dysfunction of cardiovascular, endocrine, respiratory, and digestive systems accompanied with psychological alterations. One of manifestations of this trend is increasing rate of obesity among children and adolescents [1]. In 2016, WHO estimated the worldwide number of overweight/obese children and adolescents aging 5 to 19 yr by about 340 million, while in 2019, there were about 1
million obese children at the age less than 5 yr [2, 3]. The gold standard to diagnosticate obesity in children is based on BMI and percentile charts [4]. Importantly, the overweight and obesity can be combined with metabolic syndrome (MS). There is a common view that in the pediatric population, MS is diagnosed by abdominal obesity accompanied with two of three other clinical symptoms: 1) hyperinsulinemia and/ or disturbed glucose metabolism and/or insulin resistance, 2) arterial hypertension, and 3) dyslipidemia. A special attention should be focused on obese youngsters with MS symptoms in relation to 1) increased risk of the development of type 2 diabetes mellitus and cardiovascular diseases even at the early age and 2) a high probability of future chronic diseases at mature age. The early MS detection in children employing typical parameters of carbohydrate and lipid metabolism as biochemical markers needs additional criteria to take the timely preventive or therapeutic measures prior to the development of obesity-related diseases [4, 5].
The aim of the study was to study the relationship of individual biochemical parameters with body mass index (BMI) in obese children to assess the possibility of early diagnosis of metabolic syndrome (MS).
Results
Anthropometric and Biochemical Indices
Table 1 shows the anthropometric and biochemical indices in control and experimental groups. In each group, the examined indices did not differ significantly between boys and girls, so the examinees were compared irrespectively of sex. In control group, all indices corresponded to the age related norm [6, 7].
| Index | Obesity group (n=40) | Control group (n=32) | ||||
|---|---|---|---|---|---|---|
| Total group | males (n=25) | females (n=15) | Total group | males (n=12) | females (n=20) | |
| Age, yr | 12 ± 2 12 (8-15) | 12 ± 2 12 (8-15) | 12.± 2 12.0 (8- 15) | 11.8 ± 2 12 (7- 15) | 12 ± 2 12 (8-15) | 11.6 ± 2.1 12 (7-15) |
| Body weight, kg | 77 ± 25* 72 (42- 134) * | 73 ± 24 65 (42- 118) | 82 ± 27 77(46- 134) | 39 ± 11 38 (22- 66) | 39 ± 14 35 (22- 66) | 39 ± 9 39 (23-60) |
| BMI | 30 ± 5* 29 (22- 45) | 29 ± 3 29 (22- 33) | 32 ± 6 30 (25- 45) | 18±3 18(14-26) | 18±3 17 (14-24) | 18±3 18(15-26) |
| BMI SD score | 2.9 ± 0.8* 3.0 (1.0-4.6) | 2.8 ± 0.8 3.0 (1.0-4.6) | 3.0 ± 0.9 3.0 (1.0- 4.4) | 0.1 ± 1.1 0.2 (-2.4-2.2) | -0.1 ± 1.4 –0.1(- 2.4-2.2) | 0.2 ± 0.9 0.2 (-1.8 -1.6) |
| CoQ10, µg/ml | 0.7 ± 0.3 0.8 (0.2-1.8) | 0.8 ± 0.4 0.8 (0.3-1.8) | 0.7 ± 0.3 0.7 (0.5- 1.3) | 0.7 ± 0.3 0.7 (0.2-1.5) | 0.6 ± 0.3 0.6 (0.2- 1.1) | 0.7 ± 0.3 0.6 (0.3- 1.5) |
| Fasting glucose, mM | 5.0 ± 0.7 5.0 (3.4-6.1) | 5.0 ± 0.7 5.1 (3.4-6.1) | 4.9 ± 0.5 4.8 (4.1- 5.9) | 5.2 ± 0.5 5.2 (4.0-6.0) | 5.2 ± 0.5 5.2 (4.2- 5.8) | 5.1 ± 0.5 5.2 (4.0- 6.0) |
| Total cholesterol, mM | 4.6 ± 1.02 4.35 (2.9-7.6) | 4.8 ± 1.1 4.4(2.9- 7.6) | 4.3 ± 0.6 4,2(3.4- 5.0) | 4.3 ± 0.5 4.3(3.5- 5.6) | 4.2 ± 0.4 4.1 (3.8- 5.0) | 4.4 ± 0.6 4.4 (3.5- 5.6) |
| HDL, mM | 1.4 ± 0.5 * 1.3 (0.7-2.9) | 1.3 ± 0.5 1.3 (0.7-2.3) | 1.4 ± 0.5 1.3 (0.8- 2.9) | 1.6 ± 0.4 1.7 (0.9-2.5) | 1.7 ± 0.3 1.7 (1.1- 2.2) | 1.6 ± 0.4 0.6 (0.9- 2.5) |
| LDL, mM | 3.0 ± 0.9** 2.9 (1.5-6.1) | 3.2 ± 1.0 3.0 (1.5-6.1) | 2.6 ± 0.6 2.4 (1.7- 3.2) | 2.6 ± 0.6 2.6 (1.8-3.9) | 2.6 ± 0.5 2.6 (1.8- 3.5) | 2.6 ± 0.6 2.5 (1.8- 3.8) |
| Triglycerides, mM | 1.2 ± 0.6* 1.1 (0.4-3.9) | 1.2 ± 0.7 1.0 (0.4-3.9) | 1.1 ± 0.4 1.1(0.5- 1.8) | 1.0 ± 0.3 1.0 (0.5-1.8) | 1.0 ± 0.3 1.0(0.5- 1.8) | 0.9 ± 0.3 0.9 (0.5- 1.5) |
| AI | 2.7 ± 1.4* 2.5 (0.6-8.2) | 2.9 ± 1.5 2.6 (1.2-8.2) | 2.3 ± 1.0 2.3 (0.6- 3.9) | 1.7 ± 0.7 1.7 (0.7-3.8) | 1.7 ± 0.7 1.4 (0.8- 3.2) | 1.8 ± 0.7 1.9 (0.6- 3.7) |
| ALT, U | 28 ± 14* 26 (11- 82) | 31 ± 17 30(13- 82) | 24 ± 9 25 (11- 42) | 16 ± 4 16(7-25) | 16 ± 4 16 (11-22) | 15 ± 4 16 (7-25) |
| AST, U | 26 ± 7 25 (15- 49) | 28 ± 7 25 (19- 49) | 23 ± 6 24 (15- 33) | 27 ± 7 26 (14- 52) | 27 ± 6 26(16-42) | 26 ± 8 25 (14-52) |
| ALT/AST | 1.0 ± 0.4* 1.0 (0.5-1.6) | 1.1 ± 0.4 1.0 (0.5-1.7) | 1.0 ± 0.3 0.9 (0.5- 1.5) | 0.6 ± 0.2 0.6 (0.3-1.1) | 0.6 ± 0.1 0.6 (0.4- 0.8) | 0.6 ± 0.2 0.6 (0.2- 1.1) |
Table 1: Anthropometric and biochemical indices in obese (experimental) and control groups (m±SE; Me [Q1-Q3]).
Note: *p<0.001, **p<0.05. Table 1: Anthropometric and biochemical indices in obese (experimental) and control groups (m±SE; Me [Q1-Q3]).
The most patients in experimental group (31 of 40) were diagnosed with classes II or III obesity. In control and experimental groups, the levels of total cholesterol, glucose, AST, and СоQ10 did not differ significantly. However, in comparison with the respective control age related parameters, the obese patients had elevated triglycerides, LDL, ALT, and AI accompanied with decreased HDL.
OGTT Results
In 15 patients of experimental group, OGTT revealed a flat glucose tolerance curve and enhanced fasting insulin levels (in comparison with the age related norm of 3-20 µU/ ml), which almost doubled after glucose intake (Table 2).
| Value | |
|---|---|
| Fasting glucose, mM | 4.7±0.7 4.6 (3.4-6.1) |
| Fasting insulin, μU/ml | 38±13 33.8 (21.2-64.4) |
| Glucose in 2 h after OGTT, mM | 5.0±1.1 5.1 (3.3-7.4) |
| Insulin in 2 h after OGTT, U | 67±30 63.3 (20.8-111.9) |
| HOMA-IR | 8±3 7.6 (4.1-12.8) |
| Index Caro | 0.14±0.06 0.15 (0.07-0.26) |
Table 2: OGTT in obese patients (n=15, m±SE; Me [Q1-Q3]).
Instrumental Indices
Ultrasonography showed that obesity was accompanied with enlargement of the liver (85% cases) and alterations in the structure of hepatic tissue (32% cases). In some obese patients, there were the heart rate abnormalities (27.5%) manifested by bradyarrhythmia, tachyarrhythmia, as well as atrial and ventricular extra systoles, disturbances in ventricular recovery during hyperpolarization phase of cardiocycle (17.5%), and the signs of failure in the heart conduction system (12.5%, Table 3).
| Value | |
|---|---|
| Number (male/female) | 40 (m, 25/f, 15) |
| Age, yr | 12±2 |
| Age, yr | m, 12±2/f, 12±2 |
| BMI | 30±5 |
| BMI | m, 29±3/f, 32±6 |
| Obesity class: Total number of patients (m/f) | I: 5 (4/1) II: 17 (10/7) III: 14 (10/4) IV: 4 (1/3) |
| Hepatic changes revealed by sonography: | |
| Enlargement (male/female) | n=34 (21/13) or 85%; of them, the obesity class: |
| Enlargement (male/female) | I (2/0); II (8/6); III (10/4); IV (1/3) |
| Structural alterations | n=13 (8/5) or 32%; of them, the obesity degree: |
| Structural alterations | I (1/0); II (3/1); III (3/3); IV (1/1) |
| Cardiovascular complications (arterial hypertension) | n=5 (3/2) or 12.5%; of them, the obesity class: |
| Cardiovascular complications (arterial hypertension) | I (1/0); II (1/1); III (1/0); IV (0/1) |
| Changes in ECG: | |
| Brady- and tachyarrhythmia, ectopic rhythm. | n=11 (7/4) or 27.5%; of them, the obesity class: |
| Brady- and tachyarrhythmia, ectopic rhythm. | I (2/0); II (2/3); III (3/0); IV (0/1) |
| Ventricular recovery during hyperpolarization phase of cardiocycle | n=7 (4/3) or 17.5%; of them, the obesity class: I (0/0); II (2/2); III (1/0); IV (1/1) |
Table 3: Anthropometric, hepatic, and cardiac indices in obese group.
Discussion
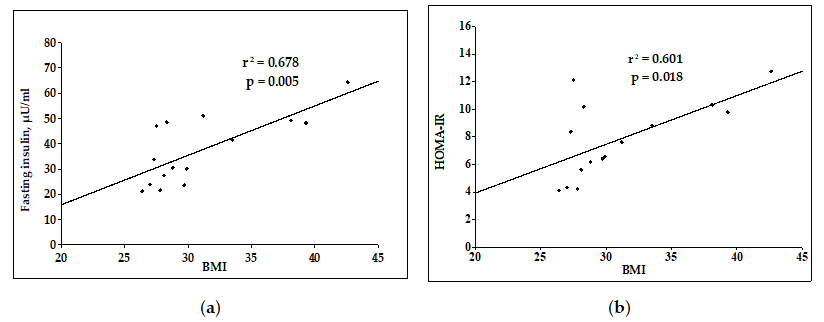
According to modern pathogenetic views, obesity results from chronic inflammatory process in the adipose tissue, which tends to affect hepatocytes and cardiomyocytes [8, 9]. In the following, such complications can occur as non-alcoholic fatty liver disease (NAFLD) and cardiovascular disease [10]. Most of obese patients demonstrated hepatic abnormalities (85%) and the changes in cardiovascular system (40%). Despite the absence of significant differences between some indices in control and obese groups, the interquartile range revealed elevation of the following indices in the experimental group in comparison with the age-related norm observed in the control group: 1) total cholesterol, 4.4-5.1 mM (vs 4.4 mM); 2) triglycerides, 0.85-1.12 mM in children aging 0-9 yr (vs <0.85 mM) and 1.0-1.47 mM in adolescents aging >9 yr (vs <1.0 mM), and 3) LDL, 2.85-3.34 mM (vs <2.85 mM) [7]. Elevation of these indices resulted from significant rise of LDL and drop of HDL. Correspondingly, in experimental group AI was 1.5-fold higher than the control value (Table 1) attesting to increased intensity of lipid peroxidation in the blood plasma of obese patients. The mean value of НОМА- IR=7,8 in experimental group indicated a moderate degree of insulin resistance, although it was near to the boundary value separating moderate and high degree of this resistance (НОМА-IR>8). At this, both fasting insulin and НОМА-IR, CARO (typical indices used to assess the MS symptoms) positively correlated with BMI (Figure 1).
Thus, the development of obesity was accompanied with aggravation of insulin resistance, which was also indicated by the flat glucose tolerance curve and hyperinsulinism. Combination of these symptoms with dyslipidemia in experimental group attested to MS (Tables 1 & 2).
Definition of obesity as chronic inflammatory process including oxidative stress as one of its pathologic elements explains acute interest in СоQ10 due to the key role, which this coenzyme plays in the performance of mitochondrial respiratory chain and taking into consideration its antioxidant function [8, 11, 12]. In this study, which predominantly enrolled the children with moderate obesity, no significant differences in plasma levels of СоQ10 relatively to the control value were observed. Literature reports the contradictory data on relations between obesity and СоQ10. Examination of adolescents aging 10-19 yr with predominantly moderate obesity and elevated total cholesterol revealed a drop in total plasma СоQ10 by 51 and 59% in boys and girls, respectively [13]. In similar examination of obese children at the same age with elevated total cholesterol and LDL, the plasma СоQ10 was low irrespective of the presence of MS symptoms [14]. However, another study of 10-13-year children with moderate obesity and elevated plasma cholesterol revealed no abnormal changes in СоQ10 level, which was normalized to cholesterol [15].
It is a common knowledge that cholesterol is the main carrier of СоQ10 in the blood plasma, where this coenzyme is the most important element of its antioxidant protection [12]. Here, the experimental patients demonstrated no expected positive correlation be-tween plasma СоQ10 and total cholesterol which was shown in control group (Figure 2).
![Figure 2: Relationship between CoQ10 and total cholesterol in control (a) and experimental (b) groups Insufficient supply of cholesterol with СоQ10 in obese children can result from a drop in СоQ10 level in the liver due to inflammation, which can be one of the causes of dyslipidemia in these patients. Actually, the development of obesity in children is accompanied with progressive rise of plasma cholesterol and drop of plasma СоQ10 [13].](/fulltextimages/10434/fig_2.png)
Figure 2: Relationship between CoQ10 and total cholesterol in control (a) and experimental (b) groups Insufficient supply of cholesterol with СоQ10 in obese children can result from a drop in СоQ10 level in the liver due to inflammation, which can be one of the causes of dyslipidemia in these patients. Actually, the development of obesity in children is accompanied with progressive rise of plasma cholesterol and drop of plasma СоQ10 [13].
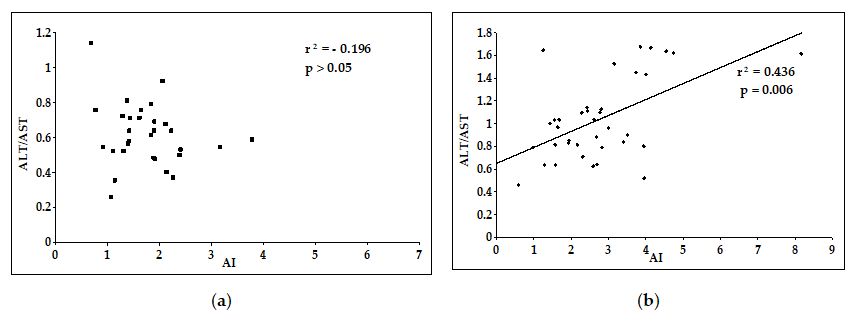
NAFLD is one of the most frequent complications in children and adults resulting from inflammatory process in hepatocytes and manifested by increased levels of liver enzymes. Numerous clinical studies revealed a positive correlation between pronouncedness of NAFLD and MS symptoms [16, 17, 18]. Here, the experimental group demonstrated a significant 2-fold increases of ALT level (within the limits of reference values) and ALT/AST ratio in comparison with the control values. Elevation of this ratio in obese group correlated with manifestation of dyslipidemia reported by increased AI (Figure 3), which reflected association of inflammatory alterations in hepatocytes with up-regulation of oxidative processes; so, this elevation can be viewed as a marker of MS.
Based on histological alterations in the liver at subcellular level indicated by accumulation of fatty acids in hepatocytes and oxidation of phospholipids in cell membranes (mitochondrial ones included), some researches consider NAFLD as a mitochondrial disease [19]. Remembering the most important role of СоQ10 in performance of mitochondrial respiratory chain and its antioxidant function, one of the aims in this study was analysis of association between the degree of hepatic inflammation assessed by liver enzymes and СоQ10 level. Here, we revealed positive correlation between ALT/AST ratio and plasma СоQ10 in the control group (Figure 4a) in contrast to experimental group, where no such correlation was observed (Figure 4 b).
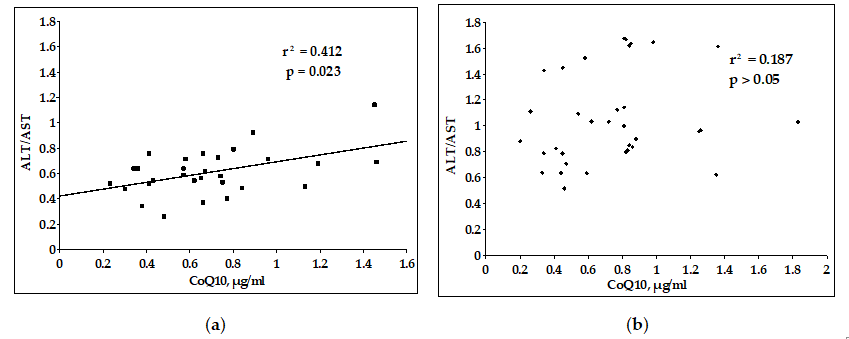
Imbalance between ALT/AST ratio and СоQ10 in obese patients can reflect the opposite changes in the levels of plasma ALT and endogenous antioxidant CoQ10 resulting from hepatic inflammation, which elevates the content of liver enzymes in blood plasma and depletes the pool (down- regulates the synthesis) of CoQ10.
The modern literature discusses probable changes in CoQ10 synthesis during NAFLD. Actually, the analysis of numerous clinical and experimental studies of this disease yielded contradictory data about CoQ10 level, which increased in the blood plasma according to some studies and dropped in plasma and hepatic tissue according to other reports, possibly reflecting various stages of pathological process in the liver and depletion of CoQ10 pool [20].
Analysis of all examinees in control and experimental groups established the strong positive correlations between BMI and ALT and between BMI and ALT/AST ratio (Figure 5).
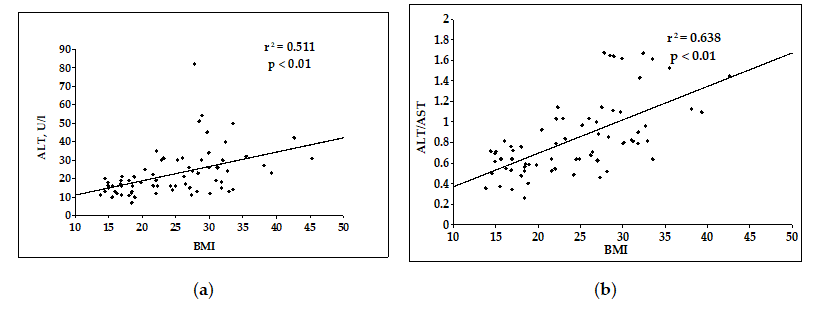
Our results agree with available data on association between liver enzymes (predominantly, ALT) and MS manifestations. The extensive study of adolescents aging 9-17 yr (n=7271) also established a positive correlation between BMI and ALT, which was especially strong at BMI>20.5 kg/ m2: elevation of BMI by 1 kg/m2 was accompanied by 2.71 U/l increment in ALT [21]. Another study of adolescents aging 10-19 yr (n=808) revealed (in girls, predominantly) the positive correlations between MS manifestations and ALT as well as between such manifestations and low AST/ ALT ratio [22]. Similar results were obtained in other studies, which revealed positive correlations between 1) ALT, on the one hand, and MS severity by Z-Score as well as BMI, on the other hand [23]; 2) ALT, on the one hand, and body weight/ height ratio as well as (to a lesser degree) BMI and waist circumference, on the other [24]; 3) ALT, on the one hand, and BMI, body weight/height ratio, percentage of fat tissue, and waist circumference, on the other hand [25]; and 4) ALT and insulin resistance index HOMA-IR [26, 27].
In the last decade, investigators focused on diagnostic significance of ALT/AST ratio as an index of insulin resistance in obesity [28, 29]. In a study conducted in Japan on a population of adults with normal weight and obesity, diagnostic criteria for the ALT / AST ratio were established for assessing insulin resistance: in non-obese individuals above 0.82 and above 1.02 for obese patients. In a population based Chinese study in patients with different types of obesity, there was a direct correlation between the ratio of ALT / AST and HOMA-IR. At the same time, the ALT / AST values (0.78-0.8) were slightly lower than in the Japanese study. A comprehensive study of MS patients (n=2585) established the positive correlation between ALT/AST ratio (at the values ≥1) and MS manifestations irrespectively of sex [30]. Another study analyzed the reverse ratio AST/ALT, which also correlated with MS [22].
It should be noted that at the moment there have been no similar attempts to determine the reference values of the ALT/AST ratio as a criterion of insulin resistance for children and adolescents in the literature. Our study on a small sample revealed for obese children with signs of MS the ALT/ AST ratio equal to 1.0 (0.5-1.6), in contrast to children with normal weight, in whom this ratio is 0.6 (0,3-1,1); to clarify the ALT/AST reference values, an analysis of data from a larger number of patients is required.
Thus, the main signs of MS were found in obese children, and the progression of obesity is associated with an increase in MS signs. Association between obesity and hepatic pathology is reflected by correlations between BMI and ALT and between BMI and ALT/AST ratio established here for all examinees in the combined group of control and obese examinees. Importantly, one of MS manifestations (dyslipidemia assessed by AI) increased in parallel with ALT/AST ratio. Consequently, the parameter of liver enzymes ALT/AST ratio, which are associated both with BMI and AI (Figure 6), surely can play the role of early marker indicating the development of MS in obesity.
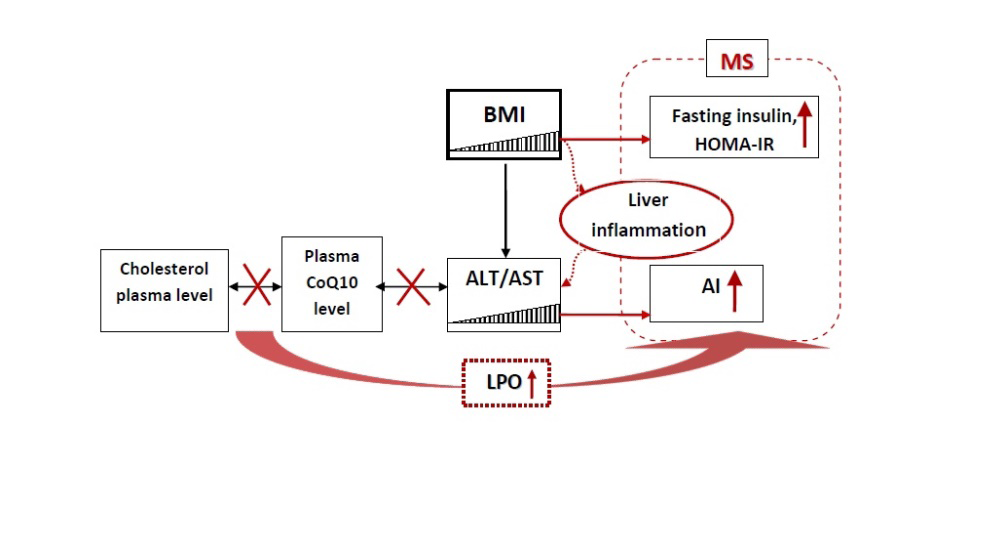
The correlations between endogenous antioxidant CoQ10 and total cholesterol, as well as between CoQ10 and the liver enzymes in children with normal body weight attest to balanced control of antioxidant protection of lipoproteins and normal function of the liver. The progress of obesity and the development of inflammation in hepatocytes are accompanied by elevation of plasma levels of liver enzymes and insufficient antioxidant protection reflecting implication of oxidative stress in obesity pathogenesis (Fig. 6). The disturbances in relations between CoQ10 and ALT/AST as well as between CoQ10 and total cholesterol, which are considered as possible reasons of dyslipidemia in obese children and adolescents, can be advanced as indications for treatment with membrane-stabilizing and antioxidant agents.
Materials and Methods
Experimental Groups
The observational prospective study enrolled adolescents aging 7-15 yr, who were the patients in Regional Children’s Clinical Hospital (Smolensk, Russia). The inclusion criteria were 1) the informed consent for a research study signed by the patients and their parents; 2) BMI SD score >+2.0; and 3) patient age 7-15 yr. The exclusion criteria were 1) type 2 diabetes mellitus; 2) inflammatory and/or autoimmune liver diseases; and 3) treatment with hepatotoxic medications. The mean age of the participants was 12 yr. The study was approved by Smolensk State Medical University Ethical Committee: Protocol No. 17, November 25, 2017.
The body mass index (BMI) was calculated as body weight (kg) divided by the square of the patient’s height (m). It was employed to diagnose obesity and assess its class with the percentile charts.
The experimental group comprised 40 examinees (25 boys and 15 girls) in the Endocrinology Division with class I-IV obesity (BMI SD score >+2.0). Of them, obesity of the following classes were diagnosed: class I (4 boys and 1 girl), class II (10 boys and 7 girls), class III (10 boys and 4 girls), and class IV (1 boy and 3 girls). The control age matched group consisted of 32 patients from the Orthopedics Division (12 boys and 20 girls) with -1 ≤BMI SD score ≤ +1.0.
Biochemical and Instrumental Studies
In all examinees, the lipid profile was assessed according to total cholesterol, triglycerides, LDL, and HDL. The atherogenic index (AI) was calculated as (total cholesterol [mM] – HDL [mM])/HDL [mM]. In addition, fasting glucose, liver enzymes ALT and AST, as well as plasma level of ubiquinone (coenzyme Q10 or СоQ10) were determined.
In some patients of experimental group (n=15), the oral glucose tolerance test (OGTT) was performed. Insulin was determined under fasting conditions and in 2 h after glucose intake to calculate the homeostasis model assessment for insulin resistance (HOMA-IR). In addition, the Caro index was calculated as fasting glucose (mM)/fasting insulin (µU/ ml). To determine liver enzymes and biochemical indices of carbohydrate and lipid metabolism, the blood was drawn in the morning under fasting conditions according to the protocol of GLP preanalytical phase and examined in Central Clinical laboratory at RCCH. To assay for ubiquinone, the blood (1.5 ml) was similarly drawn into tubes with heparin. The blood plasma was separated by centrifugation and stored at -20°C prior to examination. The plasma level of СоQ10 was determined with HPLC and electrochemical detection [6].
In all patients of experimental group, ECG was recorded and ultrasound investigation of abdominal organs was performed.
Statistical Processing Methods
Since most indices were distributed abnormally, the data were analyzed with non-parametrical tests. The independent samples were compared with Mann-Whitney test. Correlations were analyzed with non-parametrical Spearman test. Significance was assessed at p<0.05. The results are summarized as m±SE or Me [Q1-Q3]. The results were statistically processed using Statistica 10.0 (StatSoft) software.
Author Contributions
Conceptualization, O.V.P, E.A.G. and E.I.K.; Methodology, E.I.K., I.L.A.; Software, O.V.P.; Validation, E.I.K., E.A.G..; Formal Analysis, O.V.P.; Investigation, A.V.D., O.J.K.; Resources, E.I.K. and I.L.A.; Data Curation, E.A.G.; Writing – Original Draft Preparation, O.V.P., E.A.G. and E.I.K.; Writing – Review & Editing, E.A.G. and E.I.K.; Visualization, O.V.P. and E.I.K.; Supervision, E.I.K., I.L.A. and O.S.M.; Project Administration, E.I.K., O.S.M. All authors have read and agreed to the published version of the manuscript.
Funding: This research received no external funding.
Institutional Review Board Statement: The study was conducted according to the guidelines of the Declaration of Helsinki, and approved by the Institutional Review Board (or Ethics Committee) of Smolensk State Medical University (protocol No 17, November 25, 2017).
Informed Consent Statement: All the parents of the participating infants signed a written in-formed consent.
Acknowledgments: We express our gratitude to the participating children and their families for their consent. We appreciate the statistic aid of Dr. Alexander Berdalin (Federal State Budgetary Institution Federal Center of Brain Research and neurotechnologies of the Federal Medical Biological Agency, Russia). We appreciate the scientific advice from Dr. Sergey V. Revenko (Department of Institute of Experimental Cardiology, Russian Cardiology Research and Production Complex, Russia).
Conflicts of Interest
The authors declare no conflict of interest.
References
-
Wang LX, Gurka, MJ, DeBoer MD (2018) Metabolic syndrome severity and lifestyle factors among adolescents. Minerva Pedi-atr 70(5): 467-475.
-
Garwood P, Chaib F, Brogan C (2021) Tenfold increase in childhood and adolescent obesity in four decades: new study by Imperial College London and WHO.
-
WHO (2021) Obesity and Overweight.
-
Weihe P, Weihrauch-Blüher S (2019) Metabolic syndrome in children and adolescents: diagnostic criteria, therapeutic options and perspectives. Curr Obes Rep 8(4): 472-479.
-
DeBoer MD (2019) Assessing and managing the metabolic syndrome in children and adolescents. Nutrients 11(18): 1788-1790.
-
Kalenikova EI, Gorodetskaya EA, Medvedev OS (2008) Pharmacokinetics of coenzyme Q10. Bull Exp Biol Med 146(3): 313-316.
-
(2011) Expert Panel on Integrated Guidelines for Cardiovascular Health and Risk Reduction in Children and Adolescents. Summary Report. Pediatrics 128(S5): S213-S256.
-
Manna P, Jain SK (2015) Obesity, oxidative stress, adipose tissue dysfunction, and the associated health risks: causes and thera-peutic strategies. Metab Syndr Relat Disord 13(10): 423-444.
-
Longo M, Zatterale F, Naderi J, Parrillo L, Formisano P, et al. (2019) Adipose Tissue Dysfunction as Determinant of Obesity-Associated Metabolic Complications. Int J Mol Sci 20(9): 2358.
-
Kinlen D, Cody D, O’Shea D (2018) Complications of obesity. QJM 111(7): 437-481.
-
Vona R, Gambardella L, Cittadini CE, Straface E, Piertaforte D (2019) Biomarkers of Oxidative Stress in Metabolic Syndrome and Associated Diseases. Oxid Med Cell Longev 2019: 8267234.
-
Casagrande D, Waib PH, Jordão AA (2018) Mechanisms of action and effects of the administration of Coenzyme Q10 on metabolic syndrome. J Nutr Intermed Metab 13: 26-32.
-
Gvozdjakova A, Kucharska J, Tkacov M, Singh RB, Hlavata A (2012) Ratio of lipid parameters to coenzyme Q10 could be used as biomarker of the development of early complications of obesity in children. Bratisl Lek Listy 113(1): 21-25.
-
Muhtagorlu S, Koca SO, Cetin I, Keti DB, Kendirc M (2016) Investigation of ischemia modified albumin and coenzyme Q10 levels in obese children with metabolic syndrome. TJB 41(6): 443-449.
-
Menke T, Niklowitz P, de Sousa G, Reinehr T, Andler W (2004) Comparison of coenzyme Q10 plasma levels in obese and normal weight children. Clin Chim Acta 349(1-2): 121-127.
-
Pacifico L, Nobili V, Anania C, Verdicchia P, Chiesa C (2011) Pediatric nonalcoholic fatty liver disease, metabolic syn- drome and cardiovascular risk. World J Gastroenterol 17(26): 3082-3091.
-
D’Adamo E, Castorani V, Nobili V (2019) The Liver in Children with Metabolic Syndrome. Front Endocrinol (Lausanne) 10: 514.
-
Lonardo A, Leoni S, Alswat KA, Fouad Y (2020) History of non-alcoholic fatty liver disease. Int J Mol Sci 21(16): 5888.
-
Ajith TA (2018) Role of mitochondria and mitochondria targeted agents in non-alcoholic fatty liver disease. Clin Exp Pharmacol Physiol 45(5): 413-421.
-
Botham KM, Napolitano M, Bravo E (2015) The emerging role of disturbed CoQ metabolism in nonalcoholic fatty liver disease development and progression. Nutrients 7(12): 9834-9846.
-
Ding Z, Zhang J, Deng C-Y, You Y-B, Zhou H (2019) Association of body mass index with serum alanine aminotransferase in Chinese adolescents: a school- based cross-sectional study. Gastroenterol Rep (Oxf) 8(2): 119-124.
-
Lee K, Yang JH (2013) Which liver enzymes are better indicators of metabolic syndrome in adolescents: the Fifth Korea National Health and Nutrition Examination Survey 2010. Metab Syndr Relat Disord 11(4): 229-235.
-
Fermin CR, Lee AM, Filipp SL, Gurka MJ, DeBoer (2017) Serum alanine aminotransferase trends and their relationship with obesity and metabolic syndrome in United States Adolescents, 1999–2014. Metab Syndr Relat Disord 15(6): 276-282.
-
Ochiai H, Shirasawa T, Nishimura R, Nanri H, Ohtsu T, et al. (2015) Waist-to-height ratio is more closely associated with alanine aminotransferase levels than body mass index and waist circumference among population-based children: a cross-sectional study in Japan. BMC Pediatr 15: 59.
-
Ahn MB, Bae WR, Han KD, Cho WK, Cho KS, et al. (2015) Association between serum al-anine aminotransferase level and obesity indices in Korean adolescents. Korean J Pediatr 58(5): 165-171.
-
Lee Y, Han KD, Jung JJ, Lee KH, Cho KH, et al. (2016) Upper normal alanine aminotransferase range and insulin resistance in Korean adolescents: Korean national health and nutrition examination survey, 2009-2010. Dig Dis Sci 61(6): 1700-1706.
-
Kim KE, Baek KS, Han S, Kim JH, Shin YH (2019) Serum alanine aminotransferase levels are closely associated with metabolic disturbances in apparently healthy young adolescents independent of obesity. Korean J Pediatr 62(2): 48-54.
-
Kawamoto R, Kohara K, Kusunoki T, Tabara Y, Abe M, et al. (2012) Alanine aminotransferase/aspartate aminotransferase ratio is the best surrogate marker for insulin resistance in non-obese Japanese adults. Cardiovasc Diabetol 11: 117.
-
Zhao L, Cheng J, Chen Y, Li Q, Han B, et al. (2017) Serum alanine aminotransferase/aspartate aminotransferase ratio is one of the best markers of insulin resistance in the Chinese population. Nutr Metab (Lond) 14: 64.
-
Homsanit M, Sanguankeo A, Upala S, Udol K (2012) Abnormal liver enzymes in Thai patients with metabolic syndromes. J Med Assoc Thai 95(3): 444-451.
- Investigation of Polymorphisms in PPAR-Ɣ and TRHR Genes and their Impact on Turkish Diabetic and Obese Individuals
- The Impact of Aircraft Noise Exposure on the Efficacy of Empagliflozin Therapy in an Animal Model of Obesity
- Rooibos Mitigates Metabolic and Inflammatory Dysfunctions in Mice Fed a High-Carbohydrate Diet
- Synergistic Effect of Combined Leaf Extract of Vernonia amygdalina, Ocimum gratissimum, and Zingiber officinale Tuber on Phytochemical Profile, Antioxidant Activity, Serum Insulin, and Biochemical Parameters in Streptozotocin-Induced Diabetic Rats
- Investigation of Cardiovascular Responses to Aerobic Exercise in Obese University Students
- A Look at the Phase Angle Obtained by Electrical Bioimpedance