Informative Feedback: A Help to Change People's Behaviour
Evolved from the portable phone, the smartphone has assumed significant importance in the lives of many people to make them increasingly dependent, conditioning interests and activities, with very negative effects on freedom of choice, motivation and commitment in many areas of daily life, primarily interpersonal relationships and contexts of aggregation such as pubs and restaurants. The research was born as an experiment of Nudge application to reduce the frequency of smartphone use in pubs and restaurants through the use of informative feedback. The control group has shown a reduction in the frequency of use of the smartphone in the moments of aggregation, and this proves the effectiveness of the intervention.
Introduction
Being always connected and all-to-easily contactable has resulted in a new age of urgency. Demand to respond instantaneously at any given moment in time or place without a moment’s thought, has exploded in this modern age. This entails excessive social pressure to which you must respond with a commitment and reactivity without limits.
The presence in the smartphone of software for sms, e-mails, or voice messages implicitly requires a quick and immediate reading and response [1]. The risks associated with the diffusion of smartphones do not depend on the device itself, but on the mode and frequency of use that is made of it by both young people and adults [2, 3, 4, 5]. Nowadays the huge use of the smartphone has been defined as “one of the greatest dependencies on non-substances of the twenty- second century” [6].
What we see today in pubs and restaurants is precisely the situation described by Krasnova, et al. [7]: people already as they enter a room have their smartphone in hand, sit at the table and place it next to it by themselves, they take the menu and if they don’t know a food they look for it through the device. The food arrives, with one hand they grab it and with the other they touch the screen to check or send text or voice messages and keep their eyes downcast. They are able to consume the order in thirty minutes interacting only with their smartphone; once finished they go to the cash desk, pay and leave, always with the device in hand.
The presence of the smartphone at the table shows negative effects on the feelings of closeness, mutual contact and on the quality of the conversation [8]. The literature defines “phone snubbing” as a specific behavior in neglecting or “snubbing” the person with whom you are engaged in any social situation (e.g. from the bedroom, to having a coffee at a café, to the aperitif in a pub) in order to watch, check and compulsively touch the smartphone, even if the context and social conventions would push you to create interactions or provide attention to the people next to you [9, 10]. Focusing on your device becomes a barrier to meaningful communication, and therefore a cause of conflict, with a consequent decrease in satisfaction in the relationship and an impairment of individual well-being [11, 12].
The use of Nudge, translated into Italian as “gentle push” is a form of behavioral modification that, just like a GPS navigator, guides people in alternative and functional directions for themselves and the community, leaving them free to choose, without using economic incentives or punishments [13]. Studies conducted by behavioral economics have amply demonstrated the effectiveness of the nudge technique called informative feedback [14, 15, 16]. Informative feedback consists in using clear and simple images to allow humans to immediately understand what the consequences of their behavior may be in the long term. It is a modification of a short-term context that allows an individual to have a clear idea of how to act and motivates them to undertake an alternative behavior knowing what benefit can derive from it [13]. The experiment was structured keeping in mind all the considerations above.
Material and Methods
The research was conducted during aperitif time (18:00 - 24:00) in two areas in Sicily; Catania and Noto with the experimental group n=39 and the control group n=60. The observations were made by two independent observers. The premises were chosen based on: the owners’ willingness to participate in the initiative, that the owners’ restaurants were similar in size, that they could facilitate a similar capacity of patron numbers and the ability to distribute alcoholic drinks in this given timeslot.
Both restaurants, one located in Noto and the other in Catania, are medium-large sized restaurants, intended for the distribution of alcoholic drinks and aperitifs, with cuisine on request according to the time slot.
All participants (n=99) from both venues were ordinary or occasional customers of different sex, ethnicity and age. For data analysis, the statistical unit chosen refers to the number of people sitting at the tables. It changes whenever the number of people sitting at the table changes.
Materials
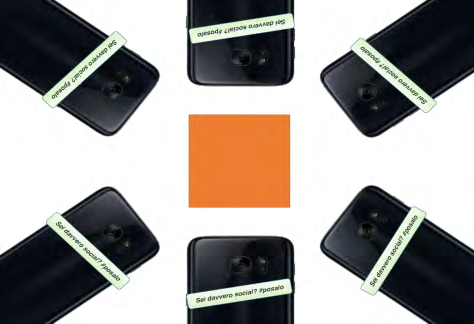
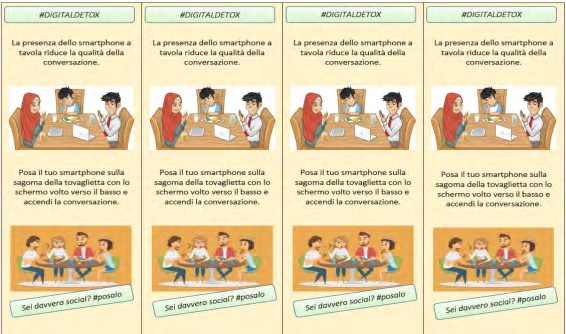
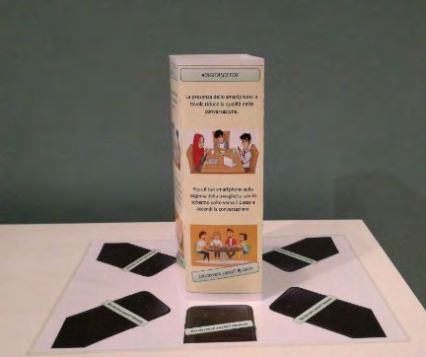
In the experimental group, at the center of each table was placed a plasticized placemat with six smartphone silhouettes drawn with the screen facing downwards and a leaflet, which provided information on the consequences produced by the use of the smartphone in the moments dedicated to lunch, dinner or as an aperitif. It suggested which behavior was most useful and appropriate to emit in moments of sharing: “The presence of the smartphone at the table reduces the quality of the conversation. Place your device on the placemat with the screen facing downwards and turn on the conversation” (Figures 1 & 2).
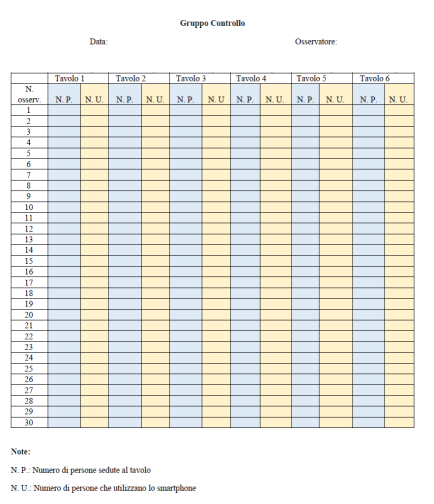
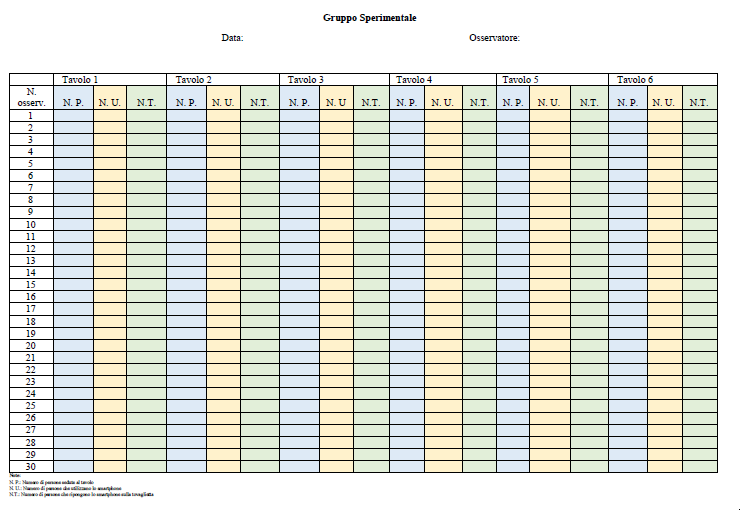
An ad hoc observation grid was the tool used to observe and evaluate the people’s behaviour sitting at the table. It allowed to record in the control phase the number of people sitting at the table and the number of those interacting with the smartphone (Figure 3).
In the experimental phase, in the presence of the placemat with the information leaflet, recorded the number of people sitting at the table, the number of people interacting with the smartphone and the number of smartphones placed on the placemat with the screen facing down (Figure 4).
To support the observers in their task, there was an audio file that communicated when to watch the subjects and annotate their behavior (every 5). This audio was played on a smartphone through a splitter in order to allow both the observers to simultaneously take notes for the experiment.
Also a list of target behaviors, defined by observers in the design phase to determine the interaction or non-interaction with the smartphone, was available for the observers (Table 1).
Behaviors to be marked as non- interaction with the smartphone Behaviors to be marked as interaction with the smartphone The smartphone is kept next to the person on the table.
The subject picks up the smartphone and looks at it.
The subject picks up the smartphone to call or send SMS.
The device is held close to the person but it is not looked at.
You are alone at the table and the subject uses the smartphone as a “distractor”.
The subject touches their device to view notifications / time etc.
The subject picks up the smartphone and uses it as a sharing tool with the other components of the table (In this case the frequency of the behavior to be reported will be twofold: X = subject picking up the phone; X = subject (s) observing / no smartphone).
The device is taken in hand to go away, then it is slipped into a bag or held in the hand.
The subject takes photographs or selfies (in this case the frequency of the behavior to be marked will be twofold: X = subject that takes the device in hand; X = subject / s that observes / no the device and is part of the photo).
| You do not have good visibility of the contents of the box. | |
|---|---|
| The subject holds the smartphone in his hand without looking at it. | The behavior of people sitting at the table is not clearly visible. |
Table 1: The table illustrates the specific behaviors considered
To record people’s behavior, the Momentary Time Sampling (MTS) method was chosen in all observations. As the table number (audio file created ad hoc) was scanned, observers recorded the presence or absence of behaviors defined as interaction with the smartphone and the number of people sitting at the tables (in the control phase); in addition in the experimental phase they also reported the number of devices on the placemat placed in the center of the table.
Procedures
Chosen two days of the week with the restaurateur (Tuesday and Saturday), each room was observed twice, for two consecutive weeks: in the first week without the placemat and the centerpiece, in the second with the independent variable.
The observations were carried out from 18.00 to midnight. The observers, in agreeing on which tables to observe and in what succession, took into account the visibility of the people sitting at the tables and the presence of least three tables of two or more people.
Constructed in such a way as to contain a total of 30 observations, the time required for compilation was 17 minutes and 30 seconds. The observation in the premises could be considered and concluded by the observers when they had filled all 5 observation grids. During the control phase, the number of people seated at the table and the frequency of use of the smartphone was recorded in the various columns; in the experimental phase, in addition to these two columns, there was a third column inside which the number of devices positioned with the screen facing down on the placemat in the center of the table was reported.
Each observation considered a total of 6 tables, observed in succession, for a total duration of 30 seconds (table 1 + table 2 + table 3 + table 4 + table5 + table 6). Each table was observed every 5 seconds. At the end of each observation, a 5 second pause was inserted in the audio file. The total duration of each observation string was therefore 35 seconds.
Each observer filled out 5 observation grids during each phase of the experiment.
Experimental Design
The dependent variable is the frequency the smartphones’ usage within the two groups. The independent variable is the placemat and the information leaflet with explanatory images and the writing “The presence of the smartphone at the table reduces the quality of the conversation. Place your device on the shape of the placemat with the screen facing down and turn to the conversation. “ The experiment design consists of the following within each group type: an independent variable (non-intervention vs intervention), two independent variables (control group vs experiment group) and a repeated measurement on the dependent variable (smartphone usage).
Data Analysis and Results
The expected outcome was a reduction in smartphone usage in the presence of the placemat with the informative leaflet. Four results measurements were made for each statistical unit. During the surveys, 172 statistical units were identified, from which were excluded: Statistical units with consecutive observations of less than four. Statistical units with none or one person sitting at the table.
The only statistical unit with seven people sitting at the table, due to the impossibility of calculating the Chi-square relative to the difference in distribution at the tables for the two groups, control and experimental.
Overall, 73 statistical units were excluded, therefore the total number of those subjected to analysis was 99: 60 (60.6%) during the control phase and 39(39.4%) during the experimental phase.
The analysis conducted considered a score p <.50 statistically significant. Specifically, in order to be able to compare the nominal/categorical variables, the Chi-square test was used, useful to verify that the frequencies of the observed values adapt to the theoretical frequencies of a predetermined probability distribution. However, when the value occurred with a frequency greater than 5, it was preferred to use additional frequency tests, such as the exact Fisher test.
The Mann-Whitney U test was used to compare ordinal variables or interval / rational variables characterized by a non-normal distribution on two independent groups. All analyzes were carried out with SPSS version 20.0 of 2009.
The agreement between observers (IOA) consists of the number of agreements reported by the two observers within the observation grids in both phases of the research, during the same observation. It in formula is given by the relationship between the number of agreements and the total number of observations made by the two observers. The percentages of agreement between observers refer, in both phases of the research, to the percentages of crosses inserted by each observer on the observation grids.
During the control phase, the agreement between observers on the number of people seated at the tables was always 100%, as well as that relating to the frequency of use of the smartphone.
In the experimental phase, the IOA relating to the number of people seated at the tables was always 100%, as well as that relating to the frequency of use of the device and that relating to the number of smartphones placed on the plasticized placemat. The values obtained show a statistically significant reliability of the agreement between the observers which allows the obtained data to be considered valid. The units observed were composed of a number of people seated at the tables which ranged between two and six subjects. In the control group, 22 of these (36.7%) consisted of two people, 18 (30.0%) of three people, 12(20.0%) of four people, 7(11.7%) of five people and one (1.7%) by six people. In the experimental group, 18 statistical units (46.2%) included two people, 12(30.8%) three people, 3(7.7%) four people, 5(12.8%) five people and one (2.6%) six people (Figure 5). As for these distributions, the Chi-square test could not be performed. However, excluding the two statistical units characterized by six people, no statistically significant differences were found between the two groups on the Chi-square test: χ2 (3, N = 97) = 2.924, p = .403 [p> .050].
Regarding the duration of the statistical units, statistically significant differences were found between the two phases (U=796.500; p= .007). Specifically, there were times spent at the minor tables during the control phase (median = 530 seconds, equal to 8 minutes and 50 seconds; interquartile distance = 788.00 seconds; average= 877.08, equal to about 14 minutes and 37 seconds) compared to the experimental phase (median= 1195 seconds, equal to 19 minutes and 55 seconds; interquartile distance = 1820.00 seconds; average = 1464.23 seconds, equal to about 24 minutes and 24 seconds). In this case, we chose to use the U test given the non-normality of the duration of the statistical units (p = .001), however the averages referring to the two phases were highlighted, for a further comparison between the two conditions.
Finally, the median relative to the percentage of smartphones present in the box for each statistical unit during the experimental phase was equal to 91.92% (interquartile distance = 9.02%; average = 91.23%).
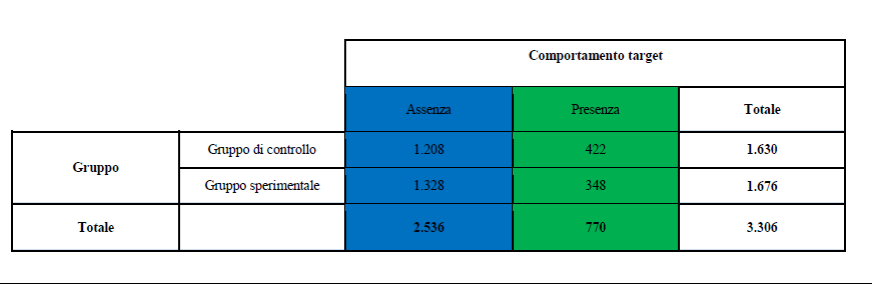
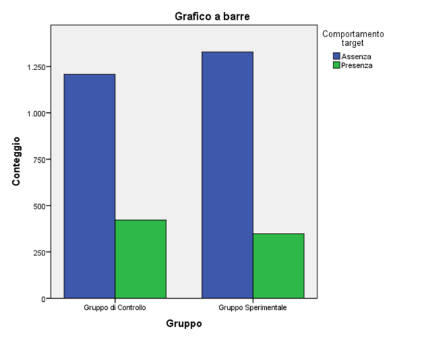
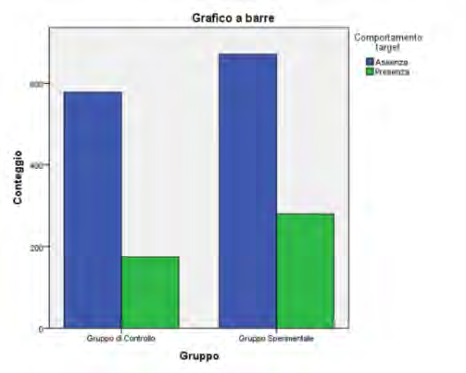
In the preliminary analysis to assess the relationship between the experimental group and the control group, based on the presence of interaction-absence of interaction with the smartphone (target behavior), a contingency table was created (Figure 6). Overall, 3306 observations were considered, from which those that referred to an empty table or occupied by one person were excluded.

As shown in Figure 7, from the statistical point of view, the probability of not using the smartphone was significantly higher in the experimental group than in the control group: χ2 (1, N = 3306) = 12.152, p = .000 [p < .050].
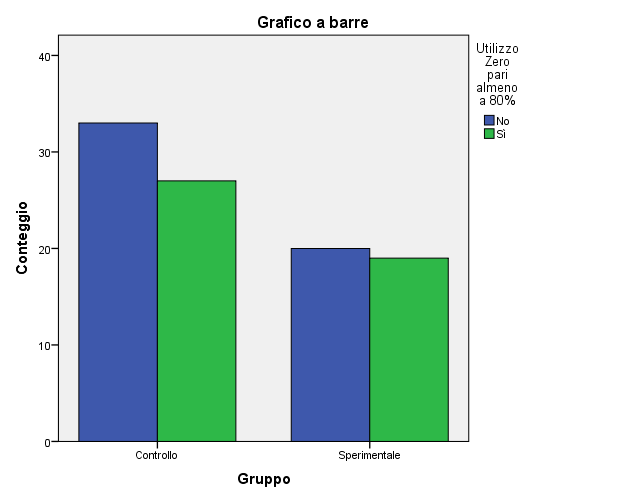
Measure 1: as regards to the percentage of time in which none of the subjects included in a specific statistical unit interacted with their smartphone, there were no statistically significant differences (U = 1097.000; p = .600) between the control phase (median = 76.04%; interquartile distance = 34.32%; average = 72.91%) and the experimental one (median = 79.17%; interquartile distance = 20.81%; average = 78.50%). Specifically, we chose to use the U test despite the normality of measure 1 (p = .097) to comply with the previous analyzes. In addition, 27 statistical units (45.0%) during the control phase and 19 (48.7%) during the experimental phase were characterized by the absence of smartphone use for at least 80% of the observations (Figure 8). From a statistical point of view, the probability of not using the smartphone for at least 80% of the observations was equivalent in the two conditions: χ2 (1, N = 99) = 0.131, p = .717 [p> .050].
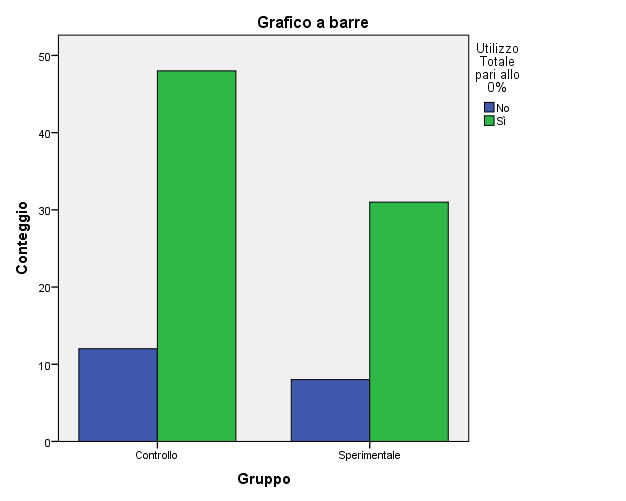
Measure 2: as regards to the percentage of time in which each of the subjects included in a specific statistical unit interacted with their smartphone, there were no statistically significant differences (U = 1149.500; p = .834) between the control phase ( median = 0.00%; interquartile distance = 0.00%; average = 3.19%) and the experimental one (median = 0.00%; interquartile distance = 0.00%; average = 1.32%). Specifically, we chose to use the U test, given the non- normality of measure 2 (p = .000), but the averages referring to the two phases were highlighted, for a further comparison between the two conditions. No statistical units were found (neither in the control phase nor in the experimental one) in which each of the subjects interacted with their smartphone for the duration of the same statistical unit. Furthermore, 48 of these (80.0%) during the control phase and 31 (79.5%) during the experimental phase presented the absence of observations characterized by “total use”, in which all subjects interacted with their smartphone (Figure 9). From a statistical point of view, the probability of not detecting observations characterized by a “total use” was equivalent in the two conditions: χ2 (1, N = 99) = 0.004, p = .950 [p> .050].
Measure 3: as regards to the maximum consecutive period of time within a specific statistical unit in which none of the subjects interacted with their smartphone, there were no statistically significant differences (U = 941.500; p = .101) between the control and experimental phase. In fact, during the control phase the median was equal to 215.00 seconds, or 3 minutes and 35 seconds (interquartile distance = 411.00 seconds; average = 342.00 seconds, or 5 minutes and 42 seconds), while during the experimental phase it was equal to 320.00 seconds, or 5 minutes and 20 seconds (interquartile distance = 455.00 seconds; average = 455.51 seconds, or approximately 7 minutes and 36 seconds). Specifically, the U test was chosen, given the non-normality of measure 3 (p = .010), but the averages referring to the two phases were highlighted, for a further comparison between the two conditions.
Measure 4: as regards to the percentage relating to the frequency of use of the smartphone within a specific statistical unit, there were no statistically significant differences (U = 1136.500; p = .810) between the control phase (median = 9.55 %; interquartile distance = 11.74%; average = 11.00%) and experimental (median = 8.46%; interquartile distance = 8.20%; average = 9.60%). We chose to use the U test, given the non-normality of measure 4 (p = .037), but the averages referring to the two phases were highlighted, for a further comparison between the two conditions.
In Catania the statistical units observed were 54: 33 (61.1%) in the control phase and 21 (38.9%) in the experimental phase. The Chi-square test could not be performed to calculate the distribution of people sitting at the tables. The calculation of the duration of the statistical units found significantly shorter residence times during the control phase (U = 232.500; p = .043). In the latter case, we chose to use the U test given the non-normality of the variable in question (p = .048). The median relative to the percentage of devices present in the box for each statistical unit during the experimental phase was 93.78% (interquartile distance = 6.92%; average = 92.96%).
In Noto, the statistical units observed were 45: 27 (60.0%) during the control phase and 18 (40.0%) in the experimental phase. As for the distribution of people sitting at the tables, the Chi-square test was not possible. As for the duration of the statistical units, there were no statistically significant differences between the two phases (U = 159,000; p = .051). In the latter case, we chose to use the U test given the non- normality of the variable in question (p = .006). Finally, the median relative to the percentage of devices in the smartphone storage box for each statistical unit during the experimental phase was 90.33% (interquartile distance = 13.28%; average = 89.22%).
In the preliminary analysis, a total of 1704 observations in Catania and 1704 in Noto were considered. From a statistical point of view, the probability of not using the smartphone was significantly higher in the experimental group than in the control group, both in Catania, Catania2 (1, N = 1704) = 8.260, p = .004 [p <.050], which in Noto, χ2 (1, N = 1704) = 13.329, p = .000 [p <.050] (Figure 10).
Measure 1: as already found in the overall analyzes, in Catania, as regards to the percentage of time in which none of the subjects included in a specific statistical unit interacted with their smartphone, there were no statistically significant differences (U = 323,000; p = .676) between the control and the experimental phase. Specifically, we chose to use the U test despite the normality of measure 1 (p = .343) to comply with the previous analyzes. Even in Noto, as regards to the percentage of time in which none of the subjects included in a specific statistical unit interacted with their smartphone, there were no statistically significant differences (U = 197.500; p = .290) between the control phase and the experimental one. Specifically, we chose to use the U test despite the normality of measure 1 (p = .304) to comply with the previous analyzes.
Measure 2: as already found in the overall analyzes, in Catania, as regards to the percentage of time in which each of the subjects included in a specific SU interacted with their smartphone, no statistically significant differences were found (U = 319,000; p = .332) between the control and the experimental phase. Specifically, we chose to use the U test, given the non-normality of measure 2 (p = .000), but the averages referring to the two phases were highlighted, for a further comparison between the two conditions. Also in Noto, as regards the percentage of time in which each of the subjects included in a specific SU interacts with their smartphone, there were no statistically significant differences (U = 228.000; p = .679) between the control phase and the experimental one. Specifically, we chose to use the U test, given the non-normality of measure 2 (p = .000), but the averages referring to the two phases were highlighted, for a further comparison between the two conditions.
Measure 3: as already found for the overall analyzes, in Catania, as regards to the maximum consecutive period of time within a specific statistical unit in which none of the subjects interacted with their smartphone, no statistically significant differences were found (U = 340.500; p = .915) between the control and the experimental phase. Specifically, we chose to use the U test despite the normality of measure 3 (p = .154) to comply with the previous analyzes. Instead in Noto, the maximum consecutive period of time within a specific statistical unit in which none of the subjects interact with their smartphone is significantly higher (U = 154,000; p = .039) in the experimental phase than in the control phase. In fact, during the control phase the median is equal to 145.00 seconds, or 2 minutes and 25 seconds (interquartile distance = 455.00 seconds; average = 339.44 seconds, or approximately 5 minutes and 39 seconds), while during the experimental phase it is equal to 600.00 seconds, or 10 minutes (interquartile distance = 630.00 seconds; average = 609.72 seconds, or approximately 10 minutes and 10 seconds). Specifically, we chose to use the U test despite the normality of measure 3 (p = .139) to comply with the previous analyzes.
Measure 4: as already found for the overall analyzes, in Catania, as regards to the percentage relating to the frequency of use of the smartphone within a specific statistical unit, no statistically significant differences were found (U=313.00; p =.551) between the control and the experimental phase. Specifically, we chose to use the U test despite the normality of measure 4 (p= .116) to comply with the previous analyzes. Also in Noto, as regards the percentage relating to the frequency of use of the smartphone within a specific statistical unit, there were no statistically significant differences (U= 228.500; p= .737) between the control and the experimental phase. Specifically, we chose to use the U test despite the normality of measure 4 (p = .330) to comply with the previous analyzes.
Discussion
Having the smartphone on the placemat reduces usage and increases the opportunities for interacting face-to-face with other diners. The intent of the intervention was to reduce a routine behavior implemented by many people (the use of their smartphone in the moments of aggregation), with a negative impact on the quality of interpersonal relationships [17], to increase behaviors conducive to socialization such as looking each other in the eye, smiling, speaking and / or comparing. To obtain this result, it was hypothesized that the presence of the Nudge, or rather a gentle push, could generate differences on the frequency of emission of the target behavior.
The null hypothesis was that the nudging intervention (the placemat with the information leaflet) did not lead to results other than those of the control group, which was not subjected to any intervention (absence of the placemat with the information leaflet).
In the experiment, the comparison between the two experimental and control groups showed, through the calculation of the chi square, resulted in a lower frequency of smartphone usage for the experimental group. However, the analysis of the four measures did not show significant differences. Only in Noto was there a significant difference compared to the control in terms of less interaction with the device.
The purpose of Nudge’s intervention was to modify the context in a simple and attractive way, with the aim of highlighting the social behavior that was considered the “desirable model”: to place your device on the placemat with the screen facing down and turn on the conversation. Social influence was thus exploited [18]: nudging relied on the fact that those who started to respond positively also influenced the behavior of the other diners driven to do this to avoid the state of unpleasant tension when one acts in a totally different way with respect to one’s fellowmen [19, 20]. The experiment used informative feedback to put the subject in contact with long-term contingencies. This procedure has made it possible to clarify the consequences of behavior in a given situation. The information was also structured in such a way as to leverage loss aversion and induce people to act promptly. The leaflet explained that by using the smartphone the man was losing quality in the relationship and for us humans losing something has an enormous cognitive weight [21]. When people are informed of the costs and benefits that derive from them and receive clear and explicit information on what to do and how to do it, they are more likely to engage in a certain action [22, 23]. In addition to the verbal prompt in the leaflet, images were used that suggested what behavior to adopt. Studies conducted by Lee, et al. [24] have shown that images, especially in color, influence the decision-making process more and facilitate the storage of information, working on automatic emotional processes. Since it is believed that the physical prompt alone is not sufficient to direct user behavior, clearly visible verbal suggestions (informative leaflet) were used to indicate the behaviors to be implemented.
The study has some limitations determined by being a research conducted in the field and not in the laboratory. The experiment proved effective from the preliminary analyzes point of view (this confirms that the way in which the options are presented influences the choices), but did not produce particular results as regards the other measurements, given the small number of samples. In order to have more reliable and clear results, it would be advisable to make further observations and have a larger sample available. Furthermore, given the multiplicity of the variables considered, it may be interesting to test the experiment in the same place, but at different times of the day.
The study only considered the frequency of smartphone usage without paying attention to the quality of interpersonal relationships between the convivial. The latter data could be useful to assess whether the use of the device is actually related to a decrease in interpersonal communication. Finally, due to privacy issues, it was not possible to make video observations that would undoubtedly have supported the observers in the detection of further data relating to the interactions existing between the subjects and their smartphone, providing a more precise observation method.
Considering the low cost of the intervention, however, the results seem promising and it would be interesting to extend the observations to different behaviors and also carry them out in other European contexts to test their generalizability. Although emerging research shows that it is young people, and especially university students, who make the most use of the device [25, 26], the research considered a sample of different ages, therefore it would be interesting to also discriminate the target and gender of smartphone users.
Resorting to gentle pushes and cognitive prods allows you to build an architecture of choices that, at no cost, induces people to improve their decisions on life, money and health, encouraging them in more aware, forward-looking and virtuous lifestyles.
Creating contexts that allow you to take “intermittent breaks” from using your smartphone is good for health and contributes to people’s intellectual and emotional well-being. In fact, in order to regenerate and reduce the possibility of activating habitual behaviors, the brain requires cyclical pauses and situations that stimulate different behaviors than those usually used. The context in which people find themselves making choices can be organized and structured becoming a real architectural product, in which every detail is relevant: it has its own weight and function.
Ethical Approval
All the procedures carried out comply with the ethical standards of the national research committee and the Helsinki declaration of 1964 with its subsequent amendments. The author declares that he has no conflicts of interest.
References
-
Lanaj K, Johnson RE, Barnes CM (2014) Beginning the workday yet already depleted? Consequences of late-night smartphone use and sleep. Organizational Behavior and Human Decision Processes 124(1): 11-23.
-
Palen L, Salzman M, Youngs E (2001) Discovery and integration of mobile communications in everyday life. Personal and ubiquitous computing 5(2): 109-122.
-
Monk A, Carroll J, Parker S, Blythe M (2004) Why are mobile phones annoying? Behaviour & Information Technology 23(1): 33-41.
-
Bianchi A, Phillips JG (2005) Psychological predictors of problem mobile phone use. Cyberpsychology & Behavior 8(1): 39-51.
-
Paragas F (2005) Being mobile with the mobile: Cellular telephony and renegotiations of public transport as public sphere. Mobile Communications, Springer, London, pp: 113-129.
-
Nikhita CS, Jadhav PR, Ajinkya S (2015) Prevalence of mobile phone dependence in secondary school adolescents. Journal of Clinical and Diagnostic Research 9(11): VC06-VC09.
-
Krasnova H, Abramova O, Notter I, Baumann A (2016) Why phubbing is toxic for your relationship: Understanding the role of smartphone jealousy among “Generation Y” users. AIS eLibrary, pp: 1-109.
-
Przybylski AK, Weinstein N (2013) Can you connect with me now? How the presence of mobile communication technology influences face-to-face conversation quality. Journal of Social and Personal Relationships 30(3): 237- 246.
-
Ugur NG, Koc T (2015) Time for digital detox: Misuse of mobile technology and phubbing. Procedia-Social and Behavioral Sciences 195: 1022-1031.
-
Karadağ E, Tosuntas SB, Erzen E, Duru P, Bostan N, et al. (2015) Determinants of phubbing, which is the sum of many virtual addictions: A structural equation model. Journal of Behavioral Addictions 4(2): 60-74.
-
McDaniel BT, Coyne SM (2016) Technoference: The interference of technology in couple relationships and implications for women’s personal and relational well- being. Psychology of Popular Media Culture 5(1): 85-98.
-
Roberts JA, David ME (2016) My life has become a major distraction from my cell phone: Partner phubbing and relationship satisfaction among romantic partners. Computers in Human Behavior 54: 134-141.
-
Thaler RH, Sunstein CR (2008) Nudge: Improving Decisions about Health, Wealth, Happiness. Yale University Press, New Haven.
-
Hershfield HE, Goldstein DG, Sharpe WF, Fox J, Yeykelis L, et al. (2011) Increasing saving behavior through age-progressed renderings of the future self. Journal of Marketing Research 48: S23-S37.
-
Jessoe K, Rapson D (2014) Knowledge is (less) power: Experimental evidence from residential energy use. American Economic Review 104(4): 1417-1438.
-
Kallbekken S, Sælen H, Hermansen EA (2013) Bridging the energy efficiency gap: A field experiment on lifetime energy costs and household appliances. Journal of Consumer Policy 36: 1-16.
-
Misra S, Cheng L, Genevie J, Yuan M (2014) The iPhone Effect: The Quality of In-Person Social Interactions in the Presence of Mobile Devices. Environment and Behavior 48(2): 275-298.
-
Petty RE, Cacioppo JT (1986b) The elaboration likelihood model of persuasion. Communication and persuasion, Springer, New York, NY, pp: 1-24.
-
Asch SE (1951) Effects of group pressure upon the modification and distortion of judgments. In: Guetzkow H, (Ed.), Groups, Leadership and Men; Research in Human Relations, Carnegie Press, Oxford, England, pp: 177-190.
-
Asch SE (1987) Social Psychology. Oxford University Press, USA.
-
Kahneman D (2013) Pensieri Lenti e Veloci. Oscar Saggi, Milano.
-
Leventhal H, Singer R, Jones S (1965) Effects of fear and specificity of recommendation upon attitudes and behavior. Journal of personality and social psychology 2(1): 20-29.
-
Nickerson DW, Rogers T (2010) Do you have a voting plan? Implementation intentions, voter turnout, and organic plan making. Psychological Science 21(2): 194- 199.
-
Lee L, Amir O, Ariely D (2009) In search of homo economicus: Cognitive noise and the role of emotion in preference consistency. Journal of Consumer Research 36(2): 173-187.
-
Massimini M, Peterson M (2009) Information and communication technology: Affects on US college students. Cyberpsychology: Journal of Psychosocial Research on Cyberspace 3(1).
-
Shambare R, Rugimbana R, Zhowa T (2012) Are mobile phones the 21st century addiction? African Journal of Business Management 62(2): 573-577.
- The Expanding Landscape of Road Rage: A Systematic Review of Conflicts Involving Drivers, Pedestrians, and Micromobility
- Validating Cognitive Models of Royal Navy Performance on Control Systems
- Comparing Standard and State-of-the-art Firefighter Coats on Postural Balance and Gait in a Live Burn Environment
- Investigating the Integration of Telemedicine into Clinicians Workflow: A Review of Methods
- Risk Assessment of Ergonomic Factors in a Textile Firm by RULA, REBA and Fine Kinney Methods
- Impact of Self-Esteem Training on Individuals with Disabilities Aged 17-30