Are you Really Social? Put your Smartphone Down. Using Nudge to Reduce the Frequency of use of Smartphones in Pub and Restaurants
To escape uninteresting conversations during an aperitif or a lunch break, in pubs and restaurants, people prefer to communicate with their smartphone rather than with those sitting next to them. This online contact led to greater isolation in real life and impaired relationships. The nudging technique called salience was used to increase face-to-face relationships and obtain a reduction in the frequency of use of the smartphone in the moments of aggregation, to gently push people to undertake specific behavior such as distancing themselves from their mobile device in moments intended for sharing. Research has shown that, by making the options more visible, in order to attract people's attention, it is possible to direct them to more appropriate choices. In fact, the data obtained showed that the experimental group had a reduction in frequency of smartphone usage in moments of aggregation, which suggests the effectiveness of intervention.
Introduction
The analysis of the effects of the smartphone on interpersonal relationships is extremely complex: The original intent of the smartphone device was to allow and facilitate the communication between people in different areas of the world. After some years it expanded its function giving everyone, regardless of personal technical-IT skills, the opportunity to develop multi-lateral interactions in order to obtain greater visibility and to move in the virtual world with reduced physical and mental effort. It has enhanced the sphere of social interactions to the point that everyone has become free to reach others everywhere, without the need to need to confront each other in the same place. A more fluid culture of social interactions was therefore born, based on instantaneous interactions, on immediate and non- predefined agreements, which made it possible to create diverse relationships, groups, organizations and institutions. It also facilitated highly informal and spontaneous cooperation [1, 2, 3].
All this, over time, has also proved to be a cost to people and the entire community. The new generations today can “disappear” in their smartphones, because instead of being bored while listening to an uninteresting conversation they can access video games, social networks or send sequential text messages with a simple click and have a conversation with a more stimulating interlocutor [4, 5, 6].
We prefer “mediated communication”, through our devices and its software, rather than face-to-face interaction [7]. This does not mean that humans are less social. It is the way of communication that has undergone a change [8]. Goffman’s observations [9, 10] on the behaviour of people in public places provided important information on the new rules of social interaction. Communicating through the smartphone does not simultaneously involve the five senses as occurs in face-to-face communication. Sitting in front of the table while another person talks to us, the ringing coming from the smartphone, which announces a call or message, becomes an element of distraction and gives rise to a feeling of exclusion in the other.
The 7% of a group interviewed in a study conducted by Pearson and Hussain [11] showed that when someone uses the mobile device during a conversation their partner or acquaintance feels abandoned or isolated. In doing so, the motivation for confrontation is lost, and empathy that is the ability to understand and trust that allows you to understand the thoughts and moods of another individual, decreases.
This data are confirmed in the study conducted by Przybylski and Weinstein [12]. The authors observed 74 strangers sitting in a restaurant, which they asked to talk in pairs, for ten minutes, on a specific topic (for example, the most interesting event of the last month). Participants’ assessments of the quality of the relationship (for example, “partner’s liking”) and the feelings associated with the other person (eg closeness, trust and empathy) turned out to be lower when the smartphone was present on the table. These differences were even more evident when the topic chosen in the discussion was significant for the person and related to his experience (the most important event for you, last year) rather than casual (considerations on the future holiday). The smartphone on the table was a source of distraction between couples and made face-to-face communication difficult.
This behavior is frequent in social situations, such as an aperitif or a dinner, in which people often deprive themselves of the company of those present to participate, both mentally and physically, in virtual relationships [13, 14, 15, 16, 17], focusing on other issues and shifting the focus out of the experience they are currently experiencing, without being aware of it [16, 18, 19, 20].
Nudge procedures, translated into Italian as “spinta gentile”, are useful when high cognitive effort or quick thinking is required and System 2 loosens grip on behavior and creates a situation in which there is little self-control [21]. Nudge does not use economic incentives or punishments in guiding people’s choices.
The literature demonstrates numerous interventions in which the use of salience has proven effective in directing people to engage in alternative behaviors such as the one carried out by Kallbekken and colleagues [22]. They showed how, after highlighting to buyers the information on energy cost of household appliances that these are oriented towards the purchase of energy-saving products. The salience is a nudging procedure that describes in concrete what to do in order not to incur a risk “you can do X and Y to reduce the risk of Z”, thus pushing people to emit a certain behavior. Another example is told by the psychologist Sunstein who was at a rock music festival with his daughter. A luminous sign, in addition to showing various messages, occasionally made the word “more water”, “more water” appear, followed by: “in the heat you sweat and lose water”. The organizers’ goal was to prevent possible problems related to dehydration, given the heat wave that hit the city of Chicago at the time. The authors of the initiative proved very attentive to how people think. They managed to find the perfect phrase to be directed without imposing anything, but by leveraging, with the second sentence, on the natural aversion of human beings to loss (in this case of water). We use colors, images, or, in the case of written texts, particular characters, suggestive forms that attract attention and imprint themselves in the memory by orienting the choices.
Nudge is a form of behavioral modification widespread in Italy thanks to the publication of the book «The gentle push» by Sunstain and Thaler (2008), which has captured the attention of researchers over time and is spreading like wildfire, even if slowly, in different regions of the nation.
Materials and Methods
The experiment, with an experimental group n=131 and a control group n=144, took place in three regions: Calabria, Lombardy and Sicily. The premises were chosen based on the willingness of the owners to participate in the initiative: in Calabria, a bathing establishment used as a restaurant and bar, the Marina Blu di Montepaone (CZ); in Lombardy, the Four Roses Pub, in the Motta Visconti area; in Sicily, the Razmataz Wine Bar in Catania.
The observations were made during the aperitif hours, from 18:00 to 24:00, by two independent observers.
All participants (n=275) were customers of different ages, sexes and ethnicities, who habitually or occasionally frequented the premises mentioned above. The statistical unit chosen for data analysis refers to the consecutive number of observations of people sitting at the tables. It changes every time the number of people sitting at the table changes.
Materials
The experimenters observed and evaluated the behaviour of people at the tables, with specific tools.
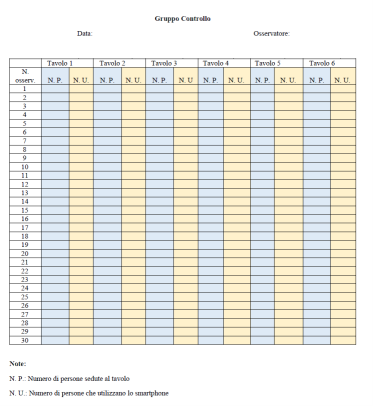
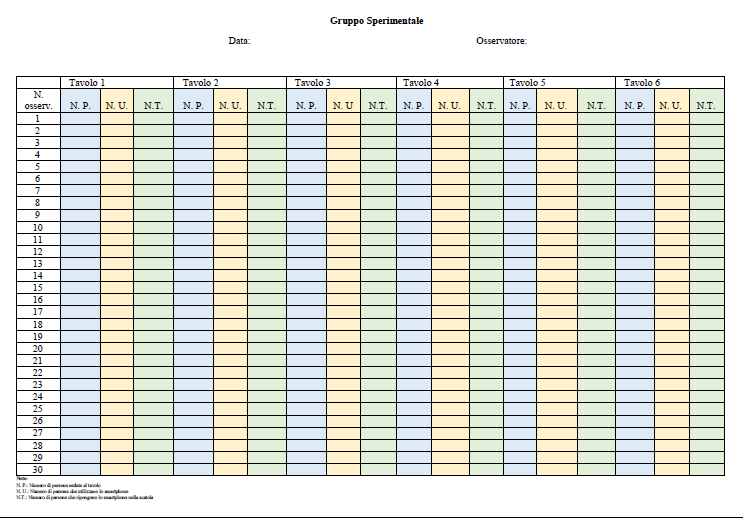
In the research form of observation created ad hoc for each phase of the research, both on the control board (Figure 1) and on the experimental board (Figure 2), there were boxes to record the number of people sitting at the table and the number of those who interacted with the smartphone. In the experimental research form, in addition to the control research form, there was a slot to record the number of devices inside each wooden box (Figure 2).
Other tools were also used:
- List of target behaviours (Table 1).
- Audio file that scanned the number of the table to be observed every 5, calibrated for the observation of six tables.
- Electronic device to play the audio file (smartphone of one of the two observers).
- Pair of earphones (two pairs, one for each observer).
- Jack splitter to connect the two pairs of earphones to the same electronic device that reproduced the audio file created ad hoc for observation.
- Behaviors to be marked as interaction with the smartphone
- Behaviors to be marked as non-interaction with the smartphone
- The subject picks up the smartphone and looks at it.
- The smartphone is kept on the table next to the person.
- The subject picks up the smartphone to call or send a message.
- The device is held on the legs but is not looked at.
- The subject touches their device to view notifications / time etc.
- The subject is alone at the table and uses the smartphone as a “distractor”.
- The subject picks up the smartphone and uses it as a sharing tool with the other components of the table (In this case the frequency of the behavior to be reported will be double: X = subject picking up the phone; X = subject (s) observing the smartphone).
- The device is taken in hand when going away, then it is slipped into a bag or held in the hand.
- The subject takes photographs or selfies (in this case the frequency of the behavior to be marked will be double: X
- = subject that takes the device in hand; X = subject(s) that observes the device and is part of the photo.
- You do not have good visibility of the contents of the box.
- The subject holds the smartphone in his hand without looking at it.
- The behavior of people sitting at the table is not clearly visible.
Table 1: The table illustrates the specific behaviors considered and agreed between observers such as “interaction with the
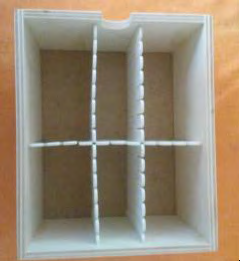
For the experimental group, a parallelepiped shaped wooden box with six internal dividers was used to facilitate the insertion of each customer’s smartphone (Figure 3). On the two longer sides of the box there was a transparent label with the image of a smartphone and a slogan: “Are you really social? #PutItDown”. The box was placed in the center of each table in the room.
Measures
During the control phase, before proceeding with the observation and detection of behaviours, the observers chose the most visible tables to be observed during the control and experimental phase, and agreed with the customers on the tables to be observed.
Two independent observers measured the frequency of customer use of the smartphone. In taking the data each observer compiled 5 observation grids for each phase of the intervention. The observations were anchored to a list of specific behaviours that served to describe in an objective and measurable way what was intended as “interaction with the smartphone”. These behaviours, reported in the table below (Figure 3), had been discussed among observers during the design phase.
The method chosen to record people’s behavior, applied in all observations, is Momentary Time Sampling (MTS).
With MTS, the observer records whether a behavior occurs at the end of a preset time interval. This procedure was chosen because the behaviors to be observed were prolonged such as making or receiving calls and text messages, checking the internet, playing games, etc., and in order to observe them, it is necessary to fragment the number of observations in small time intervals. Furthermore, it reliably measures long and/or heterogeneous behaviors; and it was effective for observing a large sample of people such as the one present in the rooms chosen for detection. Finally, it is less intrusive than other methods to record the time in which a certain behavior occurs, so that the experimenter is prevented from influencing the customer’s behavior or from being noticed. Customers were unaware of ongoing comments because this information could have altered their behavior. During the experiment, in fact, the observers were seated in the room in a table that allowed them to have a good view but, to appear as if they were any customers and not to be recognized by the customers, they inserted the observation grids inside the own menus. The ability of observers to quickly move their gaze between the tables without arousing suspicion among the customers of the restaurant was the result of previous exercises to carry out the research.
Procedures
Each restaurant was observed twice, on the same day agreed with the restaurant owner, for two consecutive weeks, from 6.00 pm to midnight. The days agreed with the restaurateur were Tuesday and Saturday. In the control phase (first time of observation), for each table observed, the number of people sitting at the table and the number of people interacting with the smartphone were recorded in the grids while in the experimental phase (second time of observation), the box was put at the center of the table and in addition to these two items the number of devices placed in the box was reported.
The observers agreed on which tables to observe and in what sequence, based on two criteria: visibility of people sitting and presence of at least two or more people at each table. Each observation string considered a total of 6 tables, observed in succession and kept the same for both phases of the research, for a total duration of 30 seconds (table 1 + table 2 + table 3 + table 4 + table5 + table 6). Each table was observed with a 5 second cadence. At the end of each observation, a 5 second pause was inserted in the audio file. The total duration of each observation string was therefore 35 seconds. The observers had headphones to listen to the audio file created specifically to measure time and synchronize the moment when it was necessary to move one’s gaze to the next table. To listen to both tracks of the audio file from a single device they used a splitter.
Each observation grid was constructed in such a way as to contain a total of 30 observations and the time required for compilation was 17 minutes and 30 seconds. The experimenters could consider the observation in the premises ended when they had filled all 5 observation grids.
Experimental Design
The experimental design is the between groups type, with an independent variable (non-intervention vs intervention) and two independent groups (control group vs experimental group) with repeated measurements on the dependent variable.
The dependent variable is the frequency of use of the smartphone within the two groups.
The independent variable is the smartphone storage box with the words “”Are you really social? #PutItDown”.
Data Analysis and Results
The expected result was the reduction in the frequency of use of the smartphone in presence of the independent variable (box). Specifically, it was expected that it would be lower in the experimental groups (independent variable presence) than in the control groups (independent variable absence). The null hypothesis was that there was no difference between frequency of use in the experimental group and in the control group.
Four result measurements were made for each statistical unit. During the surveys, 465 statistical units were identified, from which were excluded: statistical units with consecutive observations of less than four and statistical units with none or one person sitting at the table.
Overall, 190 statistical units were excluded, therefore the total number of those subjected to analysis was 275: 144 (52.4%) during the control phase and 131 (47.6%) during the experimental phase.
The Chi-square test was used for the comparison between nominal/categorical variables.
The Mann-Whitney U test was adopted to compare ordinal variables or interval/rational variables characterized by a non-normal distribution on two independent groups. All analyses were carried out with the SPSS version 20.0 of 2009. Finally, a score p <.050 was considered statistically significant for all the analyses carried out.
The observer agreement (IOA), i.e. the degree to which two or more independent observers report the same observation after measuring the same event, was assessed both in the control phase both in the experimental one. Specifically, it is based on the relationship between the number of agreements and the total number of agreements and disagreements between the two observers. The agreement percentages refer, in both phases of the research, to the percentage of crosses made by each observer on the observation grids.
During the control phase, the agreement between observers relating to the number of people seated at the tables ranged between 98.3% and 100%, while the percentage of the frequency of use of the smartphone ranged between 97.6% and 100%.
During the experimental phase, the IOA relating to the number of people seated at the tables oscillated between 99.1% and 100%, the frequency of use of the device oscillated between 96.9% and 100%, while the number of smartphones placed in the box fluctuates between 99.7% and 100%. The values obtained show a statistically significant reliability of the agreement between the observers, which allows the data obtained to be considered valid.
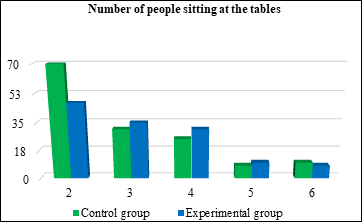
The statistical units consisted of a number of people sitting at the tables which ranged between two and six subjects. In the control group, 70 of these (48.6%) consisted of two people, 31(21.5%) of three people, 25(17.4%) of four people, 8(5.6%) of five people and 10(6.9%) by six people. In the experimental group, 47 statistical units (35.9%) consisted of two people, 35(26.7%) of three people, 31(23.7%) of four people, 10(7.6%) of five people and 8(6.1%) of six people (Figure 4). As for these distributions, no differences were found between the two statistically significant groups at the Chi-square test: χ2 (4, N = 275) = 5.248, p = .263 [p> .050].
Also with regard to the duration of the statistical units, no statistically significant differences were found (U = 8450.500; p = .136). Specifically, residence times were found at similar tables during the control phase (median = 740 seconds, equal to 12 minutes and 20 seconds; interquartile distance = 1400.00 seconds; average = 1026.81, equal to about 17 minutes and 7 seconds) and the experimental one (median = 915 seconds, equal to 15 minutes and 15 seconds; interquartile distance = 1085.00 seconds; average = 1192.60 seconds, equal to approximately 19 minutes and 53 seconds). In this case, we chose to use the U test given the non-normality of the duration of the statistical units (p = .000), but the averages referring to the two phases were highlighted, for a further comparison between the two conditions.
Finally, the median relative to the percentage of smartphones present in the wooden box for each statistical unit during the experimental phase (equal to the sum, multiplied by 100, of the mobile devices present in the box divided by the product between the number of people sitting at the table and the total number of observations) was 91.67% (interquartile distance = 7.29%; average = 84.57%).
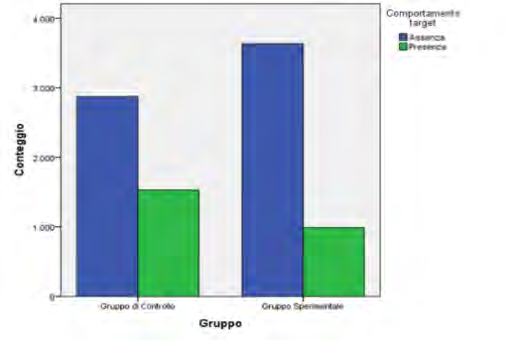
In the preliminary phase, intended to analyse the relationship between the experimental group and the control group based on the interaction-non-interaction with the device, a contingency table was created (Figure 5). Overall, 9029 observations were considered, excluding those that referred to an empty table or occupied by one person.
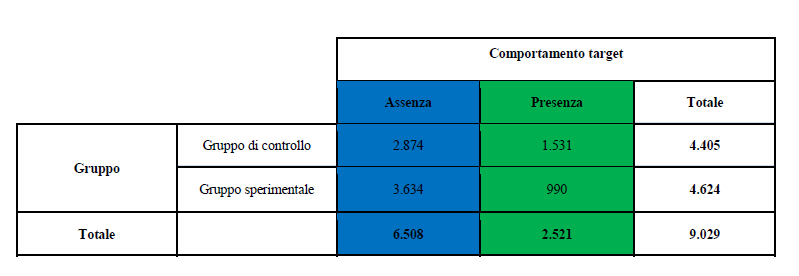
From a statistical point of view the probability of not using the smartphone was significantly higher in the experimental group than in the control group: χ2 (1, N = 9029) = 199.655, p = .000 [p <.050] (Figure 6).
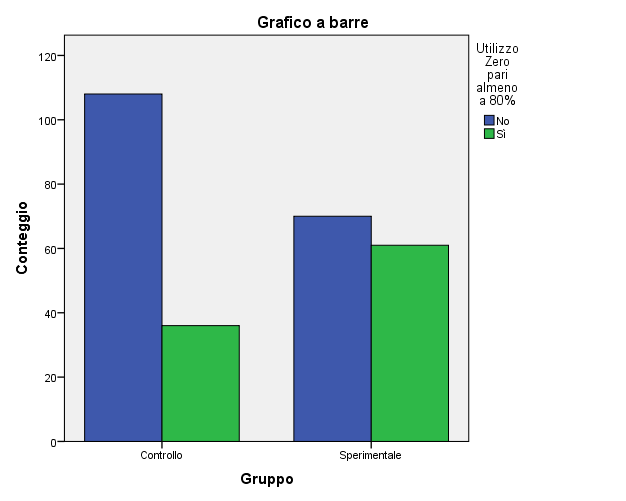
Measure 1: the percentage of time in which none of the subjects included in a specific statistical unit interacted with their smartphone was significantly higher (U = 6545.000; p = .000) in the experimental phase (median = 77.78%; interquartile distance = 20.14 %; average = 76.82%), compared to that of control (median = 69.57%; interquartile distance = 26.26%; average = 65.73%). Specifically, the U test was chosen, given the non-normality of measure 1 (p = .015), but the averages referring to the two phases were highlighted, to further clarify the difference between the two conditions. In addition, 36 statistical units (25.0%) during the control phase and 61 (46.6%) during the experimental phase were characterised by the absence of smartphone use for at least 80% of the observations (Figure 7). From a statistical point of view, the probability of not using the device for at least 80% of the observations was significantly higher in the experimental group than in the control group: χ2 (1, N = 275) = 13.972, p = .000 [ p <.050].
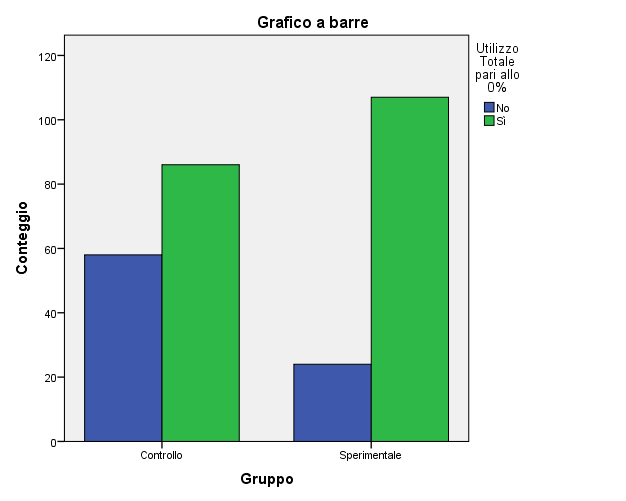
Measure 2: the percentage of time in which each of the subjects included in a specific statistical unit interacted with their smartphone was significantly higher (U = 7172.000; p = .000) in the control phase (median = 0.00%; interquartile distance = 7.61%; average = 5.92%) compared to the experimental one (median = 0.00%; interquartile distance = 0.00%; average = 1.62%). Specifically, the U test was chosen, given the non-normality of measure 2 (p = .000), but the averages referring to the two phases were highlighted, to further clarify the difference between the two conditions. There were no statistical units (in any of the two research phases) in which each of the subjects interacted with their smartphone for the duration of the same statistical unit. Furthermore, 86 of them (59.7%) during the control phase and 107 (81.7%) during the experimental phase presented the absence of observations characterised by a “total use”, in which all subjects interacted with their smartphone (Figure 8). From a statistical point of view, the probability of not detecting observations characterised by a “total use” was significantly higher in the experimental group than in the control group: χ2 (1, N = 275) = 15.803, p = .000 [p < .050].
Measure 3: the maximum consecutive period of time within a specific statistical unit in which none of the subjects interacted with their smartphone was significantly higher (U = 6884.500; p = .000) in the experimental phase than in the control phase. In fact, during the control phase the median was equal to 215.00 seconds, or 3 minutes and 35 seconds (interquartile distance = 315.00 seconds; average = 305.00 seconds, or 5 minutes and 5 seconds), while during the experimental phase it was equal to 355.00 seconds, or 5 minutes and 55 seconds (interquartile distance = 525.00 seconds; average = 493.63 seconds, or approximately 8 minutes and 14 seconds). Specifically, the U test was chosen, given the non-normality of measure 3 (p = .000), but the averages referring to the two phases were highlighted, to further clarify the difference between the two conditions.
Measure 4: the percentage relating to the frequency of smartphone use within a specific statistical unit was significantly higher (U = 5570.000; p = .000) in the control phase (median = 15.48%; interquartile distance = 15.58%; average = 17.84%) compared to the experimental one (median = 7.89%; interquartile distance = 8.58%; average = 9.48%). Specifically, the U test was chosen, given the non- normality of measure 4 (p = .000), but the averages referring to the two phases were highlighted, to further clarify the difference between the two conditions.
The results relating to the comparison between Calabria, Sicily and Lombardy are analysed below:
- Calabria: A total of 144 statistical units were observed, 77 (53.5%) during the control phase and 67 (46.5%) during the experimental phase. As regards the distribution of people seated at the tables, there were no statistically significant differences between the control group and the experimental group on the Chi-square test χ2 (4, N = 144) = 1.946, p = .746. The same applies to the duration of the statistical units (U = 2276.500; p = .225). In the latter case, we chose to use the U test given the non- normality of the variable in question (p = .000). Finally, the median relative to the percentage of smartphones present in the box for each statistical unit during the experimental phase was 92.59% (interquartile distance = 8.99%; average = 90.76%).
- Lombardy: A total of 29 statistical units were observed, 16 (55.2%) during the control phase and 13 (44.8%) during the experimental phase. As for the distribution of people sitting at the tables, the Chi-square test was not possible. As regards the duration of the statistical units, there were no statistically significant differences between the two phases of the research (U = 81.500; p = .322). In the latter case, it was decided to use the U test despite the normality of the variable in question (p =.380) to comply with the analyses conducted for the other samples. Finally, the median relative to the percentage of devices in the smartphone storage box for each statistical unit during the experimental phase was 23.81% (interquartile distance = 58.33%; average = 31.75%).
- Sicily. A total of 102 statistical units were observed, 51 (50.0%) during the control phase and 51 (50.0%) during the experimental phase. As for the distribution of people sitting at the tables, the Chi-square test was not possible. The duration of the statistical units did not reveal statistically significant differences between the two phases (U = 1249.000; p = .730). In the latter case, we chose to use the U test given the non-normality of the variable in question (p = .047). Finally, the median relative to the percentage of smartphones in the box for each statistical unit during the experimental phase was found to be 91.67% (interquartile distance = 7.29%; average = 84.57%).In the preliminary analysis overall, 5157 observations were considered in Calabria, 591 in Lombardy and 3281 in Sicily.
From the statistical point of view, the probability of not using the smartphone was significantly higher in the experimental group than in the control group in Calabria, χ2 (1, N = 5157)=164.039, p=.000 [p <.050], and in Sicily, χ2 (1, N = 3281) = 47.126, p = .000 [p <.050], but not in Lombardy, χ2 (1, N = 591) = 1.036, p = .309 [p>. 050].
Measure 1: as already found in the overall analyses, in Calabria the percentage of time in which none of the subjects included in a specific statistical unit interacted with their smartphone was significantly higher (U = 1621.500; p = .000) in the experimental phase (median = 78.38%; interquartile distance = 24.76%; average = 77.26%) than in control (median = 68.00%; interquartile distance = 20.91%; average = 66.31%). Specifically, we chose to use the U test despite the normality of measure 1 (p = .361) to comply with the previous analyses, but the averages referring to the two phases were highlighted, to further clarify the difference between the two conditions. Also in Sicily, the percentage of time in which none of the subjects included in a specific statistical unit interacted with their device was significantly higher (U = 877.000; p = .005) in the experimental phase (median = 76.19%; interquartile distance = 14.62%; average = 75.87%), compared to the control one (median = 68.75%; interquartile distance = 34.05%; average = 62.38%). Specifically, the U test was chosen, given the non- normality of Measure 1 (p = .020), but the averages referring to the two phases were highlighted, to further clarify the difference between the two conditions. In Lombardy, there were no statistically significant differences between the two conditions (U = 93.500; p = .629). Specifically, we chose to use the U test despite the normality of measure 1 (p = .105) to comply with the previous analyses.
Measure 2: as already found in the overall analyses, in Calabria the percentage of time in which each of the subjects included in a specific statistical unit interacted with their smartphone was significantly higher (U = 1780.500; p = .000) in the control phase (median = 0.00%; interquartile distance = 7.92%; average = 5.99%), compared to the experimental one (median = 0.00%; interquartile distance = 0.00%; average = 1.50%). The choice to use the U test is given by the non-normality of measure 2 (p = .000) and the averages referring to the two phases have been highlighted, to further clarify the difference between the two conditions. Also in Sicily, the percentage of time in which each of the subjects included in a specific statistical unit interacted with their smartphone was significantly higher (U = 1036.500; p = .030) in the control phase (median = 0.00%; interquartile distance = 7.69%; average = 5.36%), compared to the experimental one (median = 0.00%; interquartile distance = 0.00%; average = 1.66%). We chose to use the U test, given the non- normality of measure 2 (p = .000), but the averages referring to the two phases were highlighted, to further clarify the difference between the two conditions. In Lombardy, there were no statistically significant differences between the two conditions (U = 99.500; p = .764) and the U test was chosen, given the non-normality of measure 2 (p = .000).
Measure 3: as already found for global analyses, in Calabria the maximum consecutive period of time within a specific statistical unit in which none of the subjects interacted with their smartphone was significantly higher (U = 1496.500; p = .000 ) in the experimental phase compared to the control phase. In fact, during the control phase the median was 250.00 seconds, or 4 minutes and 10 seconds (interquartile distance = 245.00 seconds; average = 296.30 seconds, or approximately 4 minutes and 56 seconds), while during the experimental phase it was equal to 460.00 seconds, or 7 minutes and 30 seconds (interquartile distance = 630.00 seconds; average = 619.33 seconds, or approximately 10 minutes and 19 seconds). Specifically, the U test was chosen, given the non-normality of measure 3 (p = .000), but the averages referring to the two phases were highlighted, to further clarify the difference between the two conditions. In Lombardy, however, no statistically significant differences were found between the two conditions (U = 74.000; p = .187). In particular, during the control phase the median was equal to 180.00 seconds, or 3 minutes (interquartile distance = 289.00 seconds; average = 300.00 seconds, or 5 minutes), while during the experimental phase it was equal to 355.00 seconds, or 5 minutes and 55 seconds (interquartile distance = 753.00 seconds; average = 518.85 seconds, or approximately 8 minutes and 39 seconds). We chose to use the U test despite the normality of measure 3 (p = .180) to comply with the previous analyzes. Even in Sicily there were no statistically significant differences between the two conditions (U = 1184.500; p = .436). In particular, during the control phase the median was equal to 215.00 seconds, or 3 minutes and 35 seconds (interquartile distance = 420.00 seconds; average = 319.71 seconds, or approximately 5 minutes and 20 seconds), while during the experimental phase it was equal at 250.00 seconds, or 4 minutes and 10 seconds (interquartile distance = 210.00 seconds; average = 322.06 seconds, or approximately 5 minutes and 22 seconds). The choice to use the U test is given by the non-normality of measure 3 (p = .002).
Measure 4: as already found for global analyzes, in Calabria the percentage relating to the frequency of use of the smartphone within a specific statistical unit was significantly higher (U = 1371.500; p = .000) in the control phase (median = 16.07%; interquartile distance = 11.99%; average = 17.25%) compared to the experimental one (median = 7.41%; interquartile distance = 8.99%; average = 9.18%). Specifically, we chose to use the U test despite the normality of measure 4 (p = .075) to comply with the previous analyzes, but the averages referring to the two phases were highlighted, to further clarify the difference between the two conditions. Also in Sicily, the percentage relating to the frequency of smartphone use within a specific statistical unit was significantly higher (U = 691.000; p = .000) in the control phase (median = 16.29%; interquartile distance = 15.28%; average = 18.73%), compared to the experimental one (median = 8.33%; interquartile distance = 7.12%; average = 10.05%). Specifically, the U test was chosen, given the non- normality of measure 4 (p = .016), but the averages referring to the two phases were highlighted, to further clarify the difference between the two conditions. In Lombardy, there were no statistically significant differences between the two conditions (U = 89.000; p = .491). Specifically, it was decided to use the U test despite the normality of measure 4 (p = .024) to comply with the previous analyzes.
Discussion
Keeping your smartphone next to your plate while eating is now a habit, that is, an automatic behaviour that is repeated in a given context or situation and is the product of three phases: signaling, gratification and routine [23]. For example, sitting at a table with friends, if the conversation is not very interesting and leads to getting bored, the mere sight of your device (emotional and physical stimulus) leads us to take it in hand (routine), feeling pleasure in the activities it mediates (gratification). The brain thus associates the device with the elimination of boredom and this means that every time we feel bored or have a free minute, we will take the smartphone in our hand. Habits, although many times they can be useful in daily life because they allow us not to overload our brain, in other cases such as the one described, are harmful.
Leaving the smartphone in the wooden box reduces the time in which it can be used and increases the opportunities for interacting face-to-face with other diners. The intent of the intervention was to reduce a routine behaviour implemented by many people (the use of the smartphone in the moments of aggregation), with a negative impact on the quality of interpersonal relationships [24], to increase behaviours conducive to socialisation such as looking each other in the eye, smiling, speaking and/or comparing. To obtain this result, it was hypothesised that the presence of the Nudge, or rather a gentle push, could generate differences on the frequency of emission of the target behaviour.
The null hypothesis was that the nudging intervention (the presence of the box in the center of the table) did not lead to results other than those of the control group, which was not subjected to any intervention (absence of the box in the center of the table).
In the experiment the results showed that the percentage of time spent by the subjects without the use of the smartphone in each statistical unit was higher in the experimental phase, compared to the control phase. Specifically, these results are widely confirmed in Calabria and Sicily while in Lombardy there were no statistically significant differences between the two conditions. The percentage of time in which all the subjects included in a statistical unit interacted with their device is significantly higher in the control phase than in the experimental phase. Again in Lombardy, no significant differences were found with respect to the control. Overall, the maximum consecutive period of time within a specific statistical unit in which none of the people interacted with their smartphone was significantly higher in the experimental phase than in the control phase, but only in Calabria. The percentage relating to the frequency of use of the smartphone is greater in the control phase than in the experimental phase. These results are valid in Sicily and Calabria while in Lombardy no particularly significant differences emerged between the two conditions.
The purpose of Nudge’s intervention was to modify the context in a simple and attractive way, with the aim of highlighting the social behaviour that was considered the “desirable model”: lay your device (“Are you really social? #PutItDown”). Social influence was thus exploited [25]: nudging relied on the fact that those who started to respond positively also influenced the behaviour of the other diners driven to do this to avoid the state of unpleasant tension when one acts in a totally different way with respect to one’s fellowmen [26, 27]. The experiment used the principle of salience to make the information necessary to direct the attention of the people sitting at the tables to a certain option / information immediately visible and accessible (store their device in a specific place). The salient stimuli, precisely because they are evident, are picked up, processed and memorized by the human brain automatically and guide behavior in a predictable choice [28]. The use of the slogan on the physical prompt (box) “Are you really social? #PutItDown” with the image of the phone, had an ironic function because irony was seen to put people in a good mood and when people are in a good mood, they make decisions in an impulsive and faster way [29, 30, 31] and are more subject to the influence of contextual stimuli.
It is therefore possible to say that Nudge is effective in decreasing the frequency of use of the smartphone, despite the charm it exerts on people, conditioning them to spend more time with technology and less with other human beings [32]. The intervention confirmed that individuals are systematically influenced by the context in which they make their decisions and that both the way the option is presented and the group choices are elements that condition people’s choices [33]. The study has some limitations determined by being a research conducted in the field and not in the laboratory. To have more reliable and clear results, it would be advisable to make further observations and have a larger sample available. Furthermore, given the multiplicity of the variables considered, it may be interesting to test the digital detox experiment in the same place, but at different times of the day.
Considering the low cost of the intervention, however, the results seem promising and it would be interesting to extend the observations to other European contexts to test their generalizability. Creating contexts that allow you to take “intermittent breaks” from using your smartphone is good for health and contributes to people’s intellectual and emotional well-being. In fact, in order to regenerate and reduce the possibility of activating habitual behaviors, the brain requires cyclical pauses and situations that stimulate different behaviors than those usually used. The context in which people find themselves making choices can be organized and structured becoming a real architectural product, in which every detail is relevant: it has its own weight and function.
Ethical Approval
All the procedures carried out comply with the ethical standards of the national research committee and the Helsinki declaration of 1964 with its subsequent amendments.
References
-
Geser H (2006) Are girls (even) more addicted? Some gender patterns of cell phone usage. Sociology of the Mobile Phone, Switzerland.
-
Walsh SP, White KM, Young RM (2009) The phone connection: A qualitative exploration of how belongingness and social identification relate to mobile phone use amongst Australian youth. Journal of Community & Applied Social Psychology 19(3): 225-240.
-
Puryear C, Reysen S (2013) A Preliminary Examination of Cell Phone Use and Helping Behavior. Psychological Reports 113(3): 1001-1003.
-
Wei R, Leung L (1999) Blurring public and private behaviors in public space: policy challenges in the use and improper use of the cell phone. Telematics and Informatics 16(1-2): 11-26.
-
Bindley K (2011) When children text all day, what happens to their social skills? Huffington Post.
-
Elphinston RA, Noller P (2011) Time to face it! Facebook intrusion and the implications for romantic jealousy and relationship satisfaction. Cyberpsychology, Behavior, and Social Networking 14(11): 631-635.
-
Keller M (2013) Social media and interpersonal communication. Social Work Today 13(3): 1-10.
-
Wagner LA (2015) When Your Smartphone is Too Smart for Your Own Good: How Social Media Alters Human Relationships. Journal of Individual Psychology 71(2): 114-121.
-
Goffman E (1963) Behavior in Public Places: Notes on the Social Organization of Gatherings. Free Press, New York.
-
Goffman E (1971) Relations in Public: Microstudies of the Public Order. Harper & Row, New York.
-
Pearson C, Hussain Z (2015) Smartphone Use, Addiction, Narcissism, and Personality. International Journal of Cyber Behavior, Psychology and Learning 5(1): 17-32.
-
Przybylski AK, Weinstein N (2013) Can you connect with me now? How the presence of mobile communication technology influences face-to-face conversation quality. Journal of Social and Personal Relationships 30(3): 237- 246.
-
Plant S (2000) The effects of mobile telephones on social and individual life. Report commissioned by Motorola.
-
Geser H (2002) Sociology of the mobile phone. Unpublished manuscript, University of Zurich, Switzerland.
-
Ling R (2004) The mobile connection: The cell phone’s impact on society, 1st (Edn.), Morgan Kaufmann, Elsevier.
-
Srivastava L (2005) Mobile phones and the evolution of social behaviour. Behaviour & Information Technology 24(2): 111-129.
-
Turkle S (2011) Alone together: Why we expect more from technology and less from each other. Basic Books, New York, NY.
-
Strayer DL, Johnston WA (2001) Driven to distraction: Dual-task studies of simulated driving and conversing on a cellular telephone. Psychological Science 12(6): 462-466.
-
Shah J (2003) The motivational looking glass: How significant others implicitly affect goal appraisals. Journal of Personality and Social Psychology 85(3): 424- 439.
-
Strayer DL, Drews FA, Johnston WA (2003) Cell phone- induced failures of visual attention during simulated driving. Journal of Experimental Psychology: Applied 9(1): 23-32.
-
Thaler RH, Sunstein CR (2008) Nudge: Improving Decisions about Health, Wealth, and Happiness. Yale University Press, New Haven, CT.
-
Kallbekken S, Sælen H, Hermansen EA (2013) Bridging the energy efficiency gap: A field experiment on lifetime energy costs and household appliances. Journal of Consumer Policy 36: 1-16.
-
Wood W, Neal DT (2007) A new look at habits and the habit-goal interface. Psychological Review 114(4): 843-
-
Misra S, Cheng L, Genevie J, Yuan M (2014) The iPhone Effect: The Quality of In-Person Social Interactions in the Presence of Mobile Devices. Environment and Behavior 48(2): 275-298.
-
Petty RE, Cacioppo JT (1986b) The elaboration likelihood model of persuasion. Communication and persuasion, Springer, New York, NY, pp: 1-24.
-
Asch SE (1951) Effects of group pressure upon the modification and distortion of judgments. In: Guetzkow H, (Ed.), Groups, Leadership and Men; Research in Human Relations, Carnegie Press, Oxford, England, pp: 177-190.
-
Asch SE (1987) Social Psychology. Oxford University Press.
-
Kahneman D, Treisman A (1984) Changing views of attention and automaticity. In: Parasuraman R, Davis DR, (Eds.), Varieties of attention, Academic Press, San Diego, pp: 29-61.
-
Bodenhausen GV (1993) Emotions, arousal, and stereotypic judgments: A heuristic model of affect and stereotyping. Affect, cognition and stereotyping, pp: 13- 37.
-
Braverman J (2005) The effect of mood on detection of covariation. Personality and Social Psychology Bulletin 31(11): 1487-1497.
-
Schwarz N, Bless H, Bohner G (1991) Mood and persuasion: Affective states influence the processing of persuasive communications. Advances in experimental social psychology 24: 161-199.
-
Griffiths MD (2000) Does Internet and computer “addiction” exist? Some case study evidence. Cyberpsychology & Behavior 3(2): 211-218.
-
Kahneman D (2013) Slow and Fast Thoughts. Oscar Saggi, Milan.
- The Expanding Landscape of Road Rage: A Systematic Review of Conflicts Involving Drivers, Pedestrians, and Micromobility
- Validating Cognitive Models of Royal Navy Performance on Control Systems
- Comparing Standard and State-of-the-art Firefighter Coats on Postural Balance and Gait in a Live Burn Environment
- Investigating the Integration of Telemedicine into Clinicians Workflow: A Review of Methods
- Risk Assessment of Ergonomic Factors in a Textile Firm by RULA, REBA and Fine Kinney Methods
- Impact of Self-Esteem Training on Individuals with Disabilities Aged 17-30