Statistics Elements for Vehicle Vibration Testing
Presented considerations of this work includes selected issues in the area of statistical procedures use in vibration measures study and modal analysis methods to assess the vehicles state. The indicated statistical procedures are particularly important in vibration and modal research, where the multidimensionality of diagnostic signals requires a wide application of various statistical procedures at the stage of processing and decision-making. This paper presents the MATLAB program for determination of the Symptoms matrix, software tools for reading and exporting files to the unv format, the Optimum computer algorithm, the Singular Values Decomposition (SVD) computer algorithm and the state matrix analysis program using the MAC theory.
Introduction
The achievements presented in this work are a result from the implementation of many studies related to the description and statistical verification of the vibrational energy distribution usefulness in the state degradation assessment. Both the developed field of vibration diagnostics and applied modal analysis methods are based on the vibration process and use in the research as basic - different vibration estimators. The physical aspects of the vibration process are described in terms of time, frequency and amplitudes, giving in practice a large number of measures (often in excess) of the energy distribution containing a lot of information about the processes studied (objects). This forces the need for widespread use of statistical methods when developing research results for making rational decisions.
Diagnostic experiments should enable quantitative assessment and in-depth analysis of destructive processes occurring in constructions and vehicles, mainly at the stage of use and maintenance. An in-depth analysis of the results of the experiment, which is the basis for the operational decisions to be taken, should each time contain answers to users’ questions [1, 2].
- How to successfully recognize the technical condition of a structure, in general.
- How long and under what load can the system operate for the next technical support.
- How to change or shape the system load for maintaining task ability.
- What are the most advantageous ways and means of renewing the system.
- How to protect the system against the destructive effects of external factors.
Only a comprehensive application of diagnostics and effective diagnostic procedures for the state, distinguished in dedicated diagnostic experiments, guarantee the reliable operation of technical systems in the adopted structures of exploitation [3, 4, 5].
Modern technical diagnostics very widely uses the possibilities offered by such a universal tool as virtual engineering. For a more effective use of these possibilities, there is a need to constantly search for new, more effective tools supporting the diagnostic process, as well as modeling phenomena whose characteristic parameters allow monitoring the increasing number of available symptoms [6, 7].
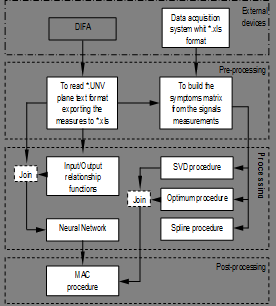
The technical systems state analysis is compound for a set of mathematical procedures that they can be related to each other to develop analysis of superior order and to find relationships between procedures and states in different systems. There are many relationships that can be possible with the procedures, in this work is proposed only a few relations (Figure 1), it is possible to formulate other relations of procedures to do another kind of methodologies or analysis.
Authors of many studies assessing the correctness of diagnostic procedures most often use single-criterion indicators, which do not consider in detail the impact of operating conditions of technical means (the changing model of destruction) on the quality of formulated decisions (diagnoses and forecasts) [1, 8]. This is due to the fact that the status recognition procedures are very sensitive to the complexity of the system structure and the randomly variable wear process. There is, therefore, a need to conduct sensitivity tests of these procedures depending on factors characteristic of the actual conditions of existence in service [9, 10, 11].
In modern technical systems, considering technological advances as well as developed and available possibilities for signal acquisition and processing, it is possible to obtain a large amount of information from signals registered in various system states. This information must be processed and interpreted by the available procedures for the statistical processing of results, which is often used by technical staff to determine the status [7]. Recognition of the degradation status of a complex system is based on a multidimensional analysis, for which it is possible to assess the relations between variables whose values have changed as a result of the developing damage [3, 12].
More and more often, dynamic state identification tests used to assess changes in the state of degradation, damage development and location of causes of the condition were the basis for the development of a specialized statistical software system. It enables acquisition and processing of measurement data, creation of many measures of diagnostic signals, testing their diagnostic sensitivity, statistical analysis of results and diagnostic inference [6, 11].
The subject of this work includes selected fragments of important research issues in the following areas:
- Statistical procedures in the measurement of vibration energy flow measurements (acquisition, ordering, redundancy, modeling and presentation of results).
- Estimators of vibration diagnostics in studies of degradation of the condition of structures and construction vehicles (identification of needs and formulating requirements for measures, processes, products and constructions).
- Rules for the use of modal analysis methods in the examination of structures and construction vehicles (rules and procedures for practical applications).
- Maintaining the fitness of structures and technical facilities (shaping technical readiness and safety in the operation of facilities, introduction of new technologies and technical solutions, design, construction and rational use).
Studies of energy distribution measures (in vibration diagnostics and modal analysis methods) are used in many fields as a result of displacement, velocity or deformation measurements. Indirectly they serve to quantify the characteristics of material properties, e.g. functional properties, the state of destruction of the structure or the load-bearing capacity of old vehicles. They can also be used in structural quality tests to detect damage affecting the fatigue properties of a structure. Vibration assessments of engineering structures degradation also enable assessment of the degradation status of vehicles, elements and structures, assessment, or composite panels used in industry.
Measurements of energy distribution used in the studies use various estimators of vibration diagnostics and modal analysis, the usefulness of which in indicated areas should be assessed by dedicated and specialized statistical procedures.
Statistical Research Space
All studied mass phenomena are characterized by certain regularities, which are difficult to study and not all are detected and investigated. Statistical assessments used for this characterize the quantitative side of the studied phenomena in an inseparable connection with their qualitative side. It should be remembered that in nature there are no numbers used by statistics, but only things and processes [2, 8].
Statistical methods using a numerical description make it possible to make the necessary generalizations of a large amount of detailed information. By using generalized statistical methods to make the necessary generalizations in the statistical description, order is introduced in the apparent chaos of random events. This allows detection of regularity in the form of cause and effect relationships occurring in the studied phenomena [13, 14].
The massiveness of the data requires the use of computer-aided research in the field of methods and means of modeling, acquisition, processing, inference, visualization, dissemination and storage of information. The current development of science requires from engineers the use of modern computer applications, thanks to which it becomes possible to make complex calculations and to analyze the obtained results in a short time.
In general, the proposed methodology for studying the consumption state includes detailed procedures for the development of: a data acquisition system and their processing and statistical inference - repetitive in many issues of testing many measures of vibration signals.
The control tools of the considerations are the proposed statistical procedures (Figure 2) that make up the measurement system of vibration energy propagation (acquisition, ordering, redundancy, modeling and presentation of results from tests and measurements) [1, 3, 15].
The obtained research data (uncertain, incomplete, random) are subjected to analysis and assessment of regularity in the field of mass phenomena. For the purpose of highlighting the main components of the observation matrix, the obtained results are combined into control charts, which are subjected to painstaking research in the scope of:
Data Presentation
- Statistical series: detailed, distributive, temporary.
- Statistical plots: linear, bar, point.
- Statistical tables: working - raw statistical material subjected to further processing.
Use Statistical Tools to Describe the Structure of the Community
- Arithmetic mean - average value.
- Geometric mean - used to examine relative changes in a given feature.
- Dominant - the value of which is the most probable.
- Range - difference between the maximum value and the minimum value of a given feature.
- standard average deviation of the value of a given feature from its arithmetic mean,
- Variance - the arithmetic mean of the squares deviations of the value of the feature from its arithmetic mean.
- Coefficient of variation - determines the degree of diversification of a given feature in the whole population.
- Asymmetry coefficient - determines the direction and strength of asymmetry.
- Concentration factor (kurtosis).
These analyzes determine the initial and justified selection of qualitative measures, further processed to highlight the components to the main model. Statistical analysis of the acquired data is also the basis for many interesting description and trends of the events studied. Basic statistical surveys use many methods for qualitative and quantitative analysis of the data obtained. These include analysis of variance, correlation analysis, regression analysis, factor analysis, discriminant analysis, time series analysis, canonical analysis, others, generally available in various informational statistical procedures [8, 5].
The MATLAB program is used for basic engineering applications used in the analysis of results. This program is used for computer calculations, combining data logging and processing, specialized calculations, visualization and an easy-to-use programming environment [14]. The program contains the following applications:
- Mathematical algorithms and their calculation.
- The creating own calculation algorithms.
- Modeling and simulation algorithms.
- Data analysis and visualization.
- Engineering graphics applications.
- Application for creating own programs, creating their interface and graphical data analysis.
Depending on the application, the program includes specialized packages of calculation procedures from any areas of knowledge called toolboxes, for example: SIMULINK, Signal Processing Toolbox, STATGRAF, STATISTICA and others. Such packages make it possible to obtain basic knowledge in a given scope and apply this knowledge to solve problems [11, 13]. Statistical procedures in studies of vibration energy propagation measures supports the conducted experiments and have been verified in many publications describing vibration tests, modal analyzes and ex-test systems.
To accomplish the objectives of the above tasks, an engineering application was developed: State Examination Procedures (PBS) - enabling the generation of dedicated sets of variables of independent symptoms of the degradation status of the tested structures and vehicles.
Main Elements of the Developed PBS System
Identification tests of structures and vehicles used to assess changes in the condition, damage development and location of causes of the existing condition constitute the basis for creating a specialized software system for statistical procedures. Modules of the developed system enable acquisition and processing of measurement data, creation of many signal measures, testing their sensitivity, statistical elaboration and inference. The program modules correspond to the subsequent stages of the statistical survey of technical objects [5, 12, 13].
The processing of vibration processes to obtain the values of the vibration signal (estimators) allows you to generate own and mutual measures of the vibration signal that are used in various applications. The dialog boxes of the proposed module “Symptoms” used to generate own and mutual measures of the signal are shown in Figure 3.
![Figure 3: Module window with the generated matrix of vibration estimators [5,11].](/fulltextimages/8482/fig_3.png)
The Ideal Point Method – OPTIMUM
Measured signals represent the space of observation, and indirectly the development of damages in the structure or construction vehicles. Using optimization, you can characterize the sensitivity of measured symptoms to state changes based on distance measurements from the ideal Smtx czas σ = j j j f S
1 Variation coefficient
f f f
1 * 1 1 max j j
= ( ) j Correlation coefficient Yes
Correlation coeff.
No j j S S f S
Yes j j Sensibility sympt.
Sensibility of symptoms
No
| ΘT ⋅S f23 j= ST⋅S j j | T ⋅S | 2 j | |
|---|---|---|---|
| ST⋅S j j | ΘT ⋅Θ |
$$ f _ {2} ^ {*} _ {j} = \left| \frac {f _ {2} ^ {*} _ {j}}{\max \left(f _ {2} _ {j}\right)} \right| $$ j f f f ( ) j j ( ) ( ) $$ L _ {j} = \sqrt {\left(1 - f 1 _ {j} ^ {*}\right) ^ {2} + \left(1 - f 2 _ {j} ^ {*}\right) ^ {2}} $$
1 $$ w _ {j} = \frac {1 / L _ {j}}{\sum \left(1 / L _ {j}\right)} $$
j j ( )
1 j Sort L
1 2 n L L L < < < Λ
The algorithm presented below enables statistical evaluation of individually elaborated symptoms, resulting in the final qualitative ranking list of their sensitivity and usefulness. The next steps of this procedure and its result are shown in Figure 4.
( )
1 2 , $$ \frac {1}{j} = \frac {C (\Theta , S)}{\sqrt {C (\Theta , \Theta) \cdot C}} $$ j j j C S f C C S S j ( ) ( ) , , $$ f _ {2} ^ {2} _ {j} = \left| \frac {S _ {j _ {\max}} - S _ {j _ {\min}}}{\bar {S} _ {j}} \right| $$ Figure 4: Optimum Procedure Algorithm and an Example of its Result [11].
Having statistically significant good symptoms, it is possible to build cause and affect models on the state conclusion stage. However, the quality of the model depends on the number of measures taken, which can be indirectly estimated in the simplest regression models with the R2 coefficient [4, 10].
Multidimensional System Observation - SVD
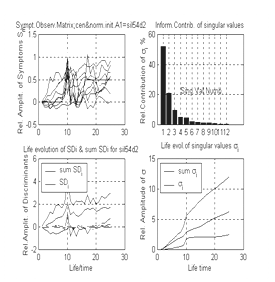
SVD (Singular Value Decomposition) is a numerical procedure for multivariate tracking of changes in an object’s degradation state. Detects evolving lesions and selects the maximum informational status symptoms (quantitative assessment) in a given research situation. The procedure uses all measured signals to assess changes in the state of the technical system under study, without losing any information possible to obtain. The algorithm of the method and an exemplary result of the applied procedure are presented in Figure 5.
The SVD procedure in the newer software implementations is modular (base) and allows further development of the algorithm, automatically searching for unnecessary measurement symptoms for a given research topic.
Information System for Degradation Studies
The degradation status identification tests of various technical facilities are increasingly the basis for the creation of a specialized software system. This program includes software for the needs of: vibration acquisition, processing, statistical inference and visualization. It enables the acquisition and processing of measurement data, the creation measures of diagnostic signals, their testing of sensitivity, statistical elaboration and diagnostic inference.
The presented procedures of statistical surveys are the sum of experience from theoretical and experimental research of the field of vibration and modal testing, supported by statistical procedures [10, 17]. The program structure is a modular structure composed of the following modules Figure 6.
![Figure 5: The algorithm of the SVD procedure and an exemplary result of its operation [8,10].](/fulltextimages/8482/fig_5.png)
Figure 6: Main dialog window of the proposed statistical survey system [3, 10, 11]. A. Read .unv module that allows processing from UNV format to XLS format. B. Symptoms module that allows defining, determining and creating a matrix of many measures of vibration processes. Modules A and B form part of the software responsible for acquiring and processing vibration processes in order to obtain a matrix of observations of vibration estimates. C. The Optimum module uses the ideal point method for individual assessment of the qualitative sensitivity of the measured symptoms of vibration processes. D. SVD module (multidimensional description of the state of the tested object) used to quantify the generalized damage measures and to assess the damage development. E. Input / Output module used to analyze the similarity of vibration processes and to determine various operational measures of the tested object. F. Optimization module used to develop models and data in genesis (methods of approximation and interpolation), diagnosing and forecasting states. G. Network module using neural networks to classify states based on the obtained results in the form of time series. Modules C, D, E, F, G are elements of statistical inference and evaluation of cause-and-effect relations, and also serve to visualize the results obtained. H. The MAC module is a procedure allowing the comparison of different vectors treated as a measure on the entry and exit of a system.
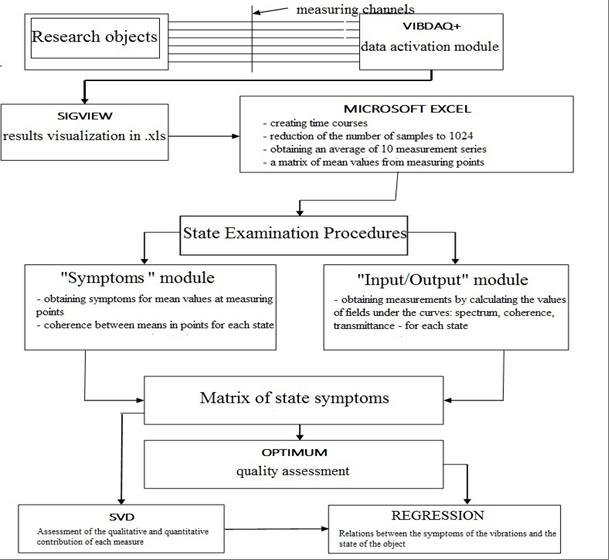
The exemplification of the developed solutions was carried out in the operational tests of selected objects (railway transport system, construction elements and vehicles, internal combustion engines, gears, bearings) in which verification of modeling procedures and degradation status was carried out on the basis of actual signal measurements.
Summary
More and more frequently conducted technical systems identification tests, also used to assess changes in this condition, damage development and location of the existing condition, constitute the basis for the creation of a specialized statistical survey system.
It enables the acquisition and processing of measurement data, the creation of many measures of diagnostic signals, their testing of diagnostic sensitivity, statistical elaboration and diagnostic inference.
The content of this study is the sum of experience from theoretical and experimental research in the field of vibration and modal research of various objects, supported by statistical procedures.
The implementation of the above assumptions required the use of the most modern specialized measuring equipment and programs enabling the execution of defined tasks at the required level, characterized by optimal technological, price and quality efficiency.
The proposed procedures have been verified in many studies (compact studies and publications), indicating their original capabilities useful in many applications [3, 8, 12].
References
-
Moczulski W, Ciupke K (2008) Knowledge acquisition for hybrid systems of risk assessment and critical machinery diagnosis. ITE Radom.
-
Żółtowski M (2011) The computer systems of management in the engineering of the production. ITE -PIB, Radom.
-
Cempel C (1996) Ewolucyjne modele symptomowe w diagnostyce maszyn, Materiały I Kongresu Diagnostyki Technicznej, Gdańsk.
-
Staszewski WJ, Boller C, Tomlinson GR (2004) Health Monitoring of Aerospace Structures. John Wiley & Sons, Ltd. Munich, Germany.
-
Żółtowski B, Żółtowski M (2014) The use of modal analysis to examine the bricks walls elements. 174-186.
-
Williams R, Crowley J, Vold H (1985) The multivariate mode indicators function in modal analysis. Proceedings of International Modal Analysis Conference.
-
Żółtowski M, Żółtowski B (2015) Vibrations signal to the description of structural damage of dynamic the technical systems. Liptowski Mikulesz 7(9): 44.
-
Guillaume P (2020) Department of Mechanical Engineering, Vrije Universiteit Brussel.
-
Żółtowski B, Żółtowski M (2015) Vibration signals in mechanical engineering and construction.
-
Zoltowski B, Zoltowski M (2014) Vibrations in the Assessment of Construction State. DYN-WIND, Applied Mechanics and Materials 617: 136-141.
-
Żółtowski B, Cempel C (2004) Engineering of diagnostics machines. PTDT, ITE-PIB, Radom, ISBN 83-7204-414-7.
-
Żółtowski M (2011) Modal analysis in the investigation of building materials. ITE, Radom.
-
Castaneda LF (2007) Multicriterial system for evaluating the safety and comfort in railway vehicles. Ph.D. thesis, UTP, Bydgoszcz.
-
Żółtowski M, Martinod RM (2016) Technical Condition Assessment of Masonry Structural Components using Frequency Response Function (FRF). Journal of the International Masonry SocietyMasonry International 29(1): 23-26.
-
Betz DC (2004) Application of optical fibre sensors for structural health and usage monitoring. Dynamics Research Group, Department of Mechanical Engineering, The University of Sheffield. Sheffield.
-
Peeters B, Ventura C (2011) Comparative study of modal analysis techniques for bridge dynamic characteristics. Mechanical Systems and Signal Processing.
-
Inman DJ, Farrar CJ, Lopes V, Valder S (2005) Damage prognosis for aerospace, civil and mechanical systems.
- The Expanding Landscape of Road Rage: A Systematic Review of Conflicts Involving Drivers, Pedestrians, and Micromobility
- Validating Cognitive Models of Royal Navy Performance on Control Systems
- Comparing Standard and State-of-the-art Firefighter Coats on Postural Balance and Gait in a Live Burn Environment
- Investigating the Integration of Telemedicine into Clinicians Workflow: A Review of Methods
- Risk Assessment of Ergonomic Factors in a Textile Firm by RULA, REBA and Fine Kinney Methods
- Impact of Self-Esteem Training on Individuals with Disabilities Aged 17-30