Rapid and Reliable Method for Qualitative and Quantitative Assessment of Iron Fortificants Used for Flour Fortification
Food fortification with iron has potential to reduce anemia if the manufacturers comply with fortification standards using highly bioavailable and required quantities of iron. Our objective was to develop a quick and simple method to identify and quantify iron compounds commonly used for flour fortification to help agencies monitor fortification programs. Wheat and corn flours were fortified with 40-60 mg Fe/kg using ferric pyrophosphate, ferrous sulfate, ferrous citrate, ferrous fumarate, sodium ferric EDTA, and electrolytic iron. Using potassium thiocyanate with hydrochloric acid and hydrogen peroxide, we identified EFe, ferric, and ferrous fortificants. Ferric and ferrous salts were differentiated based on their solubility in water using ferrozine with and without added ascorbic acid. Semi-quantification by visual analysis was not significantly different from two standard quantitative methods. This study provides practical options to identify and quantify Fe fortificants based on the resources available at the facilities in various countries. Correct identification of unknown iron samples by independent personnel and accuracy of visual quantification suggested the reliability, ease, and accuracy of these methods in identifying and quantifying iron fortificants.
Introduction
Iron deficiency is one of the most prevalent micronutrient deficiencies in the world today and a common cause of anemia. Globally, anemia affects 2.0 billion people [1], with the highest prevalence in preschool-age children and women of reproductive age [2]. If not prevented or corrected, iron deficiency anemia (IDA) may cause impaired mental development, reduced physical performance, reduced work productivity, increased maternal and child morbidity and mortality, and referral to health-care professionals [3]. Food fortification can be a safe and effective strategy for reducing the incidence of iron deficiency. In a recent meta-analysis, long-term food fortification with iron has been shown to reduce anemia by 34% when the selected food vehicle is adequately fortified and regularly consumed [4]. However, this potential can be greatly reduced if manufacturers do not comply with the fortification standards and use cheaper, less bioavailable iron compounds.
Iron fortification has been shown to improve iron status by increasing serum ferritin and hemoglobin levels in women of reproductive age and decrease in childhood anemia [5]. In 2009, the World Health Organization (WHO) and partners published recommendations on wheat and maize flour fortification [6]. Four iron sources, sodium ferric ethylenediaminetetraacetate (NaFeEDTA), ferrous sulfate (FeSO4), ferrous fumarate (FeFum), and electrolytic iron (EFe), which vary widely in bioavailability and cost, were listed as suggested iron fortificants for wheat and maize flours. Different national governments allow fortification of flours with different iron compounds. Eighty-one countries have at least iron in the fortification of staples and condiments [7]. For example, the Government of Indonesia’s 2018 National Standard for Fortification requires fortification of wheat flour with FeSO4, FeFum or NaFeEDTA [8]. In addition, the Food Safety and Standards Authority of India allows for the use of globally-recommended four iron fortificants plus ferrous citrate (FeCit), ferrous lactate, ferric pyrophosphate (FePP), and ferrous bisglycinate to be added to whole and refined wheat flour [9]. However, FeCit, ferrous lactate, and ferrous bisglycinate are more costly and not commonly used iron fortificants [10].
Cereal flours are the most widely used vehicles for iron fortification because they are staple food commodities in many parts of the world. According to the statement prepared by the core group from WHO’s Department of Nutrition and Health in collaboration with other agencies, wheat and maize flour fortification is a preventive food- based approach to improve micronutrient status of populations [6]. In an extensive report where efficacy and safety of iron was discussed, various food vehicles and suggested iron compounds were tabulated [11]. In the past, Hurrell reviewed the iron compounds’ characteristics and bioavailability used in fortification [12]. Iron fortificants are broadly classified into three groups: water-soluble, poorly water-soluble but soluble in dilute acid, and water- insoluble and poorly soluble in dilute acid. The criteria for selecting the form of iron compound to add to cereal flours includes its cost, bioavailability and sensory changes in the food matrix [10]. Ferrous sulfate is the most commonly used water-soluble iron fortificant because it is inexpensive and is often used as the standard against which bioavailability of other iron fortificants is measured. It is also known to cause sensory changes due to fat oxidation or reaction with other natural substances present in the food matrix [12]. Ferrous citrate is poorly water-soluble and soluble in dilute acid, and it is believed that its iron is well absorbed (74% that of FeSO4). Since FeFum is poorly soluble in water, it causes fewer organoleptic changes in foods, but may also be poorly absorbed by those with low gastric acid production [10]. FePP is insoluble in water and poorly soluble in dilute acid, and its bioavailability is low [13]. However, FePP tends to have less effect on the sensory qualities of food than other fortificants [14]. Most commercially available elemental iron fortificants, including EFe, are water-insoluble and poorly soluble in dilute acid [15]. EFe has a bioavailability that is up to 75% that of FeSO4, which is high compared to other elemental fortificants, though particle size plays a role in the bioavailability of elemental fortificants. A water-soluble iron compound NaFeEDTA, has been approved for use as a fortificant because of its promising effectiveness. It can counteract the inhibitory effect on iron absorption of phytic acid, which is present in whole wheat flour. The absorption of iron from NaFeEDTA, when added to high phytate foods, is 2-3 times greater than that of FeSO4, and it also does not promote lipid oxidation in foods [15].
In terms of cost, the most inexpensive food-grade iron is hydrogen-reduced iron, followed by EFe, FeSO4, FeFum, FePP, and finally, NaFeEDTA. However, the extent to which national or regional flour is fortified with iron varies considerably [16]. In a mandatory program, governments stipulate which iron fortificants are permitted, but in voluntary programs, industries may use the cheapest source of iron, which likely has low bioavailability. Even in countries with mandatory legislation, industries can prefer to use cheaper iron compounds over the recommended costlier ones if legislation is not enforced and regulatory monitoring is not effective. The public health impact of iron fortification programs depends on the amount and bioavailability of the iron fortificants added to foods. Although most countries rely on the WHO fortification guidelines, iron fortification programs appear to have marginal effects on reducing the burden of IDA, particularly in developing countries, due to lack of legislation and oversight of fortification programs [16]. Given the wide variety of iron fortificants, the ability to rapidly identify iron compounds in fortified foods allows program managers to readily determine if the fortified food complies with the technical specifications and is an objective measurement of program performance. In practice, the performance, complexity, and cost of fortification methods will depend on factors including the food matrix, iron fortificant used, and levels of food enforcement desired. Therefore, this study’s objective was to provide a cost-effective, rapid, and accurate test to identify and quantify iron fortificants in flour that can be used in countries with limited research capabilities.
Materials and Methods
Flour, Iron Compounds and Chemicals
Unfortified whole wheat flour was obtained from a local market in India, and refined wheat flour and yellow corn flour were obtained from Archer Daniels Midland Company (Overland Park, KS, USA and Jackson, TN, USA, respectively). All iron compounds: EFe, NaFeEDTA, FePP, FeSO4, FeFum, and FeCit were obtained by kind donation by Dr. Paul Lohmann (Emmerthal, Germany). L-ascorbic acid (ASC), sodium acetate trihydrate, hydrogen peroxide (H2O2), hydrochloric acid (HCl), and trichloroacetic acid (TCA) were purchased from Fisher Scientific (Chicago, IL, USA). Ferrozine (3-(2-pyridyl)- 5,6-diphenyl-1,2,4-triazine-4′,4″-disulfonic acid sodium salt), potassium thiocyanate (KSCN), and thioglycolic acid (TGA) were obtained from Sigma-Aldrich (St. Louis, MO, USA). The iron standard solution was obtained from Fluka (Buchs, Switzerland).
Fortification of Flour
Refined wheat, whole wheat, and yellow corn flour were fortified with NaFeEDTA, FePP, FeSO4, FeCit, and FeFum to achieve 40 mg Fe/kg, and with EFe to achieve 60 mg Fe/ kg iron and stored at room temperature. For blinded sample testing of steps 1-3 (mentioned later in this section), four samples (A, B, C, and D) were prepared, and an additional blinded sample (E) was added for blinded testing for step 4. Type of fortificant and iron levels were randomly selected for samples A-D by assigning each fortificant (EFe, FePP, NaFeEDTA, FeFum, FeCit) a number between 1-6, and each iron level (20, 25, 30, 35, 40, 45, 50, 55, and 60 mg Fe/kg) a number between 1-9. Numbers were randomly selected to determine iron levels and fortificants to be added to flour. For sample E, FeSO4 was chosen intentionally, but the iron level was determined randomly. These samples were made with refined wheat flour. After iron was added, all flour samples were mixed for at least 10 min using a hand crank mixer and stored in airtight Ziploc bags and stored at room temperature. Iron levels of all samples were verified using the established iron determination method [16].
Overall Method
The method presented here uses four steps (Figure 1). In step 1, iron fortificants were identified as ferrous, ferric, or electrolytic. In step 2, fortificants identified in step 1 as ferric were further tested to differentiate FePP and NaFeEDTA. In step 3, fortificants identified in step 1 as ferrous were further tested to identify FeSO4, FeFum, and FeCit. In step 4, iron was quantified semi-quantitatively and validated with standard quantitative methods [17, 18].

Figure 1: Overview of methods for identification and quantification of iron fortificants in cereal flours. In step 1, the oxidation states (ferrous, ferric, or elemental iron) were identified. In step 2, FePP and NaFeEDTA were identified. In step 3, FeSO4, FeFum, and FeCit were identified. In step 4, iron was quantified. Efe, electrolytic iron; NaFeEDTA, sodium ferric EDTA; FePP, ferric pyrophosphate; FeSO4, ferrous sulfate; FeFum, ferrous fumarate; FeCit, ferrous citrate.
Step 1: Identification of Ferric, Ferrous Salts and Electrolytic Iron
American Association of Cereal Chemists (AACC) method 40-40 was modified to differentiate between ferrous, ferric and EFe fortificants [19]. A small amount of flour (0.3 g) was mixed with 2 mL of 3 N HCl. One mL of 10% (w/v) KSCN was added to each sample, and the color was allowed to develop for 10 min. One mL 3% (v/v) H2O2 was then added, and color changes and specks (tiny spots) were recorded. Samples that produced a dark pink or red color before the addition of H2O2 were identified as ferric and were subjected to step 2. Samples that produced a dark pink or red color only after the addition of H2O2 and did not have red specks were identified as ferrous and were subjected to step 3. EFe was identified if thin red specks were formed after the addition of H2O2.
Step 2: Identification of NaFeEDTA and FePP Flours fortified with ferric fortificants identified in step 1 were further tested to differentiate between NaFeEDTA and FePP based on their solubility in water. Briefly, 0.3 g of flour and 2 mL milliQ water were mixed for 30 min. One mL fresh working ferrozine chromogen was then added, which was prepared by mixing 1 part, 0.25% (w/v) stock ferrozine solution, to 5 parts milliQ water and 5 parts 61.24% (w/v) sodium acetate trihydrate solution. After 10 min, 1 mL 5% (w/v) ASC was added, and the color was again allowed to develop for 10 min. If little to no color developed, the fortificant was identified as FePP, and with a strong purple color, the fortificant was identified as NaFeEDTA. All tests were carried out in triplicates.
Step 3: Identification of FeSO4, FeFum and FeCit Flours fortified with ferrous fortificants identified in step 1 were further tested to differentiate between FeSO4, FeCit, and FeFum. Again, a small amount of flour (0.3 g) and 2 mL milliQ water were mixed for 30 min. One mL freshly prepared working ferrozine chromogen, as described in step 2, was added, and the color was allowed to develop for 10 min. At this step, only FeCit developed color but not FeSO4 or FeFum. To further differentiate between FeSO4 and FeFum, 1 mL 5% (w/v) ASC was added, and the color was again allowed to develop for 10 min. If a purple color developed, the iron was identified as FeSO4, and if no color developed, the iron was identified as FeFum. Again, all tests were carried out in triplicates.
Step 4: Quantification of Iron Fortificants Standard Quantitative Long Method: Iron levels of all samples were verified using an established protocol [17]. Nine stock iron standard solutions: 10, 20, 30, 40, 50, 60, 80, and 100 µg Fe/mL were made. For each of the nine standards, 1 mL stock iron solution, and 9 mL 10% (w/v) TCA in 3 N HCl of iron were added to 1 g of unfortified flour and were processed as described for iron fortification of the cereal flours. Final concentrations for standard curves were 1, 2, 3, 4, 5, 6, 8, and 10 µg Fe/mL, not including the iron contributed from the unfortified flour. Samples were prepared by mixing 0.5 g fortified flour with 5 mL 10% (w/v) TCA in 3 N HCl. All the samples with the working standards were incubated together at 65℃ for 20 hours, cooled, and centrifuged at 750 × g for 15 min. Thirty micro liters (30 μL) of standard or sample supernatant and 270 μL freshly prepared working ferrozine chromogen (prepared as described in step 2 plus 1% TCA) were added to a ninety-six well microplate. After
10 min, absorbance was measured at 563 nm in a microplate reader (Biotek, Winooski, VT), and iron levels were calculated based on the linear curve generated from standards.
Standard Quantitative Short Method: To reduce the time needed to perform the quantification assay, an established method for serum iron determination with modifications was used [18]. Nine working standards were prepared as described above (under the long method). A small amount of fortified refined wheat flour (0.5 g) was placed in a 15 mL screw top centrifuge tube, and 5 mL 10% (w/v) TCA in 3 N HCl was added. Samples were vortexed for 45 seconds and placed in a boiling water bath for 10 min. Samples were cooled and centrifuged for 15 min at 3200 × g to obtain clear supernatants. To accurately analyze iron concentrations, equal amounts (150 μL) of sample and freshly prepared working ferrozine chromogen (same as in long method) were mixed, color developed for 10 min, and absorbance was measured at 563 nm using a microplate reader. Iron concentrations were calculated based on the linear curve generated from standards.
Visual Method: To quantify visually, samples and standards were prepared using the short method as described above. In addition, standards were also made without the flour to assess the accuracy of color comparison. One of each sample or standard supernatant was added to a glass test tube. One mL of freshly prepared working ferrozine was added, and the color was allowed to develop for 10 min. The color intensity of samples was compared visually to color intensities of standards to estimate the iron concentrations by four different personnel in duplicates.
Statistical Analysis
Iron levels were reported as mean ± SD. Differences in mean values for each fortificant using the three methods were assessed using ANOVA with Tukey multiple comparison. All statistical analyses were performed in JMP Pro 14 statistical software (SAS Institute Inc., Cary, NC, USA), and the differences were statistically significant if P < 0.05.
Results and Discussion
Step1: Identification of Ferrous, Ferric Salts and Electrolytic Iron Taking advantage of chromogen reactivity of ferric and ferrous iron with KSCN and ferrozine, solubility characteristics of iron fortificants, and using reducing and oxidizing agents (ASC and H2O2), we developed a step by step process to identify iron fortificants used to fortify flour. The first step differentiated ferric and ferrous fortificants and also identified EFe. Testing with KSCN in an acidic solution has been used routinely in flour mills for at least 50 years to identify ferric and ferrous fortificants [19]. However, this method is not useful for identifying specific iron fortificants. The KSCN can react only with ferric iron in an acidic condition to form a red-colored complex. In step 1, as expected, an intense red color developed with NaFeEDTA and FePP samples when KSCN was added. After adding H2O2 to convert iron from ferrous to ferric, as expected, ferrous fortificants developed a uniform red color. However, EFe formed tiny red specks, which is likely due to its poor solubility. The results of this step 1 and 2 and 3 are presented together in Table 1.
| Fortificantb | Oxidation State Test KSCN and 3 NHCl | Solubility Test Ferrozine and Water | ||
|---|---|---|---|---|
| - H O 2 2 | +H O 2 2 | - ASC | +ASC | |
| NaFeEDTA | Dark red | Dark red | No color | Dark purple |
| FePP | Dark red | Dark red | No color | No color or light |
| EFe | No color or light red | Dark with red specks | _ | _ |
| FeSO 4 | No color or light red | Dark red | No color | Dark purple |
| FeCit | No color or light red | Dark red | Light purple | Dark purple |
| FeFum | No color or light red | Dark red | No color | No color or light purple |
Table 1: Table 1: Color developments for identification of iron fortificants in cereal floursa.
aResults were similar for all flours tested (refined wheat, whole wheat, or yellow corn flour), but whole wheat flour samples generally produced darker color than refined wheat or yellow corn flours. bEFe, electrolytic iron; NaFeEDTA, sodium ferric EDTA; FePP, ferric pyrophosphate; FeSO4, ferrous sulfate; FeFum, ferrous fumarate; FeCit, ferrous citrate Step 2: Identification of NaFeEDTA and FePP Because of the low solubility of FePP in water compared to NaFeEDTA, we expected to see more color development with NaFeEDTA and KSCN when NaFeEDTA fortified flour was mixed with water instead of acid. However, adding KSCN to ferric enriched flour mixed in water did not produce color, which may be due to the inability of KSCN to react with ferric iron at a neutral pH. Because ferrozine works at a wider pH range, including at a neutral pH, we were able to use ferrozine to test the solubility of iron fortificants in water [20]. Due to ferrozine reactivity with only ferrous iron, adding ASC to reduce iron allowed us to use ferrozine with ferric fortificants. As expected, NaFeEDTA produced a more intense purple color with ferrozine plus ASC than FePP because of higher solubility of NaFeEDTA in water (Table 1).
Step 3: Identification of Ferrous Sulfate (FeSO4), Ferrous Fumarate (FeFum) and Ferrous Citrate (FeCit) To differentiate the three ferrous fortificants, we utilized ferrozine, with and without ASC, after mixing the flours with water. Before adding ASC, only FeCit reacted with ferrozine giving a purple color. After adding ASC, FeSO4 reacted with ferrozine to produce a purple color. These results may be due to the solubility and stability of FeSO4 and the FeCit complex in water. We believe that, when dissolved at a neutral pH free ferrous iron can be oxidized to ferric [21], making it unreactive with ferrozine. This is supported by the fact that adding ASC to FeSO4 samples, which converts the ferric iron to ferrous, caused the FeSO4 samples to then produce dark purple color with ferrozine. However, FeCit, when dissolved in water iron from FeCit is protected and not oxidized, allowing it to react with ferrozine. As expected, FeFum did not react with ferrozine even after adding ASC due to its poor solubility in water. Hence in this step, we were able to differentiate all three ferrous fortificants (Table 1). If FeCit, which is not commonly used for fortification is not included as a sample, adding ferrozine and ASC in a single step will be enough to identify FeSO4 and FeFum.
Step 4: Quantification of Iron Fortificants
Results from the long and short methods with a microplate reader as well as the visual semi-quantitative analysis following the short method for samples A-E are summarized in Figure 2. If color intensity can be measured using a spectrophotometer, the short method is shown to be as accurate as the long traditional method. On the other hand, the visual analysis was purely qualitative, but comparing those values to more accurate results assures that this method will provide consistent results in a field setting. For each sample, the mean iron concentration using each of the three methods were not significantly different from each other (p > 0.05), suggesting that our visual method can accurately quantify iron fortificants in flour.
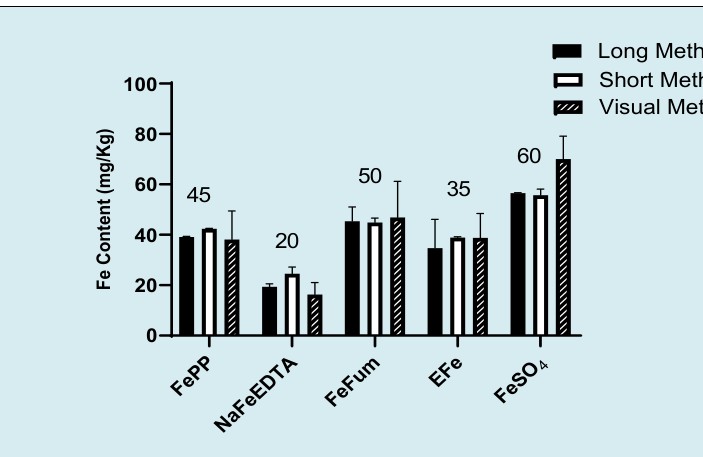
Figure 2: Comparison of long, short, and visual iron quantification methods. Iron quantification using 3 different methods that are measured against standards made with flour. Values are means ± SD, and values listed above bars are actual added iron levels. For long and short methods (n = 2-3). For visual method, means represent values measured by 4 personnel who analyzed each sample in duplicate. Differences in mean values for each fortificant using the three methods were assessed using ANOVA with Tukey multiple comparison. EFe, electrolytic iron; NaFeEDTA, sodium ferric EDTA; FePP, ferric pyrophosphate; FeSO4, ferrous sulfate; FeFum, ferrous fumarate; FeCit, ferrous citrate We expected to see variations in measured values compared to actual because fortifying flour in a lab setting and mixing with a hand mixer for 10 minutes was likely insufficient in creating homogenous samples. Iron concentrations for each fortificant estimated by all three methods are close to the actual iron added to the flour. For sample A, the measured values were slightly lower than the actual added iron, but for samples B-E, measured values were very close to the actual added values.
Identification and Quantification of Blinded Samples
We were able to differentiate six iron fortificants with simple methods using only a few reagents. This method worked with fortified wheat flour, refined wheat flour, and yellow corn flour, suggesting its usefulness for universal testing of many flour types. To assure the reliability and reproducibility of our methods, blinded samples (A, B, C, D, and E) were tested independently by four laboratory personnel. All four personnel correctly identified the iron fortificant used in all four blinded fortified flour samples using steps 1-3.
Laboratory personnel quantified the iron by visually comparing the color intensity of samples in duplicate to the color intensity of standards. Duplicates from the reported iron level for each sample were averaged, and data for each sample were combined. Visual results were better when standards were made without flour since samples were less cloudy. When samples were compared with standards without flour, the average reported iron values were 85% of the time within 10 mg Fe/kg and 70% of the time within 5 mg Fe/kg of the actual iron level of samples. The values were lower when the samples were compared against standards made with flour. Averaged reported iron values were 60% of the time within 10 mg Fe/kg and 45% of the time within 5 mg Fe/kg of the actual iron level (Table 2).
Additionally, some fortificants were more accurately predicted than others. When using standards without flour, the average reported iron level for each person from NaFeEDTA samples was within 5 mg Fe/kg of the actual iron level 100% of the time, 75% of the time for FePP, EFe, FeFum, and 25% of the time for FeSO4. For all samples, the average reported iron level using standards without flour was within 10 mg Fe/kg of the actual iron level 75-100% of the time, except for sample E (FeSO4), which was within 10 mg Fe/ kg only 50% of the time. These results suggest that when comparing the color intensity visually for quantification, standards prepared without flour may yield more accurate and precise results.
| Sample (Fortificant)b | Standards without flour | Standards with flour | ||||
|---|---|---|---|---|---|---|
| Within 5 mg Fe/kg of actualc | Within 10 mg Fe/kg of actualc | Within 15 mg Fe/kg of actualc | Within 5 mg Fe/ kg of actualc | Within 10 mg Fe/kg of actualc | Within 15 mg Fe/kg of actualc | |
| A (FePP) | 3/4 | 4/4 | 4/4 | 2/4 | 2/4 | 4/4 |
| B (NaFeEDTA) | 4/4 | 4/4 | 4/4 | 2/4 | 3/4 | 4/4 |
| C (FeFum) | 3/4 | 3/4 | 4/4 | 2/4 | 2/4 | 3/4 |
| D (EFe) | 3/4 | 4/4 | 4/4 | 1/4 | 3/4 | 4/4 |
| E (FeSO4) | 1/4 | 2/4 | 3/4 | 2/4 | 2/4 | 3/4 |
| Total | 14/20 | 17/20 | 19/20 | 9/20 | 12/20 | 18/20 |
Table 2: Fraction of laboratory personnel reporting within 5, 10 and 15 mg Fe/Kg of actual iron levels in blinded flours based on
aThe fraction of laboratory personnel whose average reported iron level from blinded sample testing using the short method with visual analysis was within 5, 10, and 15 mg Fe/kg of the sample’s actual iron level (n=4). bEFe, electrolytic iron; NaFeEDTA, sodium ferric EDTA; FePP, ferric pyrophosphate; FeSO4, ferrous sulfate; FeFum, ferrous fumarate; FeCit, ferrous citrate cActual iron level of each sample determined via the long method using standards without flour rounded to the nearest whole number Overall, using both ferrozine and KSCN, all six iron fortificants were differentiated but using KSCN alone made in 3 N HCl can be used when ferrozine is not available in certain settings with an additional extract step to release water soluble iron. In step 2, NaFeEDTA produced a dark red color with KSCN made in acid, while FePP produced little or no color, likely due to NaFeEDTA being more soluble in water than FePP. In step 3 of the, FeSO4 produced no specks or large red specks, while FeFum produced many tiny red specks, likely due to differences in particle size. In addition, identification of FeCit didn’t work well with this method. Overall, ferrozine method was better to clearly differentiate all iron fortificants.
To our knowledge, no other methods exist that allow for the identification of six iron fortificants without the use of analytical instruments. Slight modifications to the AACC method 40-40 [19], were important to differentiate between ferrous and ferric fortificants, but not to identify fortificants more specifically. Other methods that utilize potassium ferricyanide in conjunction with a magnet are able to identify FeSO4, FeFum, NaFeEDTA, and elemental iron [22]. However, is difficult to use magnet in a laboratory setting with a small amount of flour sample and EFe iron. Our method provides a novel and user friendly way for the identification and visual quantification of iron fortificants. The method described here requires training in only basic laboratory techniques and applicable for use in countries or regions with limited resources. Because this method rely on visual analysis for both identification and quantification, we recognize that those with visual impairments or who are color blind may be unable to use these methods. Future methods could be developed that utilize a smartphone camera and application to judge color and color intensity as reported in a previous study which differentiate between only two ferrous salts using the smartphone technology [23].
Conclusions
Using the knowledge of simple iron chemistry, like solubility and oxidation states, and using appropriate iron chromogens, we developed an inexpensive, rapid, and reliable test to identify the iron fortificants added to flour. Additionally, modifying existing iron quantification protocols allowed us to develop methods to quantify iron visually. Although, we were able to identify iron fortificants using only KSCN as a chromogen, we recommend using the method with both KSCN and ferrozine, as the iron-ferrozine complex color is more stable than the iron-KSCN complex color. In conclusion, our method can be easily used to monitor and evaluate iron fortification programs, especially in low and middle-income countries.
Acknowledgments
We acknowledge Archer Daniels Midland Company for the donation of the white and yellow corn flour. We acknowledge Dr. Paul Lohmann for the donation of the iron fortificants. We would like to thank Vicky Guo Li, Laura Walter, and Anna Michaels for laboratory assistance.
Declarations
Funding
This research was funded by Nutrition International, Ottawa, Canada, through a grant from Global Affairs Canada
Conflicts of Interest
The authors declare no conflict of interest. The funders had no role in the design of the study; in the collection, analyses, or interpretation of data; in the writing of the manuscript, or in the decision to publish the results.
Ethics Approval
Not applicable because this was a study on food samples and methods development.
Consent to Participate
Not applicable
Consent for Publication
Not applicable
Availability of Data and Material
Data will be made available upon reasonable request from the corresponding author.
Code Availability
Not applicable
Authors’ Contributions
Conceptualization, MBR, and MC; Methodology, NH, and MBR; Software, NH, SA, and MBR; Validation, NH, IA, SA, and MBR; Formal Analysis, NH, and MBR; Investigation, NH, IA, and MBR; Resources, MBR; Data Curation, NH, IA, SA, and MBR; Writing - Original Draft Preparation, NH; Writing - Review & Editing, MBR, IA, SA, and MC; Visualization, NH, and MBR; Supervision, MBR; Project Administration, MBR; Funding Acquisition, MBR.
References
-
GBD 2017 Disease and Injury Incidence and Prevalence Collaborators (2018) Global, regional, and national incidence, prevalence, and years lived with disability for 354 Diseases and Injuries for 195 countries and territories, 1990-2017: A systematic analysis for the Global Burden of Disease Study 2017. The Lancet 392(10159): 1789-1858.
-
Kassebaum NJ, Jasrasaria R, Naghavi M, Wulf SK, Johns N, et al. (2014) A systematic analysis of global anemia burden from 1990 to 2010. The American Society of Hematology 123(5): 615-624.
-
Lopez A, Cacoub P, Macdougall IC, Peyrin-Biroulet L (2016) Iron deficiency anaemia. Lancet (London, England) 387(10021): 907-916.
-
Keats EC, Neufeld LM, Garrett GS, Mbuya MNN, Bhutta ZA (2019) Improved micronutrient status and health outcomes in low-and middle-income countries following large-scale fortification: Evidence from a systematic review and meta-Analysis. American Journal of Clinical Nutrition 109(6): 1696-1708.
-
Das JK, Salam RA, Kumar R, Bhutta ZA (2013) Micronutrient fortification of food and its impact on woman and child health: a systematic review. Systematic Reviews 2(1): 67.
-
WHO, FAO, UNICEF, GAIN, MI, FFI (2009) Recommendations on wheat and maize flour fortification. Meeting Report: Interim Consensus Statement.
-
GFDx (2020) Global Fortification Data Exchange.
-
BSN (2009) Tepung terigu sebagai bahan makanan (Wheat flour as food) (SNI 3751:2009).
-
FSSAI (2018) Food fortification in India: status and road ahead-need for a strategic shift for further scale up.
-
Hurrell R (2002) How to ensure adequate iron absorption from iron-fortified food. Nutrition Reviews 60(7): S7-S15.
-
Mannar MGV, Hurrell R (2018) Food Fortification in a Globalized World-1st (Edn.), In: Mannar MGV, Hurrell R (Eds.), Academic Press, pp: 414.
-
Hurrell RF (2002) Fortification: Overcoming technical and practical barriers. Journal of Nutrition 132(4): 806S-812S.
-
Bries AE, Hurrell RF, Reddy MB (2020) Iron Absorption from Bouillon Fortified with Iron-Enriched Aspergillus oryzae is Higher than that Fortified with Ferric Pyrophosphate in Young Women. The Journal of Nutrition 150(5): 1109-1115.
-
Hurrell RF (1997) Preventing iron deficiency through food fortification. In: Nutrition Reviews. Blackwell Publishing Inc 55(6): 210-222.
-
Hurrell R, Bothwell T, Cook JD, Dary O, Davidsson L, et al. (2002) The usefulness of elemental iron for cereal flour fortification: a SUSTAIN Task Force report. Sharing United States Technology to Aid in the Improvement of Nutrition. Nutrition Reviews 60(12): 391-406.
-
Hurrell R, Ranum P, de Pee S, Biebinger R, Hulthen L, et al. (2010) Revised Recommendations for Iron Fortification of Wheat Flour and an Evaluation of the Expected Impact of Current National Wheat Flour Fortification Programs. Food and Nutrition Bulletin 31(1): S7-S21.
-
Torrance JDB (1980) Tissue iron stores. In: J Cook (Ed.), Methods in Hematology: Iron. Churchill Livingstone, pp: 90-115.
-
Cook JDB, Covell AM, Dallman PR, Lynch SR, Worwood MA, et al. (1985) Serum iron and iron-binding capacity. In Measurements of Iron Status: A Report of the International Nutritional Anemia Consultative Group. The Nutrition Foundation, Inc, pp: 67-75.
-
AACC (1999) Approved Methods of Analysis. Method 40-40.01. Iron-Qualitative Method. In: Cereals & Grains Association 11th (Edn.), Cereals & Grains Association.
-
Chidambaram MV, Reddy MB, Thompson JL, Bates GW (1989) In vitro studies of iron bioavailability - Probing the concentration and oxidation-reduction reactivity of pinto bean iron with ferrous chromogens. Biological Trace Element Research 19(1-2): 25-40.
-
Stumm W, Lee GF (1961) Oxygenation of Ferrous Iron. Industrial & Engineering Chemistry 53(2): 143-146.
-
Guamuch MMP, Dary O (2007) Procedures for determining iron flour. In: Guamuch M, Makhumula P, Dary O (Eds.), Manual of Laboratory Methods for Fortified Foods. East, Central and Southern African Health Community (ECSA-HC), pp: 7-16.
-
Waller AW, Toc M, Rigsby DJ, Gaytán-Martínez M, Andrade JE (2019) Development of a Paper-Based Sensor Compatible with a Mobile Phone for the Detection of Common Iron Formulas Used in Fortified Foods within Resource-Limited Settings. Nutrients 11(7): 1673.
- The Role of Podocyte Apoptosis and the Involvement of SIRT1 in Diabetic Nephropathy
- Dealcoholization of Beer by Osmotic Distillation for the Beverage Industry
- Biopolymer-Based Edible Packaging- Biomaterials, Methods, and Applications in Food Industry: An Updated Review
- Influence of Bioprocessing Methods on 'China Rice' (Gawal R1), and Soyabean Supplementation on the Quality of Complementary Food
- Cassava (Manihot esculenta) Varietal Growth, Yield and Cyanide Content Performance in Three Sites in the South- Eastern Semi Arid Regions of Kenya
- Food Waste Treatment, Recycling, Management and Production of Value-Products-An Update on Methodologies and Current Trends