Development and Evaluation of Complementary Porridge Blends From Germinated Maize, Soybean and Sweet Potato
Porridge is an important complementary food in many developing countries and it is mainly prepared from different blended flour. It is however, relatively cheap or inexpensive, being made from local available crop. In line with this, research was initiated to produce porridge from formulated with germinated maize, soybean and sweet potato flour to investigate the possibilities of improving the proximate composition, functional and sensory properties of complementary porridge. Nine -formulations of the composite flour were prepared using mixture design using Minitab software of version 16with a range of Germinated maize 30-70%, soybean20-40% and sweet potato 10-30%. Results showed significance difference (p
Introduction
Complementary food is the process starting when breast milk alone is no longer sufficient to meet the nutritional requirements of infants. It plays vital role for children growth and development and complements for both nutritional and developmental needs of the infant when breast milk alone is no longer sufficient [1]. Traditional infant foods made of cereals or grains are bulky and may be low in several nutrients including protein, vitamin A, zinc iron and contain high amount of factors reducing mineral bioavailability, such as phytates and tannin which is the potential for stunting in children [2, 3]. According to WHO [4] good quality complementary food must have high nutrient density, low viscosity, bulk density and appropriate texture along with high energy, protein & micronutrient content, have low consistency that allows easy consumption [5].
Complementary foods should be rich in energy and nutrients, clean and safe, easy to prepare from family foods, locally available and affordable. Most foods developed in the different countries to provide nutrient dense complementary foods to meet the nutritional needs of infants and young children are based on local food stuffs blended with legumes to give protein portion of the diet [6]. In many developing countries complementary porridge prepared from local available crops like cereal, legume and tubers. Those crops have their own nutritional contents used for children health. Maize and sweet potato have high in carbohydrate content and soybean has high in protein content. Adequate development of complementary porridge from blending of maize, soybean and sweet potato was possible in order to prevent malnutrition. That means fortification of cereals with locally available legumes and tubers to increases the nutritional content of the food.
Traditionally many complementary foods practiced in Ethiopia like porridge, kita, fifit, gruel and dabo produced from local available crops [1]. The combination of local available crops like maize, soybean and sweet potato meet the nutritional needs of the infants. A number of researches [7] have shown that a combination of cereals and legumes or tubers with fruits, vegetables and animal sourced food rather than the single diets can better support growth and development.
Most of the time infants consume the single food product and cow’s milk that is sold has been diluted and the human milk in reasonable quantities alone cannot provide all the energy and protein required for maintaining an adequate velocity of growth for the infant after the age of six months. Therefore, the aim of this finding is to develop and evaluate complementary porridge which can be prepared easily at home and community kitchens from locally available raw materials germinated maize, sweat potato and soybean flour.
Materials and Methods
Description of Experimental Site
The study was conducted in Jimma University College of agriculture and veterinary medicine (JUCAVM), Food science and postharvest technology laboratory. JUCAVM is located at 356 Km south west of Addis Ababa at about 70 33” N latitude and 360 57” E longitude and altitude of 1710 meter above sea level (m.a.s. l).
Raw Materials and Sample Preparation
Source of Raw Materials: The maize, soybean and sweet potato products required for this study were purchased from jimma local market.
Germinated Maize Flour Preparation: The malted maize flour was prepared according to the method of Abasiekong. Maize grains was purchased from local markets and then all debris were removed. The maize grains was sorted and then washed in clean water. Grains was soaked in water for 24 hr. and then drained then spread in bucket, moistened and left to germinate for 48-72 hr. The germinated grains were drained in drying oven at 65°c for 24-36 hr. After drained they were milled and sieved to obtain germinated maize flour. Soybean Flour Preparation: Soybean flour was prepared by using the method described by Famurewa and Raji. To obtain soy bean flour we was desire, clean it by removal of foreign materials from the beans. The beans were thoroughly washed by water in order to remove dirty particle that exist on the surface of the bean. The cleaned soybean was soaked for 30 min in water. Drain and rinse the soaked soybean. Then the soybean was dehulled and dry at 70°c in oven for 10 hrs. The dried soybean was winnowing in order to remove the hull skin of soybean. Grind beans into flour. The flour was stored in a dry, air tight container place. Sweet Potato Flour Preparation: The sweet potato flour was prepared according to the method of Adenuga [8]. Matured and fresh Sweet potato tubers were purchased from local market. The samples was cleaned, peeled, cut into suitable sizes, and dried in an oven drier at an average temperature of 60 0C for three days in post-harvest laboratory. The dried Sweet potato samples were subsequently milled by using a grinder machine and the sweet potato flour was made. The powdered samples was bagged in an air-tight container and stored at 4°C till further analysis.
Blending Formulation
Mixture design was used for the experiment using Minitab software version 16 to studying properties over the entire region of three components of mixture. In this study, nine complementary food products samples were prepared with variable concentration of germinated maize, soybean and sweet potato. The nine experimental run are generated using the upper and lower limit as indicated in Table 1. All the nine treatments were conducted using different ratio of germinated maize, soybean and sweet potato flour. The objective here was to maintain the nutrient composition of the composite flour close to the standard values for complementary foods [9] (Table 2).
| Mixture components | Lower limit | Upper limit |
|---|---|---|
| Germinated maize | 30 | 70 |
| soybean | 20 | 40 |
| Sweet potato | 10 | 30 |
Table 1: Lower and upper limits of complementary food ingredients used in the mixture design.
| Std Order | Run Order | Pt Type | Blocks | Germinated maize | Soybean | Sweet potato |
|---|---|---|---|---|---|---|
| 1 | 1 | 1 | 1 | 70 | 20 | 10 |
| 9 | 2 | -1 | 1 | 50 | 35 | 15 |
| 4 | 3 | 1 | 1 | 50 | 40 | 10 |
| 6 | 4 | -1 | 1 | 60 | 25 | 15 |
| 8 | 5 | -1 | 1 | 50 | 25 | 25 |
| 5 | 6 | 0 | 1 | 50 | 30 | 20 |
| 2 | 7 | 1 | 1 | 30 | 40 | 30 |
| 3 | 8 | 1 | 1 | 50 | 20 | 30 |
| 7 | 9 | -1 | 1 | 40 | 35 | 25 |
Table 2: Experimental run generated by mixture design using Minitab software of version 16.
Porridge Preparation
The porridge was prepared by using the method described by Rowe. All samples were prepared with different proportion of flour ratio and all samples were made in triplicate. Before adding to boiled water, the flour was mixed properly until it became uniform as viewed with the naked eye. The blended flour was added to boiled water and cooked for 10 minutes by stirring occasionally. Then it was removed from the stove and allowed to cool to 30°C to make ready-to- serve porridge.
Data to be Collected
Proximate Analysis
I. Moisture contents
Moisture content of the complementary food products samples was determined by AOAC [10] using the official method 925.09. Cleaned Petri dish was dried in an oven at 105°C for 1 h and placed in desiccators to cool. The weight of dried Petri dish (W1) was determined. About 5g samples of flour was weighed in the dried Petri dish (W2) and then dried at 105oC for 24 h. Finally a sample was transferred to desiccators and weighed (W3). The moisture content was calculated.
− = −
W W Mc W W
2 3 % *100 2 1
Where Mc=moisture content %, w2=weight of Petri dish and sample before drying (g), w1=weight of Petri dish (g), w3=weight of dry sample and Petri dish (g). II. Ash Ash content was determined using the method of AOAC. About 5 g of each sample was weighed into crucibles in duplicate, and then the sample was incinerated in a muffle furnace at 550°C until a light grey ash was observed and a constant weight obtained. The sample was cooled in the desiccators to avoid absorption of moisture and weighed to obtain ash content
1 2 ash % *100 W W
− = −
W W Where, w =weight of empty crucible (g), w1=weight of crucible and sample (g), w2=weigh of crucible and ash.
Determination of Functional Propertie
a. Water Absorption Capacity
The water absorption capacity of flour was determined using the method described by Ruales, et al. [11]. 1 g of sample was suspended in 15 mL of distilled water at 30 ºC in a centrifuge tube and centrifuged at 2500 rpm for 30 minutes. The supernatant was decanted and the weight of the formed gel was recorded. The water absorption capacity (WAC) was calculated as gel weight per gram of dry sample.
*100 Grambound water WAC Weight of sample =
b. Oil Absorption Capacity
Oil absorption capacity (OAC) was determined according to the method of Beuchat. 1g of the sample flour was measured and mixed with 10ml (V1) oil (pure soybean oil) in a 25ml centrifuge tube and stirred for 2 min. The samples was allowed to stand at room temperature for 30 min, centrifuged at 5000rpm using a centrifuge for 30 min, and the volume of the supernatant will noted in a 10ml graduated cylinder (V2). The difference in volume was taken as the oil absorbed by the sample (V3). Weight (%) = (vol. of absorbed oil x 100)/wt of sample. c. Bulk Density The bulk density of the flour was determined according to the method described by Butt & Batol. About one grams of the sample was putted into 10 ml graduated cylinder and the cylinder was tapped several times (minimum 10 times) on the laboratory bench for the sample to settle, become compact and to eliminate air pockets. Bulk density was calculated as weight of flour sample (g) divided by its volume (ml).
Sensory Quality Evaluation: Sensory evaluation of complementary porridge samples was conducted by selecting, 20 untrained panelists from Jimma University, Food science and postharvest technology students and staffs. The porridge was served in random order identified by codes. This analysis was conducted in food science and post-harvest technology laboratory. Panelists was advised to avoid strong odorous materials, such as soaps, lotions and perfumes prior to participating on panels and to avoid eating, drinking or smoking at least 30 minutes prior to a sensory test. Consumers was asked to fill questionnaire prepared for the evaluation of sensory attributes of the porridge samples like, appearance, color, flavor, taste, and overall acceptability using, five hedonic scale Like very much=5, like moderately=4, neither like nor dislike=3, dislike moderately=2, dislike very much=1. A glass of drinking water was provided for the panelists to wash their mouth between testing different samples.
Statistical Analysis: The experiment was analyzed and modeled using statistical software packages (Minitab version 16) to generate second degree polynomial. The significant terms in the models was identified by analysis of variance (ANOVA) for each response and accepted at 0.05 level of probability. The model adequacy was checked by regression coefficient (R2). To visualize the combined effects of two of the factors on the response, surface/contour plots was generated by keeping the third factor at the center. Graphical and Numerical optimization of mixture ratio, within the experimental range of conditions, was carried out with the objective of finding optimum levels of mixing ratio that would give optimum levels of proximate composition, functional property and sensory property of complementary porridge product.
Result and Discussion
Different analyses were done on the blended flour of germinated maize, soybean and sweet potato to determine the selected proximate composition, functional property of the blended flour and also analyses were done on porridge prepared from the mixture of the flour samples to determine the sensory quality of the porridge. The results of all the analyzed parameters for each sample are presented and discussed in tables and figures for this senior research project.
Proximate Analysis
| Run | X | Y | Z | Moisture Content | Ash Content |
|---|---|---|---|---|---|
| 1 | 50 | 30 | 20 | 5.06 | 2.8 |
| 2 | 60 | 25 | 15 | 4.7 | 3.2 |
| 3 | 70 | 20 | 10 | 4.88 | 1.8 |
| 4 | 50 | 25 | 25 | 4.8 | 3 |
| 5 | 50 | 20 | 30 | 4.62 | 4 |
| 6 | 50 | 35 | 15 | 4.4 | 3.2 |
| 7 | 30 | 40 | 30 | 4.5 | 4.6 |
| 8 | 40 | 35 | 25 | 4.48 | 5.4 |
| 9 | 50 | 40 | 10 | 5.56 | 3.8 |
Table 3: Measured values for selected proximate composition of blended flours Notes: X = germinated maize;y = soybean;z = sweet p
Table 3: Measured values for selected proximate composition of blended flours Notes: X = germinated maize;y = soybean;z = sweet potato The following table shows the p-value for mixture compositions of moisture and ash content. From the worked proximate compositions (moisture content and ash content) in all cross interaction flour, linear model and quadratic model p-values were not significantly different at 5 % probability level (Table 4).
| Sources | Moisture Content | Ash Content |
|---|---|---|
| Linear | 0.65 | 0.566 |
| Quadratic | 0.524 | 0.826 |
| X*Y | 0.578 | 0.826 |
| Y*Z | 0.346 | 0.681 |
Table 4: Analysis of variance (ANOVA) for the p-value of selected proximate analysis. Where X=germinated maize Y=soybeanZ=sweet p
Table 4: Analysis of variance (ANOVA) for the p-value of selected proximate analysis. Where X=germinated maize Y=soybeanZ=sweet potato Moisture contents
The moisture contents of complementary food samples are presented in the above Table 5. The moisture content of the complementary food samples varied from 4.4 to 5.6 %. The formulation substituted with 50% Germinated Maize, 35% soybean and 15% sweet potato flours having the least value of moisture content (4.4%) and 50%Germinated maize,40% soybean and 10% sweet potato having highest value of moisture content(5.6%). The moisture content was observed to increase with increased, and Chandra, substitution with soybean flours in the blends. This is same as to research done by Mishra [12] the moisture content increase with the increase in supplementation of other flours could be due to the fact that soya can absorb moisture in baked product. High moisture content in food has been shown to encourage microbial growth Bejar, et al. [13]. The values obtained in this study were lower than the moisture content (10.03-12.59%) of complementary food formulated from fermented maize, soybean and carrot flours reported by Gagnon & Barber [14]. The low residual moisture content in a food product is advantageous in that microbial proliferation is reduced and storage life is enhanced and prolonged. No significant association was observed between the blend of components and the model (Figure 1).
Mixture Contour Plot of mosture content (component amounts) Germinated maize
70 content mosture > – – – – – < 4.5 4.5 5.0 5.0 5.5 5.5 6.0 6.0 6.5 6.5 7.0 7.0
30 Figure 1: Effects of formulation on moisture content of blended flour indicated by contour graph.
II) Ash contents
Ash content indicates an estimate of the total mineral content in a given quantity of food Substance Mishra & Chandra [12]. The ash contents of complementary flour sample varied from 1.8% to 5.4%.From the blended product the 40% of germinated maize, 35% of soybean and 25% of sweet potato have highest value5.4% of ash as compared to the other blended proportion and the 70% of germinated maize, 20% of soybean and 10% of sweet potato having least value of ash content. The ash content of the samples increased with increasing in the levels of soybean and sweet potato flours components in the blends. The ash content of a food material is an indication of the amount of minerals in the food product. Ash content of the samples increased as the amount of soybean added to germinate maize and sweet potato flour is high. This might be because of the high content of ash in soy flour [15].
The findings reported by different scientists are in agreement with the results found in the present study indicating an increase in ash content with the increase in soy flour supplementation in the whole other cereal product flour. Another research done by Okoye, et al. [16] stated that ash contents of the blended products increased as the level of soybean flour inclusion increase. Figure 2 showed the contour graph of ash as influenced by proportion of germinated maize, soybean and Sweet potato.
Functional Properties
The functional properties of composite flour such as water absorbance capacity (WAC), bulk Density (BD) and oil absorption capacity (OAC) are summarized in Table 5. Table 6 shows the summarized p-values obtained from ANOVA results for mixture compositions of Functional properties.
| Run | X | Y | Z | WAC (%) | OAC (%) | BD (g/ml) |
|---|---|---|---|---|---|---|
| 1 | 50 | 30 | 20 | 175.5 | 151 | 0.42 |
| 2 | 60 | 25 | 15 | 131 | 128 | 0.45 |
| 3 | 70 | 20 | 10 | 136 | 110.2 | 0.54 |
| 4 | 50 | 25 | 25 | 187.5 | 138 | 0.4 |
| 5 | 50 | 20 | 30 | 176.3 | 147 | 0.35 |
| 6 | 50 | 35 | 15 | 169 | 109 | 0.39 |
| 7 | 30 | 40 | 30 | 200 | 170.3 | 0.3 |
| 8 | 40 | 35 | 25 | 171 | 155 | 0.35 |
| 9 | 50 | 40 | 10 | 133 | 124 | 0.375 |
Table 5: Measured values for functional property of blended flours. Where X= germinate maize Y= soy bean Z=sweet potato WAC=water
| Sources | WAC | OAC | BD |
|---|---|---|---|
| Linear | 0.577 | 0.882 | 0.005 |
| Quadratic | 0.769 | 0.797 | 0.028 |
| X*Y | 0.564 | 0.966 | 0.223 |
| Y*Z | 0.496 | 0.716 | 0.028 |
Table 6: Analysis of variance (ANOVA) for the p-value of functional property analysis. Where X=germinated maize Y=soybeanZ=sweet
Table 6: Analysis of variance (ANOVA) for the p-value of functional property analysis. Where X=germinated maize Y=soybeanZ=sweet potato WAC=water absorption capacity OAC= oil absorption capacity BD = bulk density I) Water absorption capacity Water absorption capacity is important in bulking and consistency of product as well as in baking applications [17]. The major chemical compositions that enhance the water absorption capacity of flours are proteins and carbohydrates, since these constituents contain hydrophilic parts, such as polar or charged side chains [18]. Water absorption capacity is the ability of flour to absorb water and swell for improved consistency in food. It is desirable in food systems to improve yield and consistency and give body to the food [19].
The functional property of complementary foods products are presented in Table 2. The 30% germinated maize, 40% of soybean and 30% of sweet potato having higher value (200%) of water absorption capacity and 60% of germinated maize,25% of soybean and 15 % of sweet potato having least value (131%) of water absorption capacity. From the mixture contour plot of WAC blending of higher amount of sweet potato with germinated maize and soybean having high value of WAC, because of sweet potato have high starch and have ability to absorb moisture in nature. WAC, an indicator of the ability of flour to absorb water, depends on the availability of hydrophilic group’s. Water Absorption capacity (WAC) characterized how the products were interact with water and are often important in predicting how the formulated complementary food products may behave if further processed.
Also the degree of conversion of starch from granule during processing can be accessed via WAC [20]. No significant association was observed between the blend of components and the absorption capacity. The increase in the WAC has always been associated with increase in the amylose leaching and solubility, and loss of starch crystalline structure. The flour with high water absorption may have more hydrophilic constituents such as polysaccharides (Figure 3).
Mixture Contour Plot of water absorbation capacity(%) (component amounts) Figure 3: Effects of formulation on water absorption capacity of blended flour indicated by contour graph.
II) Oil Absorption Capacity Oil absorption capacity of blended flour from germinated maize, soybean and sweet potato flour observed from current study as it recorded 30% of germinated maize, 40
soybean and 30% of sweet potato flour having higher value of OAC (170.3%) because of sweet potato flour have ability to absorb or contain moisture than the other flour and the 50% of germinated maize, 35% of soybean and 15% of sweet potato have least value of oil absorption capacity when compared to other proportion of blended flour. The Particle size significantly affects oil absorption capacity of the product (Figure 4).
Oil absorption capacity increased when the amount sweet potato was increased in blended flour. Therefore, the possible reason for increase in the OAC of composite flours after incorporation of potato is the variations in the presence of non-polar side chain, which might bind the hydrocarbon side chain of the oil among the flours. Similar findings were observed by Kaushal. However, the flours in the present study are potentially useful in structural interaction in food especially in flavor retention, improvement of palatability and extension of shelf life particularly in products where fat absorption is desired. The major chemical component affecting OAC is protein which is composed of both hydrophilic and hydrophobic parts. Non-polar amino acid side chains can form hydrophobic interaction with hydrocarbon chains of lipids.
III) Bulk density The bulk density is influenced by particle size and the density of the flour, and is important in determining the packaging requirement and material handling. Bulk density dictates the characteristics of container or package, product density influences the amount and strength of packaging material, texture or mouth feel [22]. From the blended flour 70% of germinated maize, 20% of soybean and 10% of sweet potato have high value 0.54 g/ml of bulk density than the other blended flour. From the current research observed the 30% germinated maize, 40% soybean and 30% sweet potato having least value 0.3 g/ml of bulk density when compared to other blended flour.
The bulk density showed a highly significance difference (p<0.05) in the linear model, in quadratic model and significance difference in the interaction of soybean and sweet potato. Despite its significantly difference among the different composite flours, the bulk density showed an increment from 0.3-0.54 g/ml as the amount of germinated maize increased from 30-70% as indicated in Figure 5 con’our graph. The amount of bulk density increased as the amount of germinated flour increased. Low BD had been found to be an advantage in formulating complementary foods as it enhances nutrient and calorie density per feed of child.
Mixture Contour Plot of Bulk density(g/ml) (component amounts) Germinated maize
70 density(g/ml) Bulk
> – – – – < 0.1 0.1 0.2 0.2 0.3 0.3 0.4 0.4 0.5 0.5
30 Soyabean 60 Figure 5: Effects of formulation on bulk density of blended flour indicated by contour graph.
The present study revealed that bulk density depends on the particle size and initial moisture content of flours. Bulk density of composite flour increased with increase in the incorporation of different flours with germinated maize. It is clear that increasing the proportion of germinated maize increase the bulk density of composite flours. The high bulk density of flour suggests their suitability for use in food preparations. On contrast, low bulk density would be an advantage in the formulation of complementary foods [23]. Bulk density of composite flours increased significantly with increase in the incorporation of soybean flour with other blended flour reported by Eltayeb, et al. [24]. But in our present study bulk density increased with increasing of germinated maize with blended flour. The reason for germinated maize increasing the bulk density of blended flour may be the grinded size of germinated maize during grinding process.
Sensory Evaluation
Sensory qualities are the main criterion that makes the product to be liked or disliked [25]. Descriptive sensory attributes scores of liking porridge produced from germinated maize, soybean and sweet potatoflour at different combination ratio is presented in Table 7.
| Run | X | Y | Z | Appearance | Aroma Taste | Texture Over all acceptability |
|---|---|---|---|---|---|---|
| 1 | 50 | 30 | 20 | 4.5 | 4.25 4.6 | 3.9 4.2 |
| 2 | 60 | 25 | 15 | 4.8 | 3.9 3.75 | 4.25 4 |
| 3 | 70 | 20 | 10 | 4.43 | 4 3.75 | 4.75 4.5 |
| 4 | 50 | 25 | 25 | 4.3 | 4.5 4.5 | 4.32 4.4 |
| 5 | 50 | 20 | 30 | 5 | 4.75 4.3 | 3.75 4.35 |
| 6 | 50 | 35 | 15 | 4.25 | 3.5 4 | 4.5 4.25 |
| 7 | 30 | 40 | 30 | 4.85 | 3.5 4.8 | 3.8 4.6 |
| 8 | 40 | 35 | 25 | 5 | 5 4.5 | 4.3 4.75 |
| 9 | 50 | 40 | 10 | 4.75 | 4.4 4.5 | 4.6 4.6 |
Table 7: Measured values for sensory evaluation of complementary porridge. Where x=germinated maize, y= soybean, x= sweet potato
| Sources | Appearance | Aroma | Taste Tex | ture Over all Acceptability |
|---|---|---|---|---|
| Linear | 0.651 | 0.475 | 0.53 0.5 | 68 0.462 |
| Quadratic | 0.692 | 0.551 | 0.865 0.9 | 69 0.486 |
| X*Y | 0.434 | 0.871 | 0.918 0.9 | 19 0.273 |
| Y*Z | 0.436 | 0.682 | 0.732 0.9 | 83 0.411 |
Table 8: Analysis of variance (ANOVA) for the p-value of sensory evaluation for porridge. Where X=germinated maize Y=soybeanZ=swe
The appearance of sensory property increased when the ratio of soy bean increased. The cause of the result may be attributed to Maillard reaction between reducing sugars and high proteins content found in soybean [26]. The higher appearance ranking might be due to the yellow color of the soybean flour. The 30% of germinated maize, 40% of soy bean and 40% of sweet potato have high acceptance in appearance due to high soybean was incorporated. The sample blended with50% germinated maize, 20% soybean and 30% sweet potato flour have best aroma, because of high incorporation of soybean. However, the porridge made from the sample substituted with 30% of germinated maize 40% soybean and 30% sweet potato flours which evaluated by panelists have best taste. The porridge prepared from 70% germinated maize, 20% soybean and 10% sweet potato flours have best texture because during soaking, germination and hulling the anti-nutrient like phytate was minimized [27].
The sensory attributes such as appearance, aroma, taste, texture and overall acceptance were illustrated by contour graph (Figure 5a, 5b, 5c, 5d and 5e). From the contour plot graph the observed result related to appearance, aroma, taste, texture and over all acceptability was explained according to the following. The appearance of the porridge is good when the soybean ratio is high and the aroma of the product is better if the amount of sweet potato was optimum. The taste of complementary porridge is high when the amount of sweet potato and soybean was optimum. Also the texture of the product is best when the ratio of blended germinated maize and soybean is high.
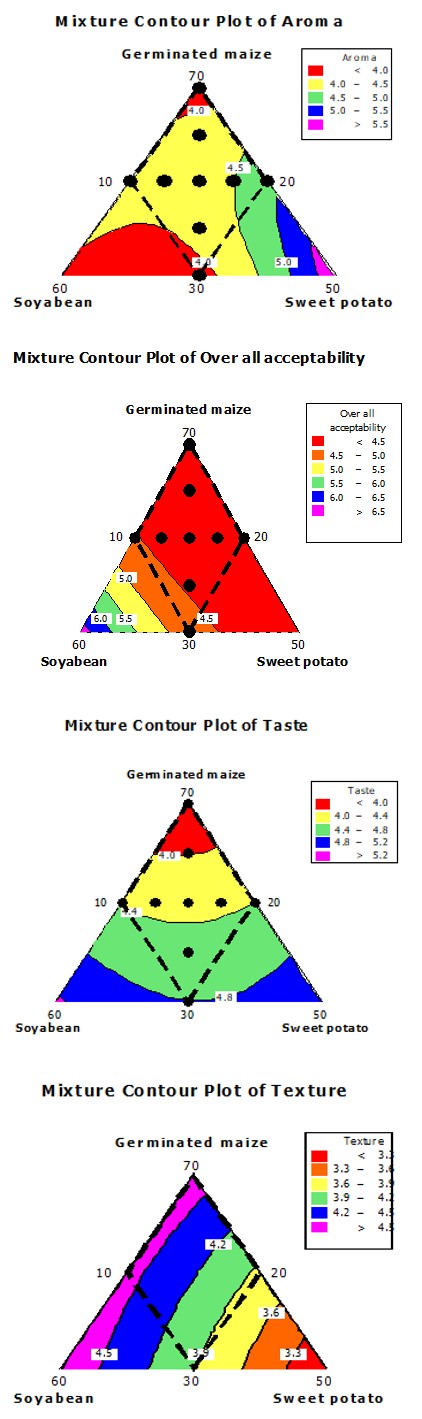
b) Aroma
c) Taste
d) Texture
e) Over All Acceptability Figure 5: Effects of flour formulation on porridge a) Appearance b) Aroma c) Taste d) Texture.
Conclusion
From the current study the selected proximate composition, functional property and sensory property was determined from the blended flour of germinated maize, soybean and sweet potato. From proximate composition when the moisture content is low the blended flour are good in order to prevent microbial growth and when the ash content is high it is good for the health of children. Porridge is one of complementary food consumed by children in order to enrich the nutrient required to the health of children. The fortification of porridge by blending of flour is used to enrich the nutrient required for children. From blended flour the proximate composition haven’t significant difference p>0.05. The functional property like water absorption capacity, oil absorption capacity and bulk density of blended flour was also determined. In complementary food when the products have high WAC and OAC it was best and when the bulk density of blended flour was low it is better.
From the functional property the bulk density have significance difference at linear, quadratic and in cross section of soybean and sweet potato. WAC, OAC and bulk density of complementary food products (200%, 170.3%, 0.54 g/ml) have high due to starch gelatinization & swelling of crude fiber.The WAC and OAC of blended flour does not have significance difference the p-value are >0.05.The average sensory property of complementary porridge prepared from blended flour explained as 5%, 5%, 4.8%, 4.75%, 4.75% for appearance, aroma, taste, texture and over all acceptability respectively. Sensorial data revealed that Overall acceptability (OAA) of porridge increased with increasing in the incorporation soybean flour with germinated maize and sweet potato flour in the formulation of porridge.
In general over all optimization of the blended flour was determined by numerical optimization in order to get best value selected proximate composition, functional property and sensory quality of blended flour. When the ratio of selected product was 30% germinated maize, 40% soybean and 30% sweet potato the prepared porridge have more acceptance.
References
-
Temesgen M (2013) Nutritional status of Ethiopian weaning and complementary foods: Areview. Scientific Reports 2: 1-9.
-
Suhasini AW, Malleshi NG (2003) Nutritional and carbohydrate characteristics of wheat andchick pea based weaning foods. Int J Food SciNutr 54(3): 181-187.
-
Umeta M, West CE, Fufa H (2005) Content of zinc, iron, calcium and their absorption inhibitors in foods commonly consumed in Ethiopia. Journal of Food Composition and Analysis 18(8): 803-817
-
WHO (2003) Feeding and nutrition of infants and young children: Guidelines for the WHO European region with emphasis on the former Soviet Union. Denmark: WHO Regional Publications 87: 296.
-
Balasubramanian S, Kaur J, Singh D (2014) Optimization of weaning mix based on malted And extruded pearl millet and barley. Journal of Food Science and Technology 51: 682 690.
-
World Health Organization (2002) Complementary feeding: report of the global consultation, andSummary of guiding principles for complementary feeding of the breastfed child. Journal de Pediatria, 76(3): S253-S262.
-
Ramakrishna V, Jhanesi Rani P, Ramakrishnarao P (2006) Anti-nutritional Factors duringgermination in Indian bean (Dolichors lablab L.) seeds. World Journal of Dairy and FoodSciences 1: 6-11.
-
Adenuga W (2010) Nutritional and sensory profiles of sweet potato-based infant weaning food fortified with cowpea and peanut. J Food Technol 8(5): 223-228.
-
Ihekoronye AI, Ngoddy PO (2005) Integrated food science and technology for the tropics. London: Macmillan 1985. Inhibitors in foods commonly consumed in Ethiopia. J Food Comp Anal 18: 803-817.
-
AOAC (2005) Association of Official Analytical Chemist. In: Arlington VA (Ed.), Official methods of analysis 18th (Edn.), pp: 806-842.
-
Ruales J, Nair BM (1993) Content of fat, vitamins and minerals in quinoa (Chenopodium quinoa, Willd) seeds. Food Chemistry 48(2): 131-136.
-
Mishra N, Chandra R (2012) Development of functional biscuit from soy flour & rice bran. International Journal of Agricultural and Food Science 2(1): 14-20.
-
Bejar AK, Mihoubi NB, Kechaou N (2012) Moisture sorption isotherms-Experimental and mathematical investigations of orange (Citrus sinensis) peel and leaves. Food Chemistry 132(4): 1728-1735.
-
Gagnon JC, Barber B (2010) Characteristics of and services provided to youth in secure care facilities. Behavioral Disorders 36(1): 7-19.
-
Pyke M (1981) Classification of Wheat: Food Science and Technology. 4th (Edn.), John Murray Publishers Ltd, London, pp: 44-56.
-
Okoye JI, Nkwocha AC, Ogbonnaya AE (2008) Production, Proximate Composition andConsumer Acceptability of Biscuits from Wheat/ Soybean Flour blends. ContinentalJournal of Food Science and Technology 2: 6-13.
-
Iwe MO, Onyeukwu U, Agiriga AN (2016) Proximate, functional and pasting properties of FARO 44 rice, African yam bean and brown cowpea seeds composite flour. Cogent Food & Agriculture 2(1): 1142409.
-
Adebowale KO, Lawal OS (2004) Comparative study of the functional properties of bambarra groundnut (Voandzeia subterranean), jack bean (Canavalia ensiformis) and mucuna bean (Mucuna pruriens) flours. Food Research International 37(4): 355-365.
-
Osundahunsi OF, Fagbemi TN, Kesselman E, Shimoni E (2003) Comparison of thephysicochemical properties and pasting characteristics of flour and starch from red andwhite sweet potato cultivars. Journal of Agriculture and Food Chemistry 51(8): 2232-2236.
-
Gouin S (2004) Microencapsulation: industrial appraisal of existing technologies and trends. Trends in food science & technology 15(7-8): 330-347.
-
Jitngarmkusol S, Hongsuwankul J, Tananuwong K (2008) Chemical compositions, functional properties, and microstructure of defatted macadamia flours. Food chemistry 110(1): 23-30.
-
Wilhelm LR, Dwayne AS, Gerald HB (2004) Introduction: Problem-solving skills. Chapter 1 in food and process engineering technology, 1-21. St. Joseph, Michigan: Society of Agricultural Engineers, ASAE.
-
Isah AP, Danladi Y, Ejike OJ (2013) Proximate composition and some functional properties of flour from the kernel of African star apple (Chrysophyllual albidum). Int J Agric Pol Res 1: 62-66.
-
Eltayeb TK, Zailani S, Ramayah T (2011) Green supply chain initiatives among certified companies in Malaysia and environmental sustainability: Investigating the outcomes. Resources, conservation and recycling 55(5): 495-506.
-
Falola AO, Olatidoye OP, Balogun IO, Opeifa AO (2011) Quality Characteristics of Cookies Produced from Composite Flours of Cassava and Cucurbita Mixita seed. Journal of Agriculture and Veterinary Sciences 3: 1-12.
-
Kanani MK (1985) Studies on the low temperature infrared heat processing of soybeans and maize (Doctoral dissertation, Kouzeh Kanani).
-
Shu XO, Jin F, Dai Q, Wen W, Potter JD, Kushi LH, Ruan Z (2001) Soyfood intake during adolescence and subsequent risk of breast cancer among Chinese women. Cancer Epidemiology, Biomakers & Prevention 10(5):483-488.
- The Role of Podocyte Apoptosis and the Involvement of SIRT1 in Diabetic Nephropathy
- Dealcoholization of Beer by Osmotic Distillation for the Beverage Industry
- Biopolymer-Based Edible Packaging- Biomaterials, Methods, and Applications in Food Industry: An Updated Review
- Influence of Bioprocessing Methods on 'China Rice' (Gawal R1), and Soyabean Supplementation on the Quality of Complementary Food
- Cassava (Manihot esculenta) Varietal Growth, Yield and Cyanide Content Performance in Three Sites in the South- Eastern Semi Arid Regions of Kenya
- Food Waste Treatment, Recycling, Management and Production of Value-Products-An Update on Methodologies and Current Trends