Studies on the Chemical Composition and Storage Properties of Chinchin Enriched with Polyphenol Extracted from Amaranthus Viridis L
The chemical composition and storage properties of enriched chinchin were investigated. Crude polyphenol extract from Amaranthus viridis L was added to chinchin formulations at 0.00%, 1.00%, 2.00%, 3.00% and 5.00% and fried at 155.02 °C for 10.21 minutes. The proximate, mineral, antioxidant properties and shelf life of the enriched chinchin were assessed. The protein (12.35 to 19.81 %), fat (18.17 to 18.59%), crude fibre (0.45 to 0.54%) and ash contents (1.25 to 2.85%) increased as the level of enrichment increased while carbohydrate (62.10 to 53.79 %) and moisture content (5.70 to 4.72%) reduced with increasing level of enrichment. There was increase in mineral (Ca, Mg, K, Fe, Zn) and all antioxidant properties of the samples as enrichment level increased. Sample shelf life also increased as the enrichment level increased. The study concluded that the addition of polyphenol extract significantly improved the nutrients, antioxidant and the shelf stability of chinchin.
Introduction
There is an increasing demand for healthy foods and foods that can provide quick sources of nutrient by modern consumers. This demand initiated the need to produce foods like snacks that provide both convenience and nutrition. The ever-increasing consumption of snack foods has made them a major portion of human nutrition in most countries around the world. Normally they are produced and sold on a large scale commercially [1]. Snacks are mostly made from wheat flour combined with other ingredients and processed by baking or frying. Snack foods play a major role as part of human diet. It constitutes a substantial portion of daily intakes of calories and nutrients by many consumers [2]. Chinchin is a deep fat fried snacks common in West Africa particularly Nigeria. It is usually made from mixed dough (wheat flour, sugar, water, salt, baking powder; other ingredients like eggs, milk, flavorings like nutmeg may also be added). When fried it is usually golden brown in colour, delicious, hard and crunchy. Its aesthetics value makes it desirable to both old and young. It can be served as part of a meal course, eaten in between meals or served as small chops with fruit juice at parties [2, 3]. Chinchin is a snack that promotes versatility with regard to the ingredients and production process. There have been various attempts to enrich snacks in order to improve their functional nutritional and quality by integrating nutritional and functional components into their basic recipes [4, 5, 6, 7].
Underutilized traditional leafy vegetables abound in nature, many of which are of great nutritional health values that can meet the nutritional requirement of the ever- growing world population. In addition to nutrients such as, minerals vitamins carbohydrates, and proteins, plant-based foods produce several phytochemicals [8]. Studies have shown that over 900 different phytochemicals have been detected in foods and over 100 different phytochemicals can be contained in a single vegetable [9]. The usefulness of the indigenous leafy vegetables has not been maximally explored. The dried extract from these vegetables can be added to cereal based foods to enhance the nutrient base. Processing these vegetables, extracting the various active components and incorporating it into commonly consumed cereal based products such as chinchin to improve the nutritional content will pose to be a good initiative. Snacks are frequently consumed food product and are limited in providing the nutrient requirements of the body. Efforts have been made on enriching chinchin with dried vegetables [7, 10]. The results showed remarkable increase in nutrient density. Isolating and incorporating polyphenol into chinchin could further increase the nutrient density and the antioxidant benefits of polyphenol can be better maximized. Furthermore, there is a dearth of knowledge on the feasibility of the use of dried polyphenol isolates in food. Hence the study.
Polyphenols when extracted and concentrated has many biologically important functions, such as defence against degenerative diseases and oxidative stress. Incorporating vegetable polyphenol extract in to snacks, particularly chinchin will improve its nutritional and health values. Thus, snacks serve as a viable vehicle for carrying nutrition and convenience. In addition, indigenous leafy vegetables can be better utilized. Therefore, the objective of this study is to enrich chinchin with dried crude polyphenol isolate from Amaranthus viridis leaves and to assess its nutritional and functional quality.
Materials And Methods
Source of Materials
The materials used are wheat flour, vegetable, sugar, margarine, baking powder, egg, nutmeg, powdered milk and vegetable oil. The ingredients were procured from super market, Ile Ife. The vegetables used Amaranthus viridis were collected from Obafemi Awolowo University, Ile-Ife, Nigeria’s teaching and research farms. All the chemicals used were of analytical grades and were obtained from Sigma Aldrich chemical company (St. Louis, MO), USA. Preparation of Dried Crude Polyphenol Isolate from Amaranthus viridis Leaves Dried Polyphenol isolate was extracted from Amaranthus viridis leaves using the technique described by Famuwagun, et al. [11] with minor alterations. The fresh vegetables were sorted, destalked and rinsed with clean water to remove extraneous materials and sand. Using a clean knife the washed vegetables were chopped. Marlex Excella wet mill (Marlex Appliances PVT, Daman) was used to blend about 50g vegetable leaves in 100ml distilled water (i.e. at the concentration (w/v) of 1:2 solid-solvent ratio) for 5 mins at maximum speed with intermittent breaks. The vegetable leaf slurry was sieved using muslin cloth to remove the fibre. The extract obtained was centrifuged using TDL-5; Bosch, England at 3500 x g for 10 mins. The supernatant obtained was concentrated using rotary evaporator (at 0.09 Mpa, 45°C) to obtain crude polyphenol extract. The crude polyphenol extract was dried to obtain the dried polyphenol extract. The dried polyphenol extract was poured into an air tight container and kept in the refrigerator at 4°C for subsequent use.
Chinchin Production Process
In a large bowl, the wheat flour was sieved, sugar, margarine, eggs, baking powder milk and dried polyphenol extract at 0.00%, 1.00%, 2.00%, 3.00% and 5.00% respectively were thoroughly mixed.
| Ingredient | Quantity of Ingredient | ||||
|---|---|---|---|---|---|
| 0% | 1% | 2% | 3% | 5% | |
| Polyphenol Isolate (g) | 0 | 1 | 2 | 3 | 5 |
| Wheat flour (g) | 100 | 99 | 98 | 97 | 95 |
| Sugar (g) | 20 | 20 | 20 | 20 | 20 |
| Baking powder (g) | 1 | 1 | 1 | 1 | 1 |
| Nut meg (g) | 0.5 | 0.5 | 0.5 | 0.5 | 0.5 |
| Salt (g) | 0.25 | 0.25 | 0.25 | 0.25 | 0.25 |
| Margarine (g) | 12.5 | 12.5 | 12.5 | 12.5 | 12.5 |
| Evaporated milk (ml) | 7.5 | 7.5 | 7.5 | 7.5 | 7.5 |
| Egg (ml) | 20 | 20 | 20 | 20 | 20 |
Table 1: Chinchin Formulation [10].
The flour was rubbed with margarine on the surface and kneaded until it was smooth. The kneaded dough was flattened out to a thickness of about 1 cm and then sliced 1 cm by 1 cm in length into small squares manually using knives and Vernier caliper. One and half (1.5) litres of vegetable oil was poured into a deep fryer (Magic fryer MC1800, China) and heated to the required temperature. The samples were fried at 155.02°C for 10.21 minutes as determined by preliminary studies carried out. The chinchin was removed; excess oil drained off and left to cool before packaging [2]. The chinchin samples were pounded in a mortar to powder form, packaged and labelled accordingly for further analysis. The recipe formulation for the chinchin samples production is shown in Table 1.
Proximate Analysis of Enriched Chinchin Samples
Proximate compositions of the freshly prepared enriched chinchin samples were determined. The samples were analyzed for crude protein, ash content, crude fat, crude fibre, carbohydrate content based on the method of analysis of the Association of Official Analytical Chemists [12].
Determination of Minerals Content of Enriched Chinchin
The analyses for essential mineral elements of the samples were investigated using atomic absorption spectrophotometric method [13]. Half of a gramme (0.5 g) of the sample was weighed into a digestion flask and 10 ml of nitric acid and 10 ml of HCl were added. The mixture was digested for 10 min a micro kjeldahl flask. The digested mixture was filtered using No 1 Whattman filter paper. The filtrate was made up to 50 ml with distilled water. An aliquot was transferred to the Auto-analyser for total phosphorus analysis at 420 nm. The left-over digest was used to determine the other elements (calcium, magnesium, zinc and iron) using the Atomic Absorption Spectrophotometer (Perkin Elmer, model 402) while potassium was determined using flame photometry.
Accelerated Shelf Life Test (ASLT)
The shelf life was determined using the method described by Phimolsiripol & Suppakul [14] and Gitalasa, et al. [15]. The chinchin samples were were packaged in a low density polyethylene bag and stored for 8 weeks in the incubator at the temperature of 25°C, 35°C, and 45°C. Samples were analyzed for peroxide value at interval of 2 weeks.
The calculation of shelf life of the shelf life of chinchin samples using Arrhenius model approach as described by Phimolsiripol & Suppakul [14] was carried out with the stages below.
The right reaction order exhibited by the peroxide formation in the samples was determined by plotting peroxide value against storage time in zero, first and second order. The result of peroxide value during storage was described by the order that gave the highest R2 value. Graphs were plotted between quality parameter (peroxide value) and time. First order kinetic equation was fitted for all the graphs in order to describe the behavior of degradation of quality parameters during storage and the reaction rate (K) for all samples at different storage temperatures were determined.
Following the Arrhenius approach, the value of ln k was plotted against 1/T through the linear regression equation ln k = ln ko-(E/R) (1/T) with ln ko is intercept and E/R is slope, where; Ea: Activation energy (kJ/mol) R: Gas constant (8,315 J/K) K: quality degradation constant Ko: Constant (not depend on the temperature) Ea: Activation energy T: Absolute temperature (C+273) in kelvin From the Arrhenius equation in step b. above the activation energy (Ea) was determined for each sample and the K values for the different samples were obtained.
The shelf life was then determined based on kinetic rate model order one. The formula is as follows;
t = (ln(X/XO) /k (2.1) where; k-reaction rate constant value at various storage temperatures, X-initial peroxide value Xo- maximum allowable level of peroxide in fried foods t- shelf life in week
Antioxidant Determination of Enriched Chinchin
The chinchin samples were milled using a high- speed Marlex Excella dry mill (Marlex Appliances PVT, Daman) for 5 minutes and sieved using 315-micron sieve. The bioactive compounds in the milled samples were then extracted by continuous stirring 10 mg of the sample in 100 ml of methanol for 15 mins at 50, followed by centrifugation at 3500 x g for 15 min at room temperature [16]. The methanolic extract was then evaluated for antioxidant activities using the standard methods described by Famuwagun, et al. [11].
Statistical Analysis
All experiments were conducted in triplicate. Data reported were the average of three determinations. Analysis of variance (ANOVA) was performed on each of the variables and the least significant difference (LSD) test at a significant level P<0.05 were performed using SPSS/16 software to compare the differences between treatment means. Results were expressed as the means ± standard deviation of three separate determinations.
Results and Discussion
Proximate Composition of Chinchin Enriched with Polyphenol Extracted from Amaranthus viridis L
The results of the proximate composition of enriched chinchin samples are described in Table 2. The crude protein, carbohydrate, crude fat, crude fibre, ash and moisture contents were analysed for all the samples.
| Sample | Protein (%) | Carbohydrate (%) | Fat (%) | Crude fibre (%) | Ash (%) | Moisture (%) |
|---|---|---|---|---|---|---|
| A | 12.35 ± 0.22e | 62.10± 0.100a | 18.17 ± 0.03d | 0.45.± 0.02a | 1.25 ± 0.02e | 5.70 ± 0.13a |
| B | 14.36 ± 0.30d | 59.81 ± 0.29b | 18.21 ± 0..15d | 0.46 ± 0.02a | 1.86± 0.02d | 5.31± 0.03a |
| C | 15.29± 0.01c | 58.67 ± 0.14c | 18.38 ± 0.03c | 0.48 ± 0.04a | 2.11 ± 0.04c | 5.09 ± 0.03b |
| D | 17.28 ± 0.16b | 56.39 ± 0.26d | 18.48± 0.59b | 0.51 ± 0.01b | 2.55 ± 0.04b | 4.80 ± 0.02c |
| E | 19.81 ± 0.07a | 53.79± 0.15e | 18.59± 0.02a | 0.54 ± 0.02c | 2.85 ± 0.02a | 4.72± 0.06d |
| P | 20.36 ± 0.01 | 71.86 ± 0.0 | 0.95 ± 0.01 | 0.86 ± 0.01 | 3.49 ± 0.03 | 2.49 ± 0.01 |
Table 2: Proximate Composition of Wheat Chinchin and Polyphenol Enriched Chinchin. Values are means of triplicate determinations
Table 2: Proximate Composition of Wheat Chinchin and Polyphenol Enriched Chinchin. Values are means of triplicate determinations ± standard deviation. The mean values along the same row with different superscripts are significantly different (p>0.05) using Duncan multiple range test A-100% wheat Chinchin B-Chinchin enriched with 1% vegetable polyphenol. C-Chinchin enriched with 2% vegetable polyphenol D-Chinchin enriched with 3% vegetable polyphenol E-Chinchin enriched with 5% vegetable polyphenol P-Polyphenol isolate The protein content ranged between 12.35 and 19.81% showing an increase as the level of enrichment increased. The observed increase in protein content of the enriched chinchin may be due to the high protein content of the isolate; the isolate has 20.36% of protein. The percentage increase in protein with enrichment was from 16.42 to 60.60% for 1 to 5% levels of enrichment. The protein contents of all the enriched samples were significantly (p˃0.05) higher than the control 100% wheat chinchin which indicates that the enrichment of wheat flour with polyphenol isolates improved the protein content of the chinchin.
The increase in protein content of enriched chinchin samples as the level of enrichment increased was similar to the trend reported by Akindele, et al. [10] and Fasogbon, et al. [17]. They reported similar percentage increase in protein content of 5.23-38.73% (1.5-5% enrichment level) and 16-35% (0.55-3.50% enrichment level) respectively for chinchin enriched with dried vegetables. It should be noted that Akindele, et al. [10] and Fasogbon et al. [17] incorporated dry vegetable powder into chinchin while this study used isolates from dried vegetables. The higher percentage increase in protein content recorded in this study shows isolates could be a better option for enrichment.
The values obtained for protein in this study are also within the range of values for biscuits incorporated with vegetables (11.6-23.8%) reported by Singh & Awasthi and those reported by Singh and Rajini for biscuits and cake prepared from dried spinach leaves (9.60-16. 62%). Enrichment of chinchin with dried moringa powder significantly increased the protein content of the product when compared to the control [18]. High protein content was also reported for cookies enriched with 10% Bambara groundnut protein concentrate produced from plantain flour reported by Kiin-Kabari & Giami [19]. Fasogbon et al. [17] noted that the high protein content in enriched snacks would be of nutritional importance in Nigeria and other developing countries where proteinous foods are expensive.
The values for carbohydrate content ranged from 53.79 to 62.10%. The results showed a significant (p>0.05) decrease in carbohydrate content as level of enrichment increased. The reduction in the carbohydrate content of enriched chinchin samples is probably due to the significant amount of protein (20.26 %) in the isolate powder. The 100% wheat based sample had the highest carbohydrate value of 62.10% and was found to be significantly (p>0.05) different from the enriched samples while the sample E (5% enrichment) had the lowest carbohydrate content of 53.79 %, other enriched samples (1,2 and 3% enriched levels) followed the same pattern of reduction. The percentage decrease in the carbohydrate content was in order of 3.68, 5.52, 9.92 and 13.86 % for 1, 2, 3, and 5% enrichment levels of isolates respectively.
Akindele, et al. [10] reported a trend of percentage decrease of 4.26 to 10.02 % in carbohydrate content of enriched chinchin with increase in amount of dried vegetable added, which is similar to the trend observed in this study.
Crude fat content of the chinchin samples ranged from 18.17 to 18.59%. The crude fat contents of the enriched chinchin sample at 1% enrichment level was not significantly (p>0.05) different from the reference 100% wheat chinchin. However, with the increase in enrichment levels from 2% to 5% significant differences were observed in the fat content of the samples. This indicates that the enrichment of chinchin with the polyphenol isolate caused a slight increase in the crude fat content of the enriched chinchin samples. The sample with 5% enrichment level had the highest fat content of 18.59% while the 100% wheat chinchin had the lowest fat content (18.57%). Percentage increase in crude fat with enrichment is 0.22 to 2.34 % for 1 to 5% level of enrichment. Akindele, et al. [10] reported an increase of 18.51 to 48.59% (1.5%- 5% level of enrichment) chinchin enriched with dried ugu vegetable. Fasogbon also reported a 29.52 to 35.27% increase in crude fat content of chinchin enriched with dried leaves of Solanum macrocarpon (igbagba), Telfaria occidental (ugwu) and Amaranthus viridis (tete abalaiye) vegetables. This percentage fat increase is higher than the values obtained in this study. This could be due to the fact that vegetable isolate was used in this study. Studies by Agbede, et al. [20], Sharoba, et al. [21], Borja, et al. [22] showed that vegetables have high oil absorption capacity but values obtained from this study indicate that processing to polyphenol isolate may give lower percentage increase in fat content of fried product. The values for fat content obtained in this study are within the range for acceptable fried snack in terms of sensory attributes and storage stability which according to Garayo & Moreira [23] should contain not greater than 35% oil content. Fasasi [24] also reported that low fat content in a dry product will help in increasing the shelf life of the sample by decreasing the chances of rancidity and also contribute to low energy value of the food product while high fat content product will have high energy value and promote lipid oxidation.
The crude fibre content values ranged between 0.46 to 0.54%. Sample A with 100% wheat had the least value of 0.46% while sample with 5% enrichment level (sample E) had the highest value of 0.54%. There were slight increases in crude fibre content values of samples with enrichment levels 0, 1 and 2% but no significant difference (p<0.05) was observed though there was significant difference (p<0.05) between samples at 3 and 5% enrichment levels. The isolate has crude fibre content of 0.86%. The percentage increase in crude fibre with enrichment is 1.10 to 18.68 % for 1 to 5% level of enrichment. The values for fibre content obtained in this study (0.46 to 0.54%) are lower when compared to the values (1.80-2.17%) reported by Akindele, et al. [10] for chinchin enriched with dried vegetable leaf powder. The fact that polyphenol isolate which has undergone extraction processes such as sieving and centrifuging was used in this study could be responsible for the low crude fibre content observed in this study.
The ash values content ranged from 1.25 to 2.85%. The enriched samples at 1, 2, 3, and 5% had ash contents of 1.86, 2.11, 2.55 and 2.85% respectively which were individually significantly higher (p>0.05) than that of the 100% wheat chinchin (1.25%). The ash content values of samples increased from 48.4% to 128 % for 0 to 5% level of enrichments. The increase in ash content observed was justified by the relatively high percentage ash content of the polyphenol isolate which is about 3.49%.
A Similar trend of increase was reported by Akindele, et al. [10] for chinchin enriched with dried vegetables from Ugu and Indian Spinach Fasogbon, et al. [17] reported for cookies and chinchin enriched with dried vegetables from Solanum macrocarpon (igbagba), Telfaria occidental (ugwu) and Amaranthus viridis (tete abalaiye). Adegunwa, et al. [25] also reported an increase in ash content as level of millet substitution increased in composite millet wheat chinchin. The ash content is said to give a rough perception of the mineral contents of the samples [3].
Moisture contents of the samples varied from 4.72 to 5.70% with the 100% based chinchin having the highest value (5.70%) while the 5% enriched sample recorded the lowest moisture content. Generally, there was reduction in moisture content as the level of enrichment increased. Fasogbon, et al. [17] and Akindele, et al. [10] reported moisture content of 3.00 to 6.5 and 4.17 to 5.30% for chinchin enriched with dried vegetables respectively. These values are similar to the values obtained in this study.
The significant decrease in moisture content as the level of enrichment increased could be due to the absorption of moisture by the dough for rehydration, as more water may be required for rehydration as vegetable quantity increased, thus lowering the final moisture content of the snack foods [17]. The moisture content of a food is indicative of the dry matter in that food. Sanni, et al. [26] noted that products with lower moisture contents tend to have better storage stability than the ones with higher moisture content. Hence, low moisture ensures higher shelf stability of dried product. Low residual moisture content in confectionaries is particularly advantageous in that packaging material under good environment condition [25]. Microbial proliferation is reduced and storage life may be prolonged if stored inside appropriate
Mineral Composition of Chinchin Enriched with Polyphenol Extracted from Amaranthus viridis L
The results of the minerals (Calcium, Zinc, Iron, Potassium, and Magnesium) contents of enriched chinchin evaluated in mg/100 g are presented in Table 3. From this data, it was observed that values for minerals content of all enriched samples increased significantly as the level of inclusion of vegetable polyphenol increased.
| Sample | Magnesium | Calcium | Zinc | Iron | Potassium |
|---|---|---|---|---|---|
| A | 103.62 ± 0.01e | 89.95 ± 0.01e | 2.37 ± 0.01e | 6.94 ± 0.01e | 172.96 ± 0.08e |
| B | 104.14 ± 0.12d | 90.89 ± 0.03d | 2.49± 0.01d | 7.75± 0.01d | 260.12 ± 0.12d |
| C | 136.17 ± 0.07c | 94.91 ± 0.01c | 2.84 ± 0.02c | 8.29 ± 0.00c | 286.39± 0.08c |
| D | 155.95 ± 0.04b | 105.84 ± 0.70b | 3.44 ± 0.01b | 8.76 ± 0.02b | 289.33 ± 0.16b |
| E | 170.95 ± 0.03a | 111.85 ± 0.01a | 3.50 ± 0.02a | 10.34 ± 0.01a | 321.35± 0.06a |
| P | 340.00 ± 0.01a | 439.40 ± 0.20a | 4.97 ± 0.2 | 44.4. ± 0.03a | 470.22±0.03 |
Table 3: Mineral composition (mg/100g) of Wheat Chinchin and Polyphenol Enriched Chinchin. Values are means of triplicate determi
Table 3: Mineral composition (mg/100g) of Wheat Chinchin and Polyphenol Enriched Chinchin. Values are means of triplicate determinations ± standard deviation. The mean values along the same row with different superscripts are significantly different (p > 0.05) using Duncan multiple range test A-100% wheat Chinchin B–Chinchin enriched with 1% vegetable polyphenol C-Chinchin enriched with 2% vegetable polyphenol D-Chinchin enriched with 3% vegetable polyphenol E-Chinchin enriched with 5% vegetable polyphenol P-Polyphenol isolate The result shows a significant difference in the values of magnesium content for all samples (p>0.05). The content of magnesium ranged between 103.62 and 170.95 mg/100 g, which depicted an increase of about 0.50%-64.97 % for 1 to 5% enrichment level. This shows that the values for magnesium content increased as the level of incorporation of vegetable polyphenol increases. This increase could be largely attributed to the inherently large amount of magnesium (340mg/100g) in the vegetable polyphenol isolate.
This result is similar to the trend reported by Fasogbon, et al. [17] who reported that the magessium content of chinchin enriched with dried vegetables (Solanum macrocarpon (igbagba), Telfaria occidental (ugwu) and Amaranthus viridis (tete abalaiye) at 0.55-3.5% incorporation gave magnesium content values ranging from 118.25 to 131.11 mg/100g. Akindele, et al. [10] observed an increase of 53.92 to 131.33% in magnesium content of chinchin samples with addition of Indian spinach. The recommended daily allowance (RDA) for magnesium is 320 mg.
The potassium content of chinchin samples as presented in Table 3 ranged between 172.96 and 321.35 mg/100g which shows an increase of about 50.89 to 85.79% for 1 to 5% polyphenol isolate inclusion. The reference 100% wheat Chinchin had the lowest potassium composition of 172.92% while the sample with the highest enrichment level (5%) had the highest potassium content of 321.25%. This result shows there is a significant (p>0.05) increase in the potassium content of all samples as the level of incorporation increases. According to Akindele, et al. [10] the values of potassium content for chinchin enriched with dried vegetable ranged from 261.30 to 425.89 mg/100 g with a percentage increase of 32.57 to 62.99% as the amount of vegetable incorporated into chinchin is increased. This result suggests that potassium content was less when enriched with isolate compared to when dried vegetable powder was used. Percentage increase is higher with isolate (50.89 to 85.79%) than in vegetable powder (32.57 to 62.99%). However, the values of potassium content are higher in chinchin samples enriched with dried vegetable powder (261.30 to 425.89 mg/100 g) than in the samples enriched with polyphenol isolate (172.96 and 321.35 mg/100g).Potassium is an essential nutrient and has an important role in the synthesis of amino acids and proteins.
Iron content ranged from 6.94 to 10.44%, which depicted 11.67 to 48.99% percentage increase in iron content. 100 % wheat based chinchin recorded significantly (p ˂ 0.05) lower iron content (6.94%) when compared with the enriched samples with 7.75, 8.29, 8.76 and 10.34% at 1%, 2%, 3% and 5% enrichment levels respectively. This shows a significant increase in iron content of enriched samples as the degree of enrichment increased. Akindele, et al. [10] reported 34.54 to 49.69 mg/100 g for the values of chinchin enriched with dried vegetable giving 16.94 to 43.86% with increase in incorporation of vegetable. The trend of result obtained in this study is also in agreement with the observation of Gupta & Prakash [27] that the iron content of mathri increased from 2.39 mg/100 g in the control sample to 6.03 mg/100 g when 12% greens were incorporated into the product. The human body needs iron for the formation of the oxygen carrying protein haemoglobin and myoglobin. Iron helps in the formation of red blood cells and is an important element in the diet of pregnant women, nursing mothers, infants, convulsing patients and elderly to prevent anaemia and other related diseases [28].
Zinc content varied with significant differences (p>0.05) among the samples. The zinc content values for all samples ranged between 2.37 and 3.50%. Sample E (5% isolate enrichment) had highest value of 3.50% while sample a (100 % wheat) had the lowest value of 2.37%. This result showed that there is a percentage increase in zinc content of the samples by 5.06 to 46.68 % as the amount of polyphenol incorporated into chinchin is increased. This result is similar to the trend reported by Akindelem, et al. [10] on chinchin enriched with dried vegetables powder, who reported an increase in zinc content from 4.97-61.97 % with increase in incorporation of vegetable into chinchin. The maximum increase of 61.97% from Akindele, et al. [10] is greater than 46.68 % increase obtained in this study. It should be noted that Akindele’s sample were complete dried vegetable leaves not extract. Leaves still contained fibre which could contribute to the mineral content of the chinchin samples. Zinc is an essential micronutrient that helps in the formation of protein in the body thus positively influencing blood formation, wound healing, taste perception, growth and maintenance of all tissues and healthy immune system components of many enzymes [29].
The calcium in the wheat chinchin and enriched chinchin ranged between 89.95 and 111.85 mg/100 g. This showed an increase of 1.04 to 24.34% for 1 to 5% polyphenol isolate inclusion. Calcium values in this study were significantly (p>0.05) higher in enriched samples than in sample with 100% wheat (89.95%) owing to the high composition of calcium (439mg/100 g) in the isolate. The chinchin sample with the highest (5%) enrichment level of had the highest composition (111.85 mg/100 g) of calcium. The calcium content of all samples reported in this study are lower than the reported calcium content (591.62 to 1684.27 mg/100 g.) reported by Akindele, et al. [10] but similar to the calcium content (738.6 -1266 mg/kg) reported by Fasogbon, et al. [17] for chinchin enriched with dried vegetables (Solanum macrocarpon (igbagba), Telfaria occidental (ugwu) and Amaranthus viridis (tete abalaiye) at 0.55-3.5%.
Generally, the addition of vegetable increased the mineral levels of chinchin samples. In a study of the quality of composite maize-wheat chinchin enriched with bean weevils Ojinnaka, et al. [30] reported no significant differences in the calcium and potassium contents of the chin-chin enriched with edible palm weevil paste. But there were significant differences in the phosphorus, magnesium and sodium compositions of the samples. The calcium values were in the range of 25.39-30.91 mg/100g while those of magnesium were in the range of 5.60-13.60 mg/100g.Vegetables are valuable sources of nutrients especially in rural areas where they contribute substantially to protein, minerals, vitamins, fibres and other nutrients which are usually in short supply in daily diets [31]. Potassium which has been reportedly described as the most predominant mineral in Nigerian agricultural products [32] was found to be the most abundant mineral element in all the fortified samples followed by magnesium, calcium, iron and zinc in descending order.
Antioxidant Properties of chinchin enriched with polyphenol extract from Amaranthus viridis L
The antioxidant activities of enriched chinchin samples are shown in Table 4. Total flavonoid content of chinchin enriched with polyphenol isolate was observed to range between 5.23 and 11.29 mg CE/g for samples A and E (100% wheat based chinchin and 5% enriched chinchin respectively). There was significant (p>0.05) increase in the total flavonoid content as the level of enrichment increased. The percentage increase is about 32.50 to 115.87% for 1 to 5% level of enrichment.
| Sample | TFC | DPPH | FRAP | TPC | MCA |
|---|---|---|---|---|---|
| (mg CE/g) | (%) | (mg AAE/g) | (mg GAE/g) | (%) | |
| A | 5.23 ± 0.11e | 21.51 ± 0.52e | 27.62 ± 0.09e | 61.87 ± 0.53e | 28.95 ± 0.07e |
| B | 6.93± 0.06d | 27.04 ± 0.09d | 38.84 ± 0.42d | 99.50± 0.35d | 32.55 ± 0.63d |
| C | 8.20 ± 0.40c | 34.37 ± 0.06c | 44.69 ± 0.42c | 115.63± 0.53c | 43.15± 0.64c |
| D | 8.88 ± 0.01b | 41.86 ± 0.59b | 48.70± 0.20b | 166.94± 0.08b | 50.75± 0.49b |
| E | 11.29 ± 0.28a | 71.80± 0.29a | 57.10 ± 0.93a | 225.38± 0.88a | 59.07± 0.57a |
| P | 25.36 ±0.12 | 98.1±0.43 | 82.0±0.25 | 656.00±0.12 | 68.83±0.32 |
| Ascorbic acid | N/A | N/A | 122.2±0.32 | N/A | N/A |
Table 4: Antioxidant composition of chinchin enriched with polyphenol from _Amaranthus viridis_ L. The mean values along the same
Table 4: Antioxidant composition of chinchin enriched with polyphenol from Amaranthus viridis L. The mean values along the same row with different superscripts are significantly different (p ˃ 0.05) using Duncan multiple range test. A-100% wheat Chinchin B–Chinchin enriched with 1% vegetable polyphenol C-Chinchin enriched with 2% vegetable polyphenol. D-Chinchin enriched with 3% vegetable polyphenol E-Chinchin enriched with 5% vegetable polyphenol P- Polyphenol isola FRAΡ- Ferric reducing antioxidant power (milligram Ascorbic Acid Equivalent/ gram) DPPH- Diphenyl-1-picryhydrazyl Radical Scavenging Inhibition (%) TFC-Total flavonoid content (milligram Catechin Equivalent/ gram TPC-Total Phenolic content (milligram Gallic acid Equivalent/ gram) MCA - Metal Chelating Activity (%) Similar to this report Ewulo, et al. [33] reported an increase (1.04 to 40.56%) in flavonoid content of formulated kokoro with attendant increase in the substitution of moringa flour into the flour mixture. This shows that vegetable leaves are good source of natural antioxidants.
The percentage DPPH (Diphenyl-1-picryhydrazyl) radical scavenging inhibition activities of aqueous extracts of 100% wheat chinchin and chinchin enriched with polyphenol isolates are presented on Table 4. The values ranged between 21.51 and 71.80%. A significant (p>0.05) increase in DPPH radical scavenging activity was observed in all the samples as the level of enrichment increased.
The enriched chinchin samples exhibited better DPPH radical scavenging activity than the 100% wheat based sample (21.51%) while the highest DPPH radical scavenging activity was observed in the sample with 5% polyphenol (71.80%). Ajibola, et al. [34] also reported a similar trend for cookies enriched with dried Moringa leaves.
Antioxidants are known for their free radical scavenging abilities and therefore, neutralize free radicals that have the ability of stimulating reaction that make the cells more vulnerable to cancer causing chemicals, called carcinogen [35].
The ferric reducing antioxidant power (FRAP) content of chinchin samples expressed in milligrammes ascorbic acid equivalent per gramme (mg AAE/g) as presented in Table 4. Ranged between 27.62 and 57.10 mg AAE/g. This result shows there was a significant (p>0.05) increase in the FRAP of all samples as the level of incorporation increased.
All the chinchin samples shows substantial ferric reducing antioxidant activities but most importantly, the sample with the highest enrichment level (5%) had the highest ferric reducing antioxidant activity (57.10 mg AAE/g) while the reference100% wheat Chinchin had the lowest ferric reducing antioxidant activity (27.62 mg AAE/g). This depicted an increase of about 40.62 to 106.73% for 1 to 5% polyphenol isolate inclusion. A similar trend was reported by Ajibola, et al. [36] for biscuit supplemented with moringa. Pitchaporn, et al. [37] reported that FRAP values of the extracts of fortified rice flake (11.94 mMFeSO4/g sample) were significantly higher than that of unfortified product (6.60 mMFeSO4/g sample). This result agrees with report that vegetables contain a wide variety of bioactive, non- nutritive compounds known as phytochemicals and different antioxidants such as Vitamin C and E, Carotenes, Polyphenols [38].
The reducing properties of antioxidants are generally associated with the presence of reductones, which has antioxidant activity by breaking the free radical chain through electron transfer reactions [39]. In this study, the ability of chinchin extracts to act as a reducing agent in different degrees by transforming the Fe+3/ferricyanide complex to the ferrous state (Fe+2) was enhanced by the enrichment with polyphenol isolate at different levels. This reductive capacity (transformation of Fe3+ to Fe2+) of a given sample could serve as a significant indicator for its potential antioxidant activity [36].
The content of phenolic of aqueous extracts chinchin samples enriched with polyphenol isolate is presented in Table 4. The level of phenolic compounds expressed in milligrams of Gallic acid equivalent per gram (mg GAE/g) of the samples ranged from 60.82 to 225.38 mg GAE/g reflecting a significant (p<0.05) increase in total phenolic content as the level of enrichment increased. Samples with 5% enrichment level had the highest total phenolic content while the 100% wheat based chinchin had the lowest phenolic content. The observed increase in Phenolic content of the enriched chinchin samples may be due to the inherently high total phenolic content of the isolate, the total phenolic content of the isolate is 656 mg GAE/g. It should be noted that vegetables especially Amaranthus viridis L from which the isolate used in this study was extracted is reported to be rich in phenolic content [40].
The percentage increase in phenolic content with enrichment was 60.82 to 264.28% for 1 to 5% level of enrichment. Similar trend increase in polyphenolic compounds as level of enrichment increased was observed in biscuits incorporated with Moringa oleifera Leaves and biscuits supplemented with Bambara groundnut and orange peel [34, 41].
The percentage metal chelating ability (MCA) of all samples increased significantly (p˃0.05) increase with enrichment and the values ranged from 28.95 to 68.83%.
The metal chelating ability is such that the chinchin with polyphenol had higher values than samples without polyphenol. There was an increase of 12.43 to 104.04 % as the level of polyphenol addition increased from 0 to 5%. This is in agreement with the findings of Pitchaporn, et al. [37] who reported that fortification of flake products with rice bran increased the chelating ability of the product.
The chelating ability of the samples measures how effectively the compounds in the sample can compete with ferrozine for ferrous ion to stop oxidation. The chelating ability of enriched samples increased due to the incorporation of vegetables which is a rich source of antioxidant [42].
The chelating activity of the enriched chinchin samples could enhance ability of tissues to reduce the rate of deteriorative metal-catalysed lipid oxidation. Metal chelating is an example of a secondary antioxidant mechanism by which many natural antioxidants can influence the oxidation process by preventing oxidative assault on biological macromolecules such as lipids, proteins and nucleic acids [43].
Shelf life is to shed light on the changes that occur in product quality over time and explain the effects of storage time, storage condition, and composition of chinchin. These effects are discussed below.
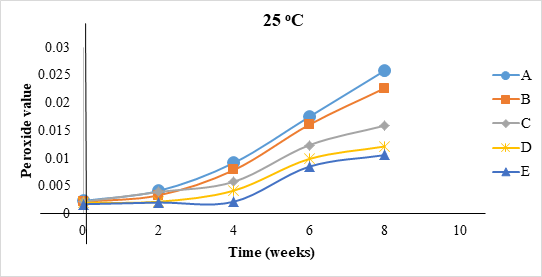
Effect of Storage Time on Peroxide Value of Chinchin: The variation in the value of peroxide during storage for 8 weeks at three different temperatures (25, 35 and 45°C) for samples A, B, C, D and E is depicted in Figure 1. The peroxide value ranged between 0.002-0.107 and 0.002-0.011 mEq kg-1 for samples with the highest (sample A; stored at 45°C) and sample with the lowest peroxide accumulation (E; 25°C) respectively.
![Figure 2: The rate constants (K) were obtained for all samples from the first order kinetic equation for all storage temperature and presented in Table 6. The rate constant ranges from 0.3431 to 0.2175, 0.3967 to 0.2634 and 0.4803 to 0.392 per week across the samples for storage temperatures 25, 35 and 45℃ respectively. The rate constant increase as the storage temperature increases and it decreases as the level of polyphenol incorporation into the sample increases. As the reaction rate constant increases, the degradation rate increases and vice versa. Martins, et al. [49], Wahyuni, et al. [50] noted that the rate of chemical reactions would generally accelerate at higher temperatures, which means the decrease in product quality is faster at higher temperature. The accelerated storage method is use to accelerate the damage process, including oxidation reactions that cause rancidity in the food products. The acceleration method is achieved by increasing the storage temperature.](/fulltextimages/6541/fig_2.jpeg)
Figure 1: Effect of Storage Temperature and Time on Peroxide Value of the Enriched Chinchin Samples. A-100% wheat Chinchin B-Chinchin enriched with 1% vegetable polyphenol. C-Chinchin enriched with 2% vegetable polyphenol D-Chinchin enriched with 3% vegetable polyphenol E-Chinchin enriched with 5% vegetable polyphenol The Peroxide value increased with storage temperature and time for all levels of enrichment. Samples stored at 250°C had the lowest percentage increase (0.08%-0.85% and 0.13%-2.64% for sample E and A with the lowest and highest value at 25°C respectively) in peroxide value while samples stored at 45°C (0.24-3.90% and 0.47- 10.52% for sample E and A with the lowest and highest value at 45°C respectively) had significant increase in peroxide value.
For all samples the higher the storage temperature the higher the in peroxide value. The trend of increase in peroxide value with storage time is similar to the trend observed by Akindele, et al. [10] and Jonnalaggada, et al. [44]. They reported steady increase in the value peroxide of deep fat fried snacks as the storage time increases. The gradual increase in peroxide value may be caused by enzymatic hydrolysis of the lipids present in the chinchin samples which causes peroxide formation during storage [45]. Peroxide value increased with storage temperature and time for all levels of enrichment this trend was also reported by Yadav, et al. [46] for vegetable enriched pasta stored for 3 months. Gautam & Gupta [47] reported two folds’ increase in peroxide value of extruded composite millet-based snack after 90 days of storage at room temperature.
Berger [48] also reported that the rate of reaction of oxygen with fat can double with every 10-degree Celsius increase in temperature. The rate of reaction can be slowed by keeping fats in the coolest storage conditions possible.
Although peroxide value increased at all storage temperatures, it was observed that the higher the enrichment level the lower the percentage increase in peroxide value at the same temperature. Across all storage temperatures, sample E (5% polyphenol enrichment) had significantly (p>0.05) lower percentage increase in peroxide value while sample A (0% enrichment) had the highest increase in peroxide value. This could be due to the antioxidant activities of the polyphenol isolate from Amarathus viridis which was used to enrich the samples. Similar to the report of Akindele, et al. [10] peroxide value of samples decreased with increase in incorporation of dried vegetable into chinchin. The process of peroxide formation in foods can be controlled by adding antioxidants that react with free radicals and slow down auto oxidation or the natural formation of peroxides [10]. Jadhav & Biradar [40] reported that extracts of leaves of Amaranthus viridis are very good sources of antioxidant phenolic compounds and can be used after isolation as food additives in lipids and lipid containing foods to minimize rancidity, retard the formation of toxic oxidation products, maintain nutritional quality and increase the shelf life of food products.
Accelerated Shelf Life Prediction of Chinchin Samples ASLT Method with Arrhenis Model Order of Reaction: Table 5 shows the estimated R2 values for peroxide value in zero, first and second order reaction.
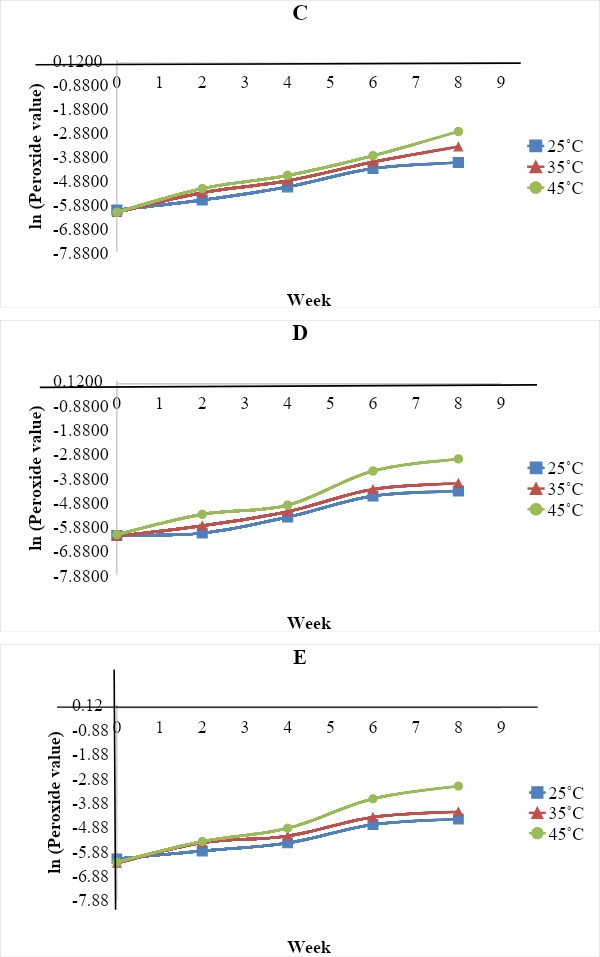
From the equations first order reaction order was selected since it gave the highest R2 for all samples across the storage temperatures. The first order kinetic parameter which shows the relationship between ln X (ln of peroxide values) and the time of storage was plotted for all samples as shown in Figure 2. The rate constants (K) were obtained for all samples from the first order kinetic equation for all storage temperature and presented in Table 6. The rate constant ranges from 0.3431 to 0.2175, 0.3967 to 0.2634 and 0.4803 to 0.392 per week across the samples for storage temperatures 25, 35 and 45℃ respectively. The rate constant increase as the storage temperature increases and it decreases as the level of polyphenol incorporation into the sample increases. As the reaction rate constant increases, the degradation rate increases and vice versa. Martins, et al. [49], Wahyuni, et al. [50] noted that the rate of chemical reactions would generally accelerate at higher temperatures, which means the decrease in product quality is faster at higher temperature. The accelerated storage method is use to accelerate the damage process, including oxidation reactions that cause rancidity in the food products. The acceleration method is achieved by increasing the storage temperature.
![Figure 3: Arrhenius plot (ln x vs. 1/T) for peroxide value rate constant of chinchin samples during storage. A - 100% wheat Chinchin B – Chinchin enriched with 1% vegetable polyphenol. C - Chinchin enriched with 2% vegetable polyphenol D- Chinchin enriched with 3% vegetable polyphenol E - Chinchin enriched with 5% vegetable polyphenol The activation energy Ea (KJ/mol) of the samples. The values for Ea ranged between 12.61 to 25.06 KJ/mol with sample A (0% enrichment) having the least value while sample E (5% enrichment) has the highest value. The result shows an increase in activation energy as the enrichment level increased. This means that the energy barrier that must be overcome in order for the degradation reaction to occur increased with the level of incorporation of polyphenol into the samples. This further confirmed the reason for the decrease in the reaction rate constant as shown in Table 6. As the enrichment level increased. The higher the activation energy the lower the reaction rate and vice versa [51].](/fulltextimages/6541/fig_3.jpeg)
| Samples | Storage | Zero Order | First order | Second order |
|---|---|---|---|---|
| Temperature (℃) | (X vs t) | (ln X vs t) | (1/X vs t) | |
| A | 25 | 0.8813 | 0.9942 | 0.9171 |
| 35 | 0.8103 | 0.994 | 0.7937 | |
| 45 | 0.7642 | 0.9947 | 0.7508 | |
| B | 25 | 0.9282 | 0.9839 | 0.9292 |
| 35 | 0.8878 | 0.9834 | 0.9031 | |
| 45 | 0.8167 | 0.9943 | 0.8386 | |
| C | 25 | 0.9419 | 0.9815 | 0.8915 |
| 35 | 0.8766 | 0.9961 | 0.8484 | |
| 45 | 0.7803 | 0.9918 | 0.8066 | |
| D | 25 | 0.9025 | 0.9419 | 0.9316 |
| 35 | 0.9025 | 0.9751 | 0.9446 | |
| 45 | 0.8597 | 0.9706 | 0.8612 | |
| E | 25 | 0.9466 | 0.9704 | 0.996 |
| 35 | 0.9466 | 0.986 | 0.8229 | |
| 45 | 0.8735 | 0.9654 | 0.8444 |
Table 5: Comparison of R2 values of reaction orders of peroxide formation. X- peroxide valuet t- Time (week) A-100% wheat Chinchi
| Sample | Polyphenol content | K | ||
|---|---|---|---|---|
| (%) | 25℃ | 35℃ | 45℃ | |
| A | 0 | 0.3431 | 0.3967 | 0.4803 |
| B | 1 | 0.3111 | 0.3872 | 0.4476 |
| C | 2 | 0.2636 | 0.337 | 0.4046 |
| D | 3 | 0.2586 | 0.2923 | 0.4002 |
| E | 5 | 0.2175 | 0.2634 | 0.392 |
Table 6: Rate constants for fat peroxide formation assuming first order reaction kinetics of Chinchin samples. K-rate constant A-
Table 6: Rate constants for fat peroxide formation assuming first order reaction kinetics of Chinchin samples. K-rate constant A-100% wheat Chinchin B-Chinchin enriched with 1% vegetable polyphenol C-Chinchin enriched with 2% vegetable polyphenol D-Chinchin enriched with 3% vegetable polyphenol E-Chinchin enriched with 5% vegetable polyphenol Using the Arrhenius equation, the value of ln k was plotted against 1/T (Figure 3) using the linear regression equation ln k = ln ko-(E/R) (1/T) with ln ko is intercept and E/R is slope.
Coefficient values obtained are the pre exponential factors and the activation energy value of the change reaction on the characteristics of the chinchin samples.
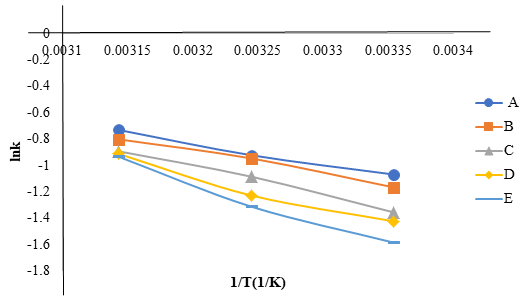
Figure 3: Arrhenius plot (ln x vs. 1/T) for peroxide value rate constant of chinchin samples during storage. A - 100% wheat Chinchin B – Chinchin enriched with 1% vegetable polyphenol. C - Chinchin enriched with 2% vegetable polyphenol D- Chinchin enriched with 3% vegetable polyphenol E - Chinchin enriched with 5% vegetable polyphenol The activation energy Ea (KJ/mol) of the samples. The values for Ea ranged between 12.61 to 25.06 KJ/mol with sample A (0% enrichment) having the least value while sample E (5% enrichment) has the highest value. The result shows an increase in activation energy as the enrichment level increased. This means that the energy barrier that must be overcome in order for the degradation reaction to occur increased with the level of incorporation of polyphenol into the samples. This further confirmed the reason for the decrease in the reaction rate constant as shown in Table 6. As the enrichment level increased. The higher the activation energy the lower the reaction rate and vice versa [51].
From the Arrhenius equations obtained, Arrhenius constant value at each storage temperature was calculated [50]. The obtained k values on Table 6 were inserted in the equation of the reaction order to obtain the shelf life of the chinchin samples at different storage temperatures. To determine the storage life of chinchin samples by putting the temperature value into the equation ln k = ln ko-(E/R) (1/T).
Taking 10 meqO2/kg as the maximum allowable level of peroxide in oil and oil containing foods. Presented on Table
7b is the shelf life estimated for chinchin samples at different storage temperatures. The values are between 24.85 to 42.48, 21.04 to 30.54 and 17.97 to 22.31 weeks for samples A, B, C, D and E stored at 25℃, 35℃ and 45℃ respectively. It was observed that at all levels of enrichment the shelf life of the samples decreased as the storage temperature increased.
As the level of enrichment increased the shelf life of polyphenol enriched chinchin reduced at the same temperature of storage. This may be a result the increase antioxidant activities of the enriched chinchin. The maximum permissible limit of peroxide value in oil/fats is specified to be 10 mEq/Kg of oil, as per FSSAI regulation.
Similar to the trend observed in this study Phimolsiripol & Suppakul [14] predicted the shelf lives of mayonnaise formulas enriched with propolis extract (Figure 3). It was discovered that 2% of propolis extended mayonnaise shelf life by 11 weeks compared to the mayonnaise without propolis (control). Thejani, et al. [52] also predicted the shelf life of Savory rice crackers and sweet rice using accelerated storage test to be 11 months and 9.2 months respectively under normal atmospheric storage [53].
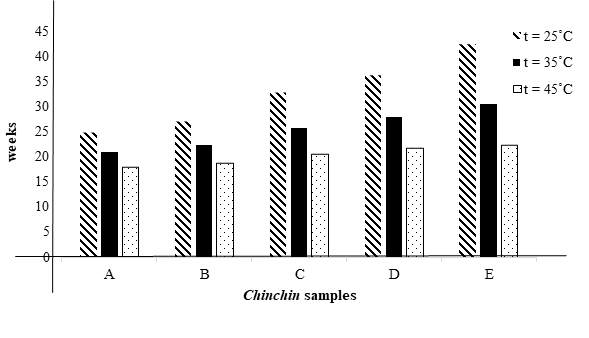
Figure 4: Predicted shelf life of chinchin samples at different storage temperature A-100% wheat Chinchin B-Chinchin enriched with 1% vegetable polyphenol. C-Chinchin enriched with 2% vegetable polyphenol D-Chinchin enriched with 3% vegetable polyphenol E-Chinchin enriched with 5% vegetable polyphenol These results indicate that Amarathus viridis are great sources of antioxidant phenolic compounds and can be used after extraction as additives to foods containing lipids
Conclusion
The protein, fat and ash content, mineral content and shelf life of the enriched products improved with level of enrichment. The results were comparable to those obtained when dried veg powder were used. These results indicate that Amarathus viridis are great sources of bioactive compounds (antioxidant phenolic) and can be used after extraction as additives to foods containing lipids and lipids to reduce rancidity, slow the formation of toxic oxidation products, maintain their nutritional quality and increase their shelf life
References
-
Senthil A, Ravi R, Bhat KK, Seethalakshmi MK (2002) Studies on the quality of fried snacks based on blends of wheat flour and soya flour. In Food Quality and Preference 13(5): 267-273.
-
Akubor PI (2004) Protein contents, physical and sensory properties of Nigerian snack foods (cake, chinchin and puffpuff) prepared from cowpea-wheat flour blends. International Journal of Food Science and Technology 39(4): 419-424.
-
Mepba HD, Eboh L, Aron A, Ukpabi J (2009) Rheological, baking and sensory characteristics of fermented cassava and lipids to reduce rancidity to the barest minimum, slow the formation of toxic oxidation products, maintain their nutritional quality and increase their shelf life [40]. starch-wheat-cowpea blends. Nigerian Food Journal 27(1): 1-10.
-
Stojceska V, Ainsworth P, Plunkett A, Ibanoglu S (2008) The recycling of brewer’s processing by product into ready-to-eat snacks using extrusion technology. Journal of Cereal Science 47(3): 469-479.
-
Ajila CM, Aalami M, Leelavathi K, Prasada Rao UJS (2010) Mango peel powder: A potential source of antioxidant and dietary fiber in macaroni preparations. Innovative Food Science and Emerging Technologies 11(1): 219- 224.
-
Sun-Waterhouse D, Teoh A, Massarotto C, Wibisono R, Wadhwa S (2010) Comparative analysis of fruit-based functional snack bars. Food Chemistry 11(4): 1369- 1379.
-
Folorunso AA, Omoniyi SA, Habeeb AS (2016) Proximate composition and sensory acceptability of snacks produced from broken rice (_Oryza sativa_) flour. American Journal Food Nutrition 6(2): 39-43.
-
Chipurura B, Muchuweti M, Manditseraa F (2010) Effects of thermal treatment on the phenolic content and antioxidant activity of some vegetables. Asian Journal of Clinical Nutrition 2(3): 93-100.
-
Akindahunsi AA, Salawu SO (2005) Phytochemical screening and nutrient antinutrient composition of selected tropical green leafy vegetables. African Journal of Biotechnology 4(6): 497-501.
-
Akindele O, Gbadamosi O, Taiwo K, Oyedele DJ, Adebooye C (2017) Proximate, mineral, sensory evaluations and shelf stability of chinchin enriched with ugu and indian spinach vegetables. International Journal of Biochemistry Research and Review 18(4): 1-14.
-
Famuwagun AA, Taiwo KA, Gbadamosi SO, Oyedele DJ (2016) Optimization of Production of Bread Enriched with Leafy Vegetable Powder. Journal of Food Processing and Technology 7: 605.
-
Association of Official Analytical Chemists (AOAC) (2010) Official Methods of Analysis, 19th (Edn.), Washington DC.
-
Fashakin JB, Ilori MO, Olarewaju I (1991) Cost and Quality Optimization of a complementary diet from plant protein and corn flour using a computer aided linear programming model. Nigerian Food Journal 9: 123-126.
-
Phimolsiripol Y, Suppakul P (2016) Techniques in Shelf Life Evaluation of Food Products. Reference Module in Food Sciences. Elsevier, pp: 1-8.
-
Gitalasa F, Rostini I, Pratama RI (2018) Estimation of shelf life using accelerated shelf life test (ASLT) method Arrhenius model on sheet nile Tilapia Jerky. Global Science Journal 6: 62-69.
-
Bayili RG, Abdoul-Latif F, Kone OH, Diao M, Bassole IH, et al. (2011) Phenolic compounds and antioxidant activities in some fruits and vegetables from Burkina Faso. African Journal of Biotechnology 10(62): 13543-13547.
-
Fasogbon BM, Taiwo KA, Oyedele DJ (2017) Nutritional assessment and consumer acceptability of snacks (chinchin and cookies) enriched with underutilized indigenous vegetables. International Journal of Food and Nutritional Sciences 6(3): 97-107.
-
Emelike NJT, Ebere CO (2016) Effect of Drying Techniques of Moringa Leaf on the Quality of Chin-Chin Enriched with Moringa Leaf Powder. IOSR Journal of Environmental Science, Toxicology and Food Technology (IOSRJESTFT) 10(4): 65-70.
-
Kiin-Kabari DB, Giami SY (2015) Physico chemical properties and in-vitro protein digestibility of non- wheat cookies prepared from plantain flour and Bambara groundnut protein concentrate. Journal of Food Research 4(2): 78-86.
-
Agbede JO, Adeyeye SA, Adegbenro M (2012) Nutritional, functional property and bioactive components of the leaf products from edible vegetables. RevistaCientífica UDO Agricola 12(3): 741-748.
-
Sharoba AM, Farrag MA, Abd El-Salam AM (2013) Utilization of some fruits and vegetables waste as a source of dietary fiber and its effect on the cake making and its quality attributes. Journal of Agroalimentary Processes and Technologies 19(4): 429-444.
-
Borja JCS, Sedano DS, Noel MG (2013) Functional properties of flours prepared from glucosinolate-rich vegetables: alugbati (Basella rubra). Research Congress, pp: 7-9.
-
Garayo J, Moreira R (2002) Vacuum frying of potato chips. Journal of Food Engineering 55(2): 181-191.
-
Fasasi OS (2009) Proximate, Anti-nutritional factors and functional properties of processed pearl millet (_Pennisetum glaucum_). Journal of Food Technology 7(3): 92-97.
-
Adegunwa MO, Ganiyu AA, Bakare HA, Adebowale AA (2014) Quality evaluation of composite millet-wheat Chinchin. Agriculture and Biology Journal of North America 5(1): 33-39.
-
Sanni LO, Adebowale AA, Tafa SO (2006) Proximate, functional, pasting and sensory qualities of instant yam flour. In A Paper Presented at the 14 ISTRC Symposium, Central Tuber Crops the Research Institute, Trivandrum, Kerala State, India.
-
Gupta S, Prakash J (2011) Nutritional and sensory quality of micronutrient-rich traditional products incorporated with green leafy vegetables. International Food Research Journal 18(2): 267-675.
-
Oluyemi EA, Akilua AA, Adenuya AA (2006) Mineral contents of some commonly consumed Nigerian foods. Science Focus 11(1): 153-157.
-
Oyarekua MA (2013) Studies on the nutritional quality, antinutritional factors, amino acid profile and functional properties of co-fermented wheat/cowpea. Elixir Food Science 54(1): 12360-12364.
-
Ojinnaka MC, Emeh TC, Okorie SU (2016) Evaluation of the quality of composite maize-wheat chinchin enriched with Rhynchophorousphoenicis. Journal of Food Research 5(4): 26-35.
-
Mohdaly AAA, Sarhan MA, Mahmoud A, Ramadan MF, Smetanska I (2010) Antioxidant efficacy of potato peels and sugar beet pulp extracts in vegetable oils protection. Food Chemistry 123(4): 1019-1026.
-
Olaofe O, Sanni CO (1988) Mineral contents of grain and baby foods. Journal of the Science of Food and Agriculture 45(1): 191-194.
-
Ewulo TO, Oluwalana IB, Ewulo BS, Awolu OO (2017) Enrichment of traditional maize snack (Kokoro) with moringa (Moringa oliefera) leaf and soybean. African Journal of Food Science 11(5): 140-145.
-
Ajibola CF, Oyerinde VO, Adeniyan OS (2015) Physicochemical and antioxidant properties of whole- wheat biscuits incorporated with Moringaoleifera leaves and cocoa powder. Journal of Scientific Research and Reports 7(3): 195-206.
-
Scherer R, Godoy HT (2009) Antioxidant activity index (AAI) by the 2, 2-diphenyl-1-picrylhydrazyl method. Food Chemistry 112(3): 654-658.
-
Ajibola CF, Fashakin JB, Fagbemi TN, Aluko RE (2011) Effect of peptide size on antioxidant properties of African yam bean seed (Sphenostylisstenocarpa) protein hydrolysate fractions. International Journal of Molecular Sciences 12(10): 6685-6702.
-
Pitchaporn W, Chomnawang C, Siriamornpun S (2009) Substitution of wheat flour with rice flour and rice bran in flake products: effects on chemical, physical and antioxidant properties. World Applied Sciences Journal 7(1): 49-56.
-
Prior RL, Cao G (2000) Antioxidant phytochemicals in fruits and vegetables: diet and health implications. Horticulture Science 35(4): 588-592.
-
Roginsky V, Barsukova T, Hsu CF, Kilmartin PA (2003) Chain-breaking antioxidant activity and cyclic voltammetry characterization of polyphenols in a range of green, oolong, and black teas. Journal of Agricultural and Food Chemistry 51(19): 5798-5802.
-
Jadhav V, Biradar SD (2016) Evaluation of antioxidant activity of _Amaranthus viridis_ L. methanolic extract. International Journal of Pharmacy and Biological Sciences 6(3): 150-153.
-
Adefegha SA, Oboh G (2013) Phytochemistry and mode of action of some tropical spices in the management of type-2 diabetes and hypertension. African Journal of Pharmacy and Pharmacology 7(7): 332-346.
-
Gupta S, Prakash J (2009) Studies on Indian green leafy vegetables for their antioxidant activity. Plant Foods for Human Nutrition 64(1): 39-45.
-
Hall C (2001) Sources of natural antioxidants: oilseeds, nuts, cereals, legumes, animal products and microbial sources. In: Pokorny J, Yanishlieva N, Gordon M (Eds.), Antioxidants in food practical applications. CRC Press, Cambridge, pp: 156-160.
-
Jonnalagadda PR, Bhat RV, Sudershan RV, Naidu AN (2001) Suitability of chemical parameters in setting quality standards for deep-fried snacks. Food Quality and Preference 12(4): 223-228.
-
Chaiyashit W, Elias RJ, Mcclements DJ, Decker EA (2007) Role of physical structures in bulk oils on lipids oxidation. Critical Reviews in Food Science and Nutrition 47(1): 299-317.
-
Yadav DN, Balasubramanian S, Kaur J, Anand T, Singh AK (2014) Non-wheat pasta based on pearl millet flour containing barley and whey protein concentrate. Journal of Food Science and Technology 51(10): 2592-2599.
-
Gautam L, Gupta A (2017) Study on Storage Stability of Different Homemade Extruded Foods Products Prepared by Using Malted Composite Flour. Natural Product Chemistry Research 5(264): 2-9.
-
Berger KG (1994) Practical measures to minimize rancidity in processing and storage. In: JC Allen, RJ Hamilton, Rancidity in Foods. 3rd (Edn.), Chapman and Hall. London UK, pp: 68-83.
-
Martins RC, Lopes IC, Silva CLM (2005) Accelerated life testing of frozen green beans _(Phaseolus vulgaris, L.)_ quality loss kinetics: colour and starch. Journal of Food Engineering 67(3): 339-346.
-
Wahyuni S (2018) Estimation of shelf life of wikaumaombo brownies cake using Accelerated Shelf Life Testing (ASLT) method with Arrhenius model. In IOP Conference Series: Earth and Environmental Science, IOP Publishing 122(1): 012082.
-
Cavalieri RP, Reyes De Corcuera JI (2003) Kinetics of Chemical Reactions in Foods. Food Engineering 1: 431- 530.
-
Thejani MG, Nadeesha MG, Navaratne SB (2015) Selection of best packaging method to extend the shelf life of rice crackers. International Journal of Scientific and Engineering Research 6(2): 638-645.
-
Gülçın İ, Oktay M, Kıreçcı E, Küfrevıoǧlu Öİ (2003) Screening of antioxidant and antimicrobial activities of anise (Pimpinellaanisum L.) seed extracts. Food chemistry 83(3): 371-382.
- The Role of Podocyte Apoptosis and the Involvement of SIRT1 in Diabetic Nephropathy
- Dealcoholization of Beer by Osmotic Distillation for the Beverage Industry
- Biopolymer-Based Edible Packaging- Biomaterials, Methods, and Applications in Food Industry: An Updated Review
- Influence of Bioprocessing Methods on 'China Rice' (Gawal R1), and Soyabean Supplementation on the Quality of Complementary Food
- Cassava (Manihot esculenta) Varietal Growth, Yield and Cyanide Content Performance in Three Sites in the South- Eastern Semi Arid Regions of Kenya
- Food Waste Treatment, Recycling, Management and Production of Value-Products-An Update on Methodologies and Current Trends