Physicochemical Properties of Commercial Mish as Affected by Storage Time after Production at Khartoum, Sudan
This study aimed to evaluate and compare the effect of storage period on the chemical composition of mish produced commercially by three different companies of dairy products; C1, C2 and C3. Thirty samples of mish at day 2 and day 20 after their production were randomly collected from groceries and were subjected to the analysis of their fat, protein, total solids, ash, acidity, and pH contents. The result showed highly significant (P<0.001) variations on the composition of mish samples produced by the different companies. The overall means of protein, fat, total solids, ash, acidity and pH revealed 8.08±0.138.08, 5.05±0.195.05, 20.91±0.27, 1.917±0.09, 2.015±0.08% and 3.82±0.14, respectively. The protein and fat content revealed highly significant (P<0.001) reduction for mish samples examined at day 20 (7.61 and 4.57%, respectively) compared to those examined at day 2 (8.55 and 5.53%, respectively). However, the total solids value increased during the storage period significantly (P<0.01), while, the ash content showed non-significant (P>0.05) differences values during the storage. The acidity of the mish samples showed highly significant (P<0.001) increase, while the pH content showed highly significant (P<0.001) decrease from day 2 to day 20. It can be concluded that the composition of mish from different companies varied with the storage time. It might be due to the raw material and method used in preparation of mish. Hence standards should be set and monitoring has to be implemented in order to have a uniform and safe product.
Introduction
Fermented milk plays a crucial role in the nutrition of vulnerable groups of population such as infants, pregnant women, young children, and the elderly [1]. Many fermented dairy products have been traditionally produced worldwide from milk of different mammal species for the manufacture of fermented milk products. Moreover, a lot of them are still produced either following the same traditional process or manufactured industrially, using standardized processes under controlled conditions with specified starter cultures [2].
Mish is a Sudanese sour milk product, which is introduced from Egypt and it was obtained by acidifying the raw milk with selective lactic acid bacteria and addition of certain flavoring spices, left to ripen, packed or consumed [3, 4, 5]. The traditional methods of mish processing were described previously [3, 4, 5]. Mish is a concentrated traditional dairy fermented product that is currently manufactured by modern dairy industry in Sudan. It is a sour popular product [6].
Currently mish is produced in Sudan by different dairy companies and stored in groceries for a period of 21 days [7]. The modern industrial method of mish processing was also outlined [8]. The mix is usually prepared using high solids nonfat of about 22-23% w/w from skim milk powder plus whole milk powder and fresh milk and the inoculation of starter culture to mish is at a rate of 1-2% w/v [8]. Mish has long shelf-life and could be kept up to 21 days; moreover the added spices might have a good role in extending this period [9]. Moreover, it was recommended that the processing of mish using spices like black cumin, fenugreek, garlic and other known spices, since those spices were proved to have significant effect as preservative [5].
The chemical analysis of mish samples in 2005 revealed 11.83±2.96 for total solids, 5.09±2.9% for protein, 2.83±0.93% for fat, 2.34±0.98% for lactose and 1.24±0.41% for lactic acid [5]. The mish samples produced by the modern procedure in 2013 showed fat of 6.98±0.15%‚ pH of 3.949±0.183‚ protein of 10.26±0.342%‚ ash of 1.43±0.16% and acidity of 2.334±0.014% [8]. Moreover, the newly spicy mish; in which fenugreek and black cumin are replaced by green fennel and black pepper; showed slightly lower content of chemical composition compared to the common mish, which was produced by adding fenugreek and black cumin. Moreover, highly significant differences (P<0.001) were obtained for the levels of fat and acidity in the 2 different types of mish samples [10].
The commercial and laboratory made mish samples revealed 33.38–37.21, 25.3–29.9, 6.2–7.13, 7.0–8.03, 1.41– 1.99, 1.5–2.0% and 4.4–4.49 for total solids, solids non-fat, fat, protein, ash, acidity and pH, respectively [11].
The fat, protein and ash content of mish from 2 different companies were more or less similar during the storage period. However, the viscosity and acidity were increased and the pH was decreased [8]. The heat treatment of milk and the use of spices like black cumin and garlic improve the keeping quality of mish [9]. This study was designed to evaluate and compare the chemical composition of commercial mush produced by three different companies during the storage period.
Materials and Methods
Mish Samples Collection
Mish samples produced by three different dairy factories were collected randomly during August to October 2016 from groceries in Khartoum. The samples were collected during the beginning of manufacturing period (day 2) and the end of storage period (day 20). The samples were transported to the laboratory of Department of Dairy Production, Faculty of Animal Production, University of Khartoum and analyzed for physicochemical analysis that include protein, fat, total solids, ash, acidity and pH.
Physicochemical analysis of Mish Samples
Kjeldahl method was used for the determination of protein content [12]. The Gerber method was used to measure fat level in mish samples [13]. Similarly, the total solids content of mish samples was determined by using the forced draft oven method and the ash content was obtained by gravimetric method [13]. Also, the titratable acidity of mish samples was estimated using titration method [13]. The pH of mish samples was determined by using electronic pH meter.
Statistical Analysis
The data were statistically analyzed using Statistical Analysis System (SAS ver, 9.1.3). General liner model was used for statistical analysis and means were separated by Duncan Multiple Range Test at P<0.05. The figures were plotted using Microsoft excel program.
Results
The Effect of Storage Period on Chemical Compositions of Mish Samples
The data presented in Table 1 showed the effect of storage period (day 2 and day 20) on chemical composition that included protein, fat, total solids and ash of mish samples collected from three different companies; C1, C2, and C3.
| Parameters | Day 2 | Day 20 | LS |
|---|---|---|---|
| Protein (%) | 8.55a±0.14 | 7.61b±0.14 | *** |
| Fat (%) | 5.53a±0.15 | 4.57b±0.19 | *** |
| Total solids (%) | 21.43a±0.50 | 20.39b±0.47 | ** |
| Ash (%) | 2.02a±0.08 | 1.81a±0.15 | N S |
Table 1: The effect of storage period on chemical composition of mish samples collected from three companies. Means in the same r
The results indicated highly significant (P<0.001) variation in protein of mish samples (Table 1) that showed decreasing value from day 2 (8.55%) to day 20 of storage period (7.61%). Fat content of mish samples recorded in Table 1 showed decreasing value from day 2 (5.53%) to day 20 (4.57%) of storage period. The results showed that there were significant (P<0.01) differences of total solids of mish samples between the storage periods, it was 21.43 in day 2 comparing with 20.39% in days 20 (Table 1). Table 1 also illustrated that ash content of mish samples showed non- significant (P<0.05) variation between the two periods of storage (2.024% for day 2 and 1.810% for day 20).
The Effect of Storage Period on Acidity Content of Mish Samples
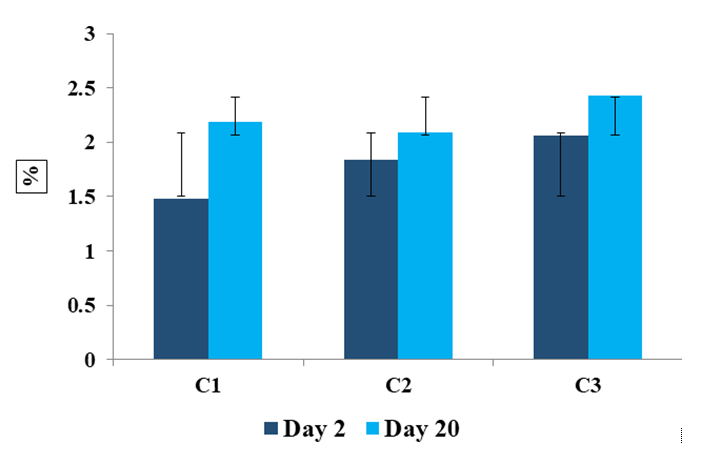
Acidity content of mish samples showed highly significant (P<0.001) variations, it increases from day 2 of storage period (1.794%) to 2.237% in day 20 (Figure 1).
The Effect of Storage Period on pH Content of Mish Samples
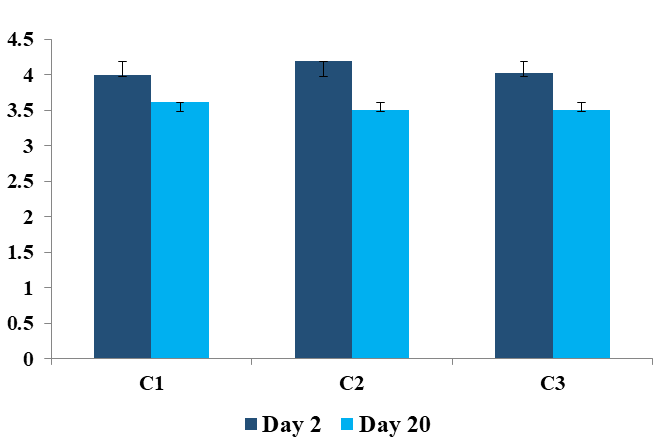
The mean value of pH of mish samples revealed highly significant (P˂0.001) decrease from day 2 (4.08) to 3.57 for day 20 (Figure 2).
Variations of Physicochemical Content of Mish Samples Produced By Different Companies
Table 2 showed the variations on chemical composition for mish samples collected from three companies during storage that included protein, fat, total solids and ash.
Protein content of the mish samples showed highly significant (P<0.001) variation between companies (C1, C2 and C3), which recorded 8.31% and 8.76%, respectively for C1 and C3, while the lower content (7.18%) was found for the mish samples produced by C2 (Table 2).
| Company | C1 | C2 | C3 | Overall mean | L S |
|---|---|---|---|---|---|
| Protein (%) | 8.31a±0.16 | 7.18b±0.13 | 8.76a±0.11 | 8.08±0.13 | *** |
| Fat (%) | 4.63b±0.15 | 4.86a±0.32 | 5.650b±0.10 | 5.05±0.19 | *** |
| Total solids (%) | 20.70b±0.18 | 18.16c±0.43 | 23.87a±0.21 | 20.91±0.27 | *** |
| Ash (%) | 2.060a±0.04 | 1.350b±0.04 | 2.340a±0.20 | 1.917±0.09 | *** |
Table 2: Variation of chemical composition of mish samples collected from three companies. Means in the same row bearing the same
Fat content of mish samples revealed highly significant (P<0.001) variation between companies. The higher content was recorded in samples collected from C3 (5.650%), while C1 and C2 recorded means of 4.63 and 4.86%, respectively (Table 2).
The data presented in Table 2 showed highly significant (P<0.001) variation in total solids content of mish samples, The samples produced by C3 recorded highly percentage (23.87), while those from C2 and C1 showed 18.16 and 20.70%, respectively.
The mean values of ash content of mish samples showed highly significant (P<0.001) variations (Table 2), which recorded 2.060% and 2.340% for mish samples obtained from C1 and C3, respectively. However, the mish samples obtained from C2 revealed the lowest ash content (1.350%) comparing with other companies.
The acidity of mish samples recorded highly significant (P<0.001) variations between the different producing companies. It was noticed that high degree of acidity (2.245%) was found for samples collected from C3, while those obtained from C1 and C2 recorded 1.835 and 1.965%, respectively (Figure 1).
Data presented in Figure 2 showed that the pH of mish samples had no significant (P>0.05) variation between different producers. It revealed 3.81, 3.86 and 3.80 for the samples obtained from C1, C2 and C, respectively.
Discussion
The protein content (Table 1) showed highly significant (P<0.001) differences for the mean values for mish samples at the beginning of storage period (day 2) and those approaching the end of storage period (day 20). The results obtained were higher than those reported in a previous study [5] that found the protein of mish was 5.09%±2.80 and lower than those recorded for the protein content in mish produced by modern producers (10.260±0.342%) and traditional (7.9±0.372%) ones [8]. However, the present finding supported the result obtained before [14]. In a recent study, also, the mean protein value was 6.42±0.045% for the common mish, which were made by adding fenugreek and black cumin. The mean value was 5.6±0.16% for the newly spicy mish, which were made by replacing fenugreek and black cumin by green fennel and black pepper [10].
The higher protein value of common mish might be due to the addition of fenugreek used for common mish [10]. The protein content of fenugreek was ranged between 20 and 30% [15].
The reducing value obtained for the protein content supported the report, which indicated that the increase in parameters of proteolysis leading to protein degradation during cheese ripening is closely related to the increase in bacterial activity and enzyme activity over time [16]. The decrease in protein content noticed during storage period might be possibly due to the activity of proteolytic microorganisms leading to protein degradation [17]. Protein content showed highly significant variation (P<0.001) in mish samples collected from the different producing companies C1, C2 and C3. The samples obtained from C1 and C3 revealed higher protein content than results recorded for those collected from C2 (Table 2). However, the results were found in line with that recorded previously [14]. The high protein content obtained for the mish samples from company using modern processing method might be due to the high total solids content of the mix used during the manufacturing of the product [9].
Data presented in Table 1 showed highly significant (P<0.001) variation in fat content for mish samples that decreased from day 2 to day 20 of storage period. The obtained values were higher compared with those reported previously [5]. The shelf life of ‘mish’ samples collected from three different dairy plants, showed good quality from microbiological point of view for up to 21 days [3]. In other dairy products, the fat content of the cheese was found not affected significantly by the addition of black cumin, which belong to aromatic plants [17]. Moreover, 5.18±0.13 and 6.08%±0.13 were reported for mish samples collected on day 2 and day 20 of storage period [14]. The values found in the present study were higher than the value (2.83±0.93%) found for fat content in mish, which was processed previously [5]. Similarly, mean of fat content of the common and newly spicy mish revealed lower (3.48±0.04% and 2.75±0.11%, respectively) values that could be attributed to the higher fat content of common mish compared to the newly spicy mish, which is due to black cumin seeds [10]. It worth mentioning here that the common mish revealed high production and sale ratio in comparison to the newly spicy mish [6]. The black cumin (Nigella sativa L.) contains several bioactive molecules and functional ingredients that are associated with its fixed and essential oil contents [18]. Evidence for supporting the utilization of Nigella sativa and its bioactive components in a daily diet for health improvement is available [19]. The black cumin seeds are rich in unsaturated fatty acids especially polyunsaturated fatty acids followed by monounsaturated and saturated fatty acids, in addition the presence of phytosterols (0.33 to 0.36%) strengthens black cumin hypoglycemic and hypoholesterolemic perspectives [20]. Also, garlic (Allium sativum) was used in various dairy products due to its taste, natural preservative additives; antimicrobial and antioxidant activity [21].
The obtained values supported those reported in a previous report that found the means fat content in mish produced by the modern (6.98±0.151%) and the traditional (5.89±0.285%) methods [8]. Furthermore, the fat content obtained in this study (Table 2) showed highly significant (P<0.001) variations between mish produced by different companies; C1, C2, C3. The variation might be due to the composition of the product between the different producing company. Generally, the low-fat content found in the final product may be related to the use of the solids non-fat from skim milk powder in mish mix plus whole milk powder and fresh milk. As in the dairy plant manufactured modernised and standardised mish, they use (22–23% w/w) solids non-fat and various higher or lower levels are used by the traditional procedure in other dairy plant [8].
Total solids content of mish samples obtained were decreasing from day 2 to day 20 of storage period with significant (P<0.01) differences (Table 1). The results were lower than those reported previously [14]. Similarly, significant differences (P<0.05).in total solids content of mish samples during the storage period was reported [10]. The decrease in total solids content was due to the degradation of protein and lipolytic activity on the fat content [17]. However, the fermentation ability of lactic acid bacteria enriches nutrients content, improves the organoleptic attributes and enhances food safety, thus increasing its health benefits [22]. Also, highly significant (P<0.001) differences were found for the total solids content during the storage periods for both common and new;y spicy mish [10]. On the other hand, the means of the total solids content revealed 24.97±0.15% and 23.02±0.36% for common mish and the newly spicy mish content, respectively [10].
The total solids content of mish samples (Table 2) recorded significant (P<0.001) variations between the different producing companies (C1, C2 and C3). Mish differs from yoghurt in having higher total solids content [8]. The high total solids noticed in the product may be because of the different manufacturing conditions that adopted to satisfy wither the consumers in obtaining a unique product. Zendeboodi stated that the fermented milk products should be considered as alternatives in formulation of the diets for lactose-intolerant people [23].
Table 1 showed no significant differences between the two storage periods in the ash content of mish analyzed in the present study. The high ash in mish might be due to addition of spices [5, 11]. The mean of ash content was 2.60±0.043% for common mish and 2.78±0.078% for newly spicy mish [10]. Another study, concluded that awareness among the consumers about the medicinal values of the spices used in mish should be promoted for their use in different dairy products [6]. Further, the use of spices in dairy products for their preservation and functional properties should be encouraged [10].
The result of the mish samples collected at the beginning of storage period was higher in ash content. Lower values for ash content in mish samples were also reported; 1.26±0.61 and 1.43±0.18% [5, 8], respectively. However, the mish samples collected at the end of storage period were in line to those reported previously [5]. Values of 2.03±0.096 and 1.47±0.096% for ash content of mish samples at the beginning (day 1) and the end of storage periods (day 21) were also found [14]. However, the ash content of mish samples collected from the different companies (Table 2) showed significant (P<0.001) variation. There were some variations in ash content; might be due to the variations in chemical composition of the milk and the variation of processing methods [8].
The average acidity of mish samples; as lactic acid percent; were increasing form the beginning (day 2) towards the end of storage period (day 20), with highly significant (P<0.001) differences (Figure 1). Similarly, highly significant differences (P<0.001) were found for the titratable acidity of the common mish (2.72±0.073%) and the newly spicy mish (2.3±0.05%) [10]. However, the obtained values in the present study were higher than that reported for the titratable acidity values for roub (1.25±0.35%) and mish (1.243±0.41%) samples made in Butana dairy factory [5]. The higher dry matter and protein content lead to higher titratable acidity [24]. This true since significantly (P<0.05) higher acidity was reported for Mudaffara cheese flavored with sesame compared to that flavored with black cumin [25]. Similarly, the lowest value was found in Mudaffara cheese samples flavored with black cumin (0.6±0.12%). Generally, the cheese samples flavored with black cumin showed lower acidity content during the storage in comparison to the cheese samples flavored with 0.03 and 0.5% Syrian thyme. Furthermore, the significant (P<0.001) variations in flavor scores for Mudaffara cheese during the storage is indictive for the increase levels of acid taste [26]. This because the aromatic and medical plants that have some functional properties including antioxidant, anti-inflammatory, antiallergic, anti- depressive and antimicrobial effects, which supported their use as spices, food supplementary and additives [21]. The variations might be because mish is differed from yoghurt in having higher degree of acidity, in addition to its content of the added spices, including black cumin, fenugreek and garlic [8]. However, the obtained values were lower compared to those which revealed an average of 2.33% (2.28-2.35%) for titratable acidity of the mish produced by modern method and traditional method that showed mean of 2.35±0.018% and range of 2.31% and 2.37 % [8].
The result of acidity of mish samples collected at the beginning of the storage period was lower than those (2.70±0.046 and 3.39±0.046%) reported previously during day 2 and day 20 [14]. However, the mish samples collected at the end of storage period supported those (2.33%±0.01) obtained previously [8]. The increase in acidity towards the end of storage period might be due to the fermentation process of traditional fermented milk that depends on the end products of lactic acid bacteria that formed during the fermentation of lactose [27]. However, the mish produced by modernized methods; as was judged by its acidity content could be kept for up to 30 days [8]. This reason could be because the added spices may play a positive role in extending the shelf life of this product [9].
Data presented in Figure 1, showed highly significant (P<0.001) variations for the mean of acidity for mish produced by C1, C2 and C3. The average mean recorded was 2.015±0.07%. Similarly different values were reported for the titratable acidity (3.96±0.035, 2.48±0.035 and 3.23±0.035%) for mish samples form three different manufacturing dairy plants [14]. However lower values were obtained for acidity in the commercial goat’s milk and cow’s milk mish samples that revealed 1.5-2.0, 1.58 and 1.54%, respectively [11]. The high acidity content in the product might be because generally the fermented foods are made under controlled, desired microbial growth and enzymatic conversions of their major and minor components [2, 28, 29]. Moreover, the use of pasteurized milk, more hygienic practices, and the use of defined starter cultures; this had the direct impact on reducing the risks of food safety concerns [2].
The result that was recorded in Figure 2 showed that the mean values of the pH of mish obtained at the beginning (day 2) and at the end of storage period (day 20) revealed highly significant (P<0.001) differences between the two storage periods. Also, in a previous study, the pH values of mish samples revealed 4.03±0.10 and 3.83±0.14 at the beginning and the end of storage period [8]. A decrease in pH causes the increase in titratable acidity during storage, because lactic acid bacteria ferment lactose to produce lactic acid [24]. The reason could be also because of the antimicrobial and preservative effects of the black cumin [5, 8]. The increase in acidity due to the fermentation process resulted in higher acid concentration that reduced the pH values of mish samples [11]. However, the mean values of pH of mish samples produced by different companies doesn’t show significant (P<0.05) variations (Figure 2). Moreover, highly significant (P<0.001) differences were obtained between the three manufacturing companies in the chemical content of mish. Similarly, the pH of commercial samples ranged between 4.45 and 4.48, while the laboratory made mish samples revealed 4.49 in goat’s milk mish and 4.40 in cow’s milk mish [11]. This could be due to the differences in manufacturing procedure and the raw materials used [8]. Thus, mish must be prepared under good quality control measures that include raw materials, production conditions and storage of the product in order to ensure that it reaches the consumer in an acceptable quality [7]. Moreover, the dairy plants need to improve the production conditions in terms of processing, packaging, storage, handling and distribution in order to produce a safe and sound product for consumption [3].
Conclusion
The results of this study concluded that mish samples examined during the present study showed significant variations in the chemical composition between the 3 different dairy plants at the beginning and towards the end of the storage period. Also, the acidity of mish samples was found to increase toward the expiry date. Hence monitoring of the product should be considered for protecting consumers heath.
Author Contribution
Mazza Barakat: Conceptualization, visualization, data analysis and writing original draft; Ibtisam El Zubeir: Conceptualization, visualization, supervision during preparation and writing original draft and editing of the final manuscript.
Conflict of Interest
The authors declare that no competing interests or personal relationships that could have appeared to influence the work reported in this manuscript.
References
-
Chilton SN, Burton JP, Reid G (2015) Inclusion of fermented foods in food guides around the world. Nutrients 7(1): 390-404.
-
Bintsis T, Papademas P (2022) The evolution of fermented milk’s, from artisanal to industrial products: A critical review. Fermentation 8(12): 679.
-
Abdalla MOM, Abdel Nabi SZA (2010) Evaluation of microbiological quality of Sudanese fermented dairy product mish’ during storage. Adv J Food Sci Technol 2(3): 155-158.
-
Salih AMM, Sanousi SME, El Zubeir IEM (2011) A Review on the Sudanese traditional dairy products and technology. International Journal of Dairy Science 6 (4): 227-245.
-
El Zubeir IEM, Abdalla WM, El Owni OAO (2005) Chemical composition of fermented milk (Rob & Mish) in Sudan. Food Control 16(7): 633-637.
-
Elawad RAK, El Zubeir IEM (2020) Comparative analysis on acceptability and sale share for common and newly spicy mish produced from a commercial dairy plant in Khartoum, Sudan. Food Nutr Dit Open Access Open Journal 1(1): 8-12.
-
Barakat MAE, El Zubeir IEM (2020) Microbial load of mish during storage period at retailers’ shops in Khartoum State, Sudan. University of Khartoum Journal of Veterinary Medicine and Animal Production 11.
-
Abdel-Gadir MKH, El-bakri JM, El Zubeir IEM (2013) The physicochemical and microbiological quality of the Sudanese yoghurt Mish produced by traditional and modernized methods. International Journal of Dairy Technology 66 (2): 273-278.
-
Abdalla WM, El Zubeir IEM (2006) Microbial hazard associated with fermented milk (roub and mish) processing in Sudan. Int J Dairy Sci I (1): 21-26.
-
Elawad RAK, El Zubeir IEM (2021) The compositional and microbial quality of common and new spicy mish produced from a commercial dairy plant in Khartoum, Sudan. Acta Transitional Medicine 4 (1): 21-28.
-
Sulieman AME, Abd Elgadir HA, Elkhalifa E (2011) Chemical and microbiological characteristics of fermented milk product, mish. Int J Food Sci Nutrit Engin 1(1): 1-4.
-
Bradley RL, Arnold E, Barbano DM, Semerad RG, Smith DE, et al. (1992) Chemical and physical methods. In: Marshall RT (Ed.), Standard Methods for the Examination of Dairy products. 16th( Edn.), Port City Press, Baltimore, Washington.
-
AOAC (2003) Official Methods of Analysis of AOAC International. 17th(Edn.), AOAC International, Gaithersburg, MD, USA. Assessment Bull. World Health Organization 74: 553-558.
-
Abdalla MOM, Abdel Nabi SZA (2010) Chemical ccomposition of mish “a traditional fermented dairy product” from different plants during storage. Pakistan Journal of Nutrition 9 (3): 209-212.
-
Mehrafarin A, Qaderi A, Rezazadeh SH, Naghdi BH, Noormohammadi GH, et al. (2010) Bioengineering of important secondary metabolites and metabolic pathways in Fenugreek (Trigonella foenumgraecum L). Journal of Medicinal Plants 9(35): 1-18.
-
Tarakcı Z, Deveci F (2019) The effects of different spices on chemical, biochemical, textural and sensory properties of white cheeses during ripening. Mljekarstvo 69(1): 64-77.
-
El gabali TMMA, Jadain OAM, El Zubeir IEM (2023) Effect of addition of Syrian thyme (Thymus syriacus) on Physicochemical and sensory quality of Sudanese Mudaffara cheese during storage. Journal of Food Science and Technology 60(2): 517-527.
-
Sultan MT, Butt MS, Anjum FM, Jamil A, Akhtar S, et al. (2009) Nutritional profile of indigenous cultivar of black cumin seeds and antioxidant potential of its fixed and essential oil. Pak. Journal Bot 41(3): 32-40.
-
Butt MS, Sultan MT (2010) Nigella sative: Reduces the risk of various maldies. Crit Rev Food Sci Nutrition 50(7): 654-665.
-
Cheikh-Rouhoua S, Besbesa S, Lognayb G, Bleckerc C, Deroannec C, et al. (2008) Sterol composition of black cumin (Nigella sativa L) and Aleppo pine (Pinus halepensis Mill) seed oils. Journal Food Comp Anal 21(2): 162-168.
-
Kaptan B, Sivri GT (2018) Utilization of medicinal and aromatic aromatic plants in dairy products. J Adv Plant Sci 1: 207.
-
Gemechu T (2015) Review on lactic acid bacteria function in milk fermentation and preservation. African Journal of Food Science 9(4): 170-175.
-
Zendeboodi F, Khorshidian N, Mortazavian A, Cruz A (2020) Probiotic: Conceptualization from a new approach. Current Opinion in Food Science 32: 103-123
-
Costa MP, Beltrao EM, Sousa SD, Cruz AG, Queiroga RCRE (2016) Physicochemical and sensory characteristics of yoghurts made from cow and goat milk. Animal Science Journal 87(5): 703-709.
-
Farah NAM, El Zubeir IEM (2020) Effect of addition of sesam seeds on Physicochemical quality of Mudaffara cheese during storage. Biotech Res Biochem 3: 008.
-
Farah NAM, El Zubeir IEM (2019) Comparison on the acceptability of mudaffara cheese using black cumin and sesame seeds during storage. Annals of Food Science and Technology 20 (4): 721-727.
-
Rattanachaikunsopon P, Phumkhachorn P (2010) Lactic acid bacteria: Their antimicrobial compounds and their uses in food production. Annals of Biological Research 1 (4): 218-228.
-
Macori G, Cotter PD (2018) Novel insights into the microbiology of fermented dairy foods. Current Opinions in Biotechnology 49: 172-178.
-
Gaggia F, Gioia DD, Baffoni L, Biavati B )2011( The role of protective and probiotic cultures in food and feed and their impact on food safety. Trends in Food Science and Technology 22: S58-S66.
- The Role of Podocyte Apoptosis and the Involvement of SIRT1 in Diabetic Nephropathy
- Dealcoholization of Beer by Osmotic Distillation for the Beverage Industry
- Biopolymer-Based Edible Packaging- Biomaterials, Methods, and Applications in Food Industry: An Updated Review
- Influence of Bioprocessing Methods on 'China Rice' (Gawal R1), and Soyabean Supplementation on the Quality of Complementary Food
- Cassava (Manihot esculenta) Varietal Growth, Yield and Cyanide Content Performance in Three Sites in the South- Eastern Semi Arid Regions of Kenya
- Food Waste Treatment, Recycling, Management and Production of Value-Products-An Update on Methodologies and Current Trends