Effect of Different Wavelengths of Light on the Rate of Photosynthesis
Photosynthesis in plant species is basically defined as a biochemical process of formation of organic compounds from carbon dioxide and hydrogen-donors such as water by converting light energy into chemical bond energy via chlorophyll. This is mainly a light-dependent process which takes place in the mesophyll cells of the leaves in green plants.
Introduction
According to Maxwell as stated in 1860, light is the visible part of the electromagnetic spectrum consisting of a stream of very tiny particles or energy packets known as photons traveling in the form of waves.
From a biochemist’s point of view, it is well known that almost 8 quanta of light is required for the reduction of 1 mol of carbon dioxide to produce 1 molecule of oxygen.
Light is one of the most vital resources facilitating plant photosynthesis and growth. A wide range of signals and information are aggravated by light energy, this range is used mainly for morphogenesis and other such processes, etc.
There are various characteristics of light such as spectral composition (wavelengths), optical intensity, duration of photoperiod, direction, etc., which essentially influence plant growth and development. In the absence of light energy, plant species undergo etiolation. In this ailment, the dark brown seedling possesses morphological defects such as pale colour of seed coat and leaves, narrow stems with small narrow roots fewer in number, little mechanical tissues, etc. As a remedy, light flashes are sufficient enough to make that seedling get normal via tissue and organ differentiation in presence of light energy. This treatment is known as photomorphogenesis and it gets mediated via phytochromes.
In modern days, it is none other than the rapid development of lighting technologies using LED lights (Light Emitting Diodes), which has diverged the usage of this technology for lighting in closed horticultural systems. These diodes are also attractive because of their vigorous efficiency of high radiation, low temperature, small size, long lifetimes, narrow spectrum, physical robustness, etc. Hence it enables horticulturists to use various optical wavelengths to study plant responses.
For instance, nowadays intercropping lighting using LEDs is used to promote the process of photosynthesis in leaves.
But unfortunately, scientific studies along with researches on spectral wavelengths on plant growth and development are still on the track.
Plant responses towards light energy vary on the basis of the lighting environment around, seasonal environment surrounding the species, genotype, cultivation practices, etc [1, 2, 3, 4, 5]. Although light energy is the main energy source for photosynthesis, it can also immediately function as a stress factor. High light intensity causes the destruction of chlorophyll and this process is known as solarisation in plants. Under such conditions, if plants are exposed to abiotic stresses, energy supply (ATP) and reducing power (NADPH), as produced by the light reaction in photosynthetic species, increase the demand for the metabolic processes in carbon fixing reactions [6]. The main protective strategy is to dissipate excess energy for getting rid of the damage produced by high light (HL) intensities in the form of heat. This process is also known as NPQ (non-photochemical quenching). Photosynthesis is best tuned via red and blue wavelengths of light—maximum of it occurs in the red part of the spectrum.
In the context of this topic, it is equally important to learn about the simple experimental studies which led to our gradual development in the clear conception of photosynthesis.
It actually dates back to the late 320 B.C. At that time, two Greek philosophers – Aristotle and Theophrastus – were of the view that plant species directly absorb nutrition from the soil itself. This was a mere initiation of thinking about the process of photosynthesis and till date different workers discovered different phases, pathways, facts, etc., about this particular process [7]. Later in the 17th century A.D., Robert Boyle (1627–1691) was the first scientist to experiment with the increase in plant biomass in an effort to determine what happened to water taken up by plant species. Unfortunately, he could not come up with a result until in 1648, he was succeeded by his contemporary—Jan Baptist Van Helmont.
Helmont first rejected this ancient ideology that plant species consume maximum biomass from the soil. For proving the correct ideology, he performed an experiment which was later known as his Willow Tree Experiment in 1648. A willow tree plant of mass 2.27 kg was taken for experimentation. It was followed by weighing the soil required for growth by taking in the pot. The tree plant was placed in the soil and finally water was added to it for 5 years consecutively. At the end of 5 consecutive years, the tree had increased in size by 74.4 kg but the soil had lost only 57g of its weight. He finally concluded that plants must take most of their weight from water. In other words, it was water which provided as a supplement for its growth [8, 9].
In 1674, it was finally Malpighi who studied the anatomy of a plant species with the help of a microscope and postulated that – “Together with water, plant species also require air to breathe; provided stomata will also function in this process.” [10, 11].
Year 1727 A.D., Stephen Hales was the first who gave the ideology that “air and light are factors for plant growth.” Year 1772 came up with the chemist – Sir Joseph Priestley who ran a series of experiments via testing a mouse, a candle, and lastly a sprig of mint plant under a hermetically sealed jar. It was observed that a mouse and a candle behave in an extremely similar manner when covered, in that they both spend the air. But if they both were enclosed individually inside two different airtight bell jars, they finally lost their lives shortly. The gas released by these plants was called by him as “dephlogisticated air” – it was a term given to oxygen which was one of the byproducts of photosynthesis.
In 1779, Jan Ingen Housz performed a series of experiments and finally was the first to recognise the importance of light energy and chlorophyll in plant photosynthesis.
In 1782, Senebier was the first to state this fact that air being fixed, carbon dioxide was an essential part of the photosynthesis process.
Antoine Lavoisier (also known as the Father of Chemistry) in 1783, discovered that “revived air” is actually a separate gas known as oxygen.
In 1804, de Saussure stated that “Plants will not live without carbon dioxide or oxygen.” He even discovered that water takes part in photosynthesis.
In 1805, Julius Robert Mayer (German physician and physicist) stated that “sun is the ultimate energy source for both plants and animals and that when absorbed, plants convert this light energy into chemical energy”. Nowadays it is said that according to a biologist’s point of view, a green photosynthetic pigment in plants—chlorophyll a—is responsible for this function. He made his claim in his literary piece—“The Organic Motion in its Relation to Metabolism” in which he commented that—“The plants take in one form of power, light, and produce another power: chemical difference.” Here he termed energy as “Power” and chemical energy as “chemical difference”.
In 1818, Pelletier and Caventon gave the name “chlorophyll” to the green chemical substance which can be extracted from plant species by boiling in alcohol.
In 1837, Von Mohl was first to describe the presence of chloroplast in plant tissue.
In 1862, Sachs stated that the product of photosynthesis was starch. He first demonstrated the relation between starch, chlorophyll and photosynthesis.
In 1864, Stokes purified chlorophyll and gave the names chlorophyll a, chlorophyll b. He first described the involvement of the pigments carotene, xanthophylls and lastly fucoxanthin in brown algae during photosynthesis.
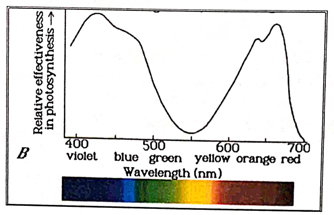
- In 1888, Engelman discovered the action spectrum in photosynthesis.
- In 1905, Blackman established the law of Limiting Factors and also studied the interaction of different factors in photosynthesis.
- In 1932, Emerson and Arnold showed the existence of light and dark reactions in photosynthesis via flashing light experiments.
- In 1961, Park and Biggins discovered quantasomes and stated that 1 quantasome contains 238 chlorophyll molecules.
- In 1965, Hatch and Slack discovered the carbon-4 cycle of carbon dioxide fixation in certain tropical plants.
Photosynthesis is a biochemical process which basically consists of 2 different steps. Its first stage is a photochemical or light-dependent phase while the other one is a light- independent or biosynthetic phase. All green parts of a particular plant species are involved in photosynthesis. The entire procedure occurs within the chloroplasts present in the cytoplasm of a plant cell.
The light-dependent phase or light reaction step occurs over the thylakoids in the presence of energy. This energy will be absorbed by 2 photosynthetic units known as PSI and PSII. It is the ATP generating stage where photolysis of water would occur and reduced co-enzyme is produced as assimilatory powers. The biosynthetic or thermochemical phase, which is even known as the dark reaction step where assimilatory powers produced are used for C-assimilation or conversion of inorganic carbon dioxide to organic compounds. The phase involves reduction of carbon dioxide and occurs in a cyclic manner. Reactions involving carbon compounds constitute the PCR or the Photosynthetic Carbon Reduction Cycle. Enzymes required are present in the chloroplast matrix or stroma. This phase can also be called the Blackman Reaction Phase and is actually a reductional phase of carbon dioxide to give carbohydrates. The entire process of carbon-assimilation occurs with the help of 3 different methods – Calvin Cycle, Hatch and Slack Pathway, and lastly CAM (Crassulacean Acid Metabolism) (Figure 1).
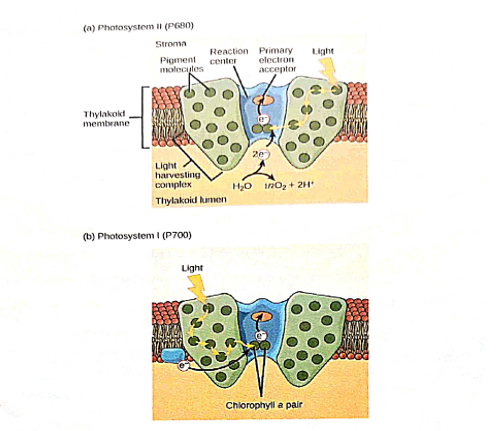
In photosynthesis, the light-dependent reactions always occur on the thylakoid membranes inside the green chloroplasts.
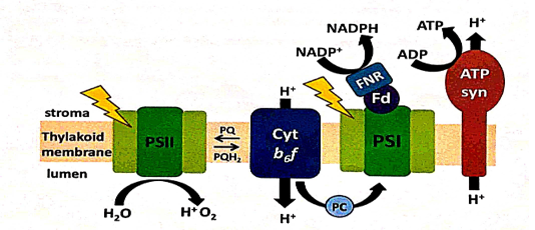
It is this thylakoid membrane which even consists of some integral membrane protein complexes which catalyse these reaction procedures. There are 4 such protein complexes in the thylakoid membrane, PSII, Cyt-b6f, PSI, and lastly ATP synthase. They all work together to ultimately produce the 2 important biochemicals—ATP & NADPH. All the 4 absorb light energy via pigments—specially by chlorophylls which produce the green colour in leaves. The light dependent reactions begin at PSII during the photochemical phase. This reaction centre comprises of 1 molecule of Chlorophyll a–680, antenna chlorophyll pigment made up of 200 molecules of Chl-a-670 & lastly accessory pigments (200 molecules of Chlorophyll-b), and finally a water splitting complex. At first, when energy in the form of sunlight falls on the PSII, in the form of photons, PSII uses the energy of sunlight to transfer electrons from water to a mobile electron carrier in the membrane itself called plastoquinone. This electron carrier in turn transfers electrons to cyt b6f which feeds them into PSI. Chlorophyll-a molecule gets activated to get in its excited state. Each molecule of Chlorophyll-a disperses an electron and then it gets positively charged and gets ionized.
The step when water is transferred to P680 is carried out by a poorly understood structure embedded within PSII called the water splitting or oxygen evolving complex. It catalyses a chemical reaction of water splitting into electrons, protons (Hydrogen ions), and oxygen (O₂).
4H₂O → 2H₂O + 2H⁺ + 4e⁻ + O₂↑
2H₂O → 4H⁺ + 4e⁻ + O₂↑ This was discovered by Van Neil for the first time in 1931. But the actual steps of this reaction run in the following way as named after Dolai:
- 2H₂O (monoxide) ↓
- OH-H₂O (hydroxide) ↓
- H₂O₂ (peroxide) ↓
- HO₂ (superoxide) ↓
- O₂ (dioxygen) This is known as Dolai’s Mechanism.
Robin Hill in 1937 demonstrated the whole process—since then it is known as Hill Reaction. The electrons are transferred to special chlorophyll molecules in P680 that are promoted to a comparatively higher energy state by the energy of photons. The excitation of P680 of the reaction centre pigment P680 occurs here in the reaction centre itself.
Chlorophyll molecules have a maximal absorption at 680nm. Electrons in the molecules are now promoted to a higher energy state with an efficiency of 90% and above because in addition to direct excitation by light energy at 680nm, energy of light, which is first harvested by antenna proteins at other wavelengths in the light harvesting system is also transferred to these special chlorophyll molecules.
This is even followed by the transfer from P680 to pheophytin and then to plastoquinone—this occurs in the reaction centre of PSII. High energy electrons are transferred to plastoquinone before it picks up 2H⁺ ions to become plastoquinol. It is then released into the membrane in the form of a mobile electron carrier.
All these stages occur in picoseconds with full efficiency.
When the chlorophyll passes the electrons to pheophytin, it receives 1 electron from PSII.
Both photo-systems are interlinked to each other via a trans-membrane proton pump, Cyt b6f (plastoquinol- plastocyanin reductase). Electrons from Psae are carried with the help of plastoquinol to Cyt b6f where they can be removed in a stepwise fashion (reforming plastoquinone) and transferred to a water-soluble electron-carrier known as plastocyanin. This redox process is coupled to the pumping of 4 protons across the membrane. The resulting proton gradient is used to make ATP synthase (together with the proton gradient produced by a water splitting complex in PSII). This entire process of the light dependent phase in photosynthesis can be shown in greater detail in the figure given below (Figure 2).
Thus we arrive at a point where there is considerable interest that, in essence, that the same internal machinery might be available in bacteria also. In case of purple bacteria, a single photosystem is present which is structurally related to P680 in chloroplasts in cyanobacteria too.
It is mainly a cyclic process in which all electrons would be removed from an excited chlorophyll molecule called bacteriochlorophyll P870 passed through an ETC chain to a proton pump – Cytbc1 complex and then returns to the chlorophyll molecule.
The outcome is a proton gradient functioning in making ATP via ATP synthase.
This is a solid state process within a complex transmembrane molecular structure.
P870 → P870* → Ubiquinone → Cytbc1 → Cytc2 → P870
To make NADPH, it uses an external electron donor (H₂, H₂S, S₈, SO₃²⁻, succinate, lactate) to feed electrons in a reverse ETC.
P700 accepts the electrons from plastocyanin and can transfer them either to NADPH or Cytbf. PSI contains antenna chlorophylls, P700, phylloquinone and a number of Fe-S proteins which serve as intermediate redox carriers.
Energy of absorbed light is funneled into the reaction center, where it excites special chlorophyll molecules into a comparatively higher energy state. The process occurs with high efficiency.
Electrons are all removed from these excited chlorophyll molecules and are transferred via a series of intermediate carriers to ferredoxin – a water soluble electron carrier.
There are 2 different pathways of electron transport in PSI. In non-cyclic electron transport, ferredoxin carries the electron to ferredoxin NADP⁺ reductase (FNR) which reduces NADP⁺ to NADPH. In cyclic transport of electrons, the electrons from ferredoxin are transferred to a proton pump–Cytbf. They are all returned to PSI by plastocyanin.
NADPH and ATP are used to synthesize organic molecules from CO₂ further.
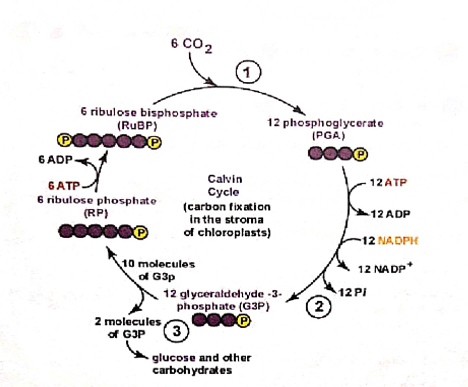
The second phase of photosynthesis is also known as the biosynthetic phase, photosynthetic carbon reduction (PCR) cycle or simply the dark reaction phase of photosynthesis which includes the Calvin Cycle. This phase basically involves genesis of glucose from carbon dioxide and other different compounds.
It involves chemical reactions in the stroma of a chloroplast which consume the products obtained by the light dependent reactions – ATP and NADPH and further chemical reactions are performed on them.
ATP and NADPH act as reducing powers to produce sugars for the plant’s benefit.
These substrates are then used in a series of reduction- oxidation reactions to produce sugars in a step-wise manner. There is no such direct straightforward reaction which can be able to convert carbon dioxide gas into a sugar as all of the energy would be dissipated in the form of heat. There are 3 different phases in the light independent phase which are collectively known as the Calvin Cycle–
- Carbon fixation
- Reduction reactions
- Ribulose 1,5-bisphosphate (RuBP) regeneration Even if it is known as the dark reaction phase, this process requires reduced NADP which is short-lived and is obtained from the light dependent phase in plants.
In the dark, there is a release of sucrose into the phloem of a plant species from their starch reserves to provide energy for the plant.
The Calvin cycle mainly occurs in the availability of light energy independent of the kind of photosynthesis – be it C₃ carbon fixation, C₄ carbon fixation or even if it is CAM (Crassulacean Acid Metabolism). In CAM plants, malic acid is stored every night in their cell vacuoles and the compound is released everyday to make this process work.
These reactions are coupled to the thylakoid electron transport chain as the energy required to reduce the carbon dioxide is produced with the help of NADPH produced during the light dependent phase in plant photosynthesis in PSI.
Even the biochemical process of photorespiration, also known as the C₂ cycle is coupled to the Calvin Cycle as it is obtained from an alternative reaction of RuBisCO enzyme, and its final byproduct would be another glyceraldehyde-3-P.
Enzymatic Steps of the Calvin Cycle (Right Panel)
- In the presence of enzyme transketolase and TPP (Thiamine pyrophosphate) fructose 6-phosphate would react with glyceraldehyde 3-phosphate to form a single molecule of erythrose 4-phosphate and xylulose 5-phosphate. Fructose 6-phosphate + glyceraldehyde 3-phosphate + transketolase + TPP → Erythrose 4-phosphate • Xylulose 5-phosphate
- Erythrose 4-phosphate and dihydroxyacetone 3-phosphate would condense in the presence of aldolase enzyme to give sedoheptulose 1,7-bisphosphate. This biochemical organic compound would be hydrolyzed by phosphatase enzyme to give sedoheptulose 7-phosphatase. A phosphate is released. Erythrose 4-phosphate + Dihydroxy-acetone 3-phosphate + Aldolase → Sedoheptulose 1,7-bisphosphate Sedoheptulose 1,7-bisphosphate + H₂O + Phosphatase → Sedoheptulose 7-phosphate + H₃PO₄
- Sedoheptulose 7-phosphate reacts with glyceraldehyde 3-phosphate in the presence of the enzyme transketolase and TPP. It produces 1 molecule each of xylulose 5-phosphate and ribose 5-phosphate. Sedoheptulose 7-phosphate + Glyceraldehyde 3-phosphate + TPP + Transketolase → Xylulose 5-phosphate • Ribose 5-phosphate
- Both the 2 compounds formed in step 3 transform to produce their isomer–ribulose 5-phosphate. Different enzymes are required for both the isomerisation reactions. Epimerase for xylulose 5-phosphate and isomerase for ribose 5-phosphate. Xylulose 5-phosphate + epimerase → Ribulose 5-phosphate Ribose 5-phosphate + isomerase → Ribulose 5-phosphate
- This biochemical compound changes into an acceptor molecule ribulose 1,5-bisphosphate with the help of ATP and an enzyme phosphoribulose kinase.
Ribulose 5-phosphate + ATP + Phosphoribulose kinase → Ribulose 1,5-bisphosphate + ADP Steps 2 and 3 together constitute a single phase of the Calvin Cycle known as glycolytic reversal stage as because the chemical reactions are just the reversal of those found in glycolysis in the process of respiration.
Some molecules of glyceraldehyde 3-phosphate undergo the process of isomerisation in the presence of the enzyme triose phosphate isomerase to form dihydroxyacetone 3-phosphate.
G3P + Triose phosphate isomerase → Dihydroxyacetone 3-phosphate
The 2 isomers – glyceraldehyde 3-phosphate and dihydroxyacetone 3-phosphate, condense in the presence of aldolase enzyme. The organic compound fructose 1,6-bisphosphate is obtained.
G3P + Dihydroxyacetone 3-phosphate + aldolase → Fructose 1,6-bisphosphate
Fructose 1,6-bisphosphate hydrolyses once in the presence of the enzyme phosphatase to give fructose 6-phosphate.
Fructose 1,6-bisphosphate + Phosphatase + H₂O → Fructose 6-phosphate + H₃PO₄
Fructose 6-phosphate isomerizes into glucose 6-phosphate. The compound so obtained can be changed into glucose as well as ADP-glucose or UDP-glucose to form various kinds of condensation products (Figure 3).
Fructose 6-phosphate + isomerase → Glucose 6-phosphate
Glucose 6-phosphate + H₂O + Phosphatase → Glucose + H₃PO₄
The Calvin Cycle is also known as Calvin–Benson– Bassham cycle or reductive pentose phosphate cycle. It was first discovered by using radioactive carbon isotope-C14 by Melvin Calvin, James Bassham and Andrew Benson at the University of California, Berkeley.
In plant cells, the Calvin Cycle in the light-independent phase uses the energy from short-lived electronically excited carriers to convert carbon dioxide and water into organic compounds that could be used by the organism and the animals which would feed on those plants. This set of reactions involves the first stage of Calvin Cycle which is known as the carbon fixation stage. The key enzyme is RuBisCO (Ribulose Bisphosphate Carboxylase Oxygenase). In the very first stage of the Calvin cycle, 1 molecule of carbon dioxide (CO₂) is incorporated into one of the following two 3-carbon molecules of glyceraldehyde 3-phosphate (G₃P) where 2 molecules of ATP and 2 molecules of NADPH are used up by it. Now the following 3 steps would take place (Figure 4).
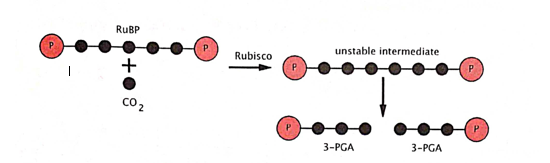
The enzyme RuBisCO catalyses the process of carboxylation of ribulose-1,5-bisphosphate, RuBP, a 5-carbon compound with the help of carbon dioxide in a chemical reaction involving only 2 different steps. The product of the very first step is enediol–enzyme complex that can capture CO₂ or O₂. When CO₂ is captured by enediol complex, it produces an unstable 6-carbon compound called 2-carboxy- 3-keto 1,5-bisphosphoribotol which will ultimately split into 2 molecules of 3-phosphoglycerate or 3-PGA, a 3-carbon compound.
The enzyme phosphoglycerate kinase would catalyse the phosphorylation of 3-PGA by ATP (produced in the light dependent stage). Thus we obtain the products – 1,3-Bisphosphoglycerate (1,3-BPGA) and ADP.
The enzyme glyceraldehyde 3-phosphate dehydrogenase catalyses the reduction of 1,3-BPGA with the help of NADPH – another product of the light dependent stage. Glyceraldehyde 3-phosphate (also known as G₃P, GP, TP, PGAL) is obtained and the NADPH itself is oxidised which gets excited to become NADP⁺.
Again, for fixation of every molecule of carbon dioxide, 2 NADPH molecules are utilized.
Thus the overall equation of C₃ assimilation in plants during photosynthesis is as follows:
6CO₂ + 6RuBP + 18ATP + 12NADPH + Enzymes → C₆H₁₂O₆ + 18ADP + 18Pi + 12NADP⁺
| INPUT | OUTPUT |
|---|---|
| 6CO₂ | 1 C₆H₁₂O₆ |
| 18 ATP | 18 ADP + 18Pi |
| 12 NADPH | 12 NADP⁺ |
In this project we begin with some interesting facts regarding photosynthesis and the effects of different wavelengths of light on this biochemical process which would act as a driving force to continue this process.
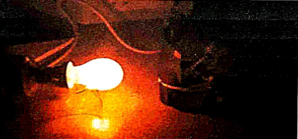
Experiment to Show the Effect of Different Wavelengths of Light on the Rate of Photosynthesis
Aim: To investigate the effect of different colors of light on the Rate of Photosynthesis in Plants (Figure 5).
Materials Required:
- Sample of Plant species – Cabomba sp.
- 100W bulb
- 1 m ruler ± 0.5 mm
- 1% sodium bicarbonate (NaHCO₃)
- Stopwatch (±1 second)
- 250 cm³ beaker (±25 cc)
- Thermometer (±0.5°C)
- Color Filters (x4)
- Safety Goggles
- Boiling Tube
Procedure:
- The entire experimental setup is as shown in the figure above.
- The sample of Cabomba plant is collected in the boiling tube.
- The boiling tube is placed inside the beaker and 2/3rds of the beaker is filled with water such that sodium bicarbonate can be dissolved with ease so as to submerge the plant.
- The boiling tube is filled with 1% sodium bicarbonate such that it completely covers the plant.
- Room temperature should be recorded to be about 25°C.
- The 100W bulb is plugged in and it is to be turned on to its side 5 cm away facing the beaker.
- The beaker is allowed to acclimatize for 2 minutes and return to the start temperature before beginning the next experiment.
- After 2 minutes, we count the number of bubbles which appear with 30-second increments in 2 minutes 30 seconds.
- The number of bubbles given off is recorded.
- The color of the light filter is changed and the beaker is allowed to acclimatize again before repeating the same experiment.
- The same experiment is recorded again but with a different color of light (Tables 1 & 2).
Observations and Calculations
Measure and Average of Number of Bubbles Produced:
| Light Color | Wavelength (±15 nm) | Bubbles per 30 s (±5%) | Bubbles per 30 s (±5%) | Bubbles per 30 s (±5%) | Measured Number of Bubbles | Average Number of Bubbles |
|---|---|---|---|---|---|---|
| White Light | ~555 nm | 63 | 63 | 111 | 33 | 30 |
| Red Light | ~670 nm | 23 | 49 | 49 | 40 | 37 |
| Yellow Light | ~575 nm | 36 | 49 | 46 | 44 | 44 |
| Blue Light | ~470 nm | 22 | 24 | 21 | 22 | 22 |
| Green Light | ~525 nm | 14 | 17 | 16 | 13 | 21 |
| Violet Light | ~425 nm | 31 | 20 | 24 | 23 | 26 |
Table 2: Number of Bubbles.
Average Rate of Photosynthetic Reaction
| Light Color | Average Number of Bubbles Produced per Minute (±1) |
|---|---|
| White Light | 52 |
| Red Light | 42 |
| Yellow Light | 46 |
| Blue Light | 22 |
| Green Light | 16 |
| Violet Light | 25 |
Table 3: Photosynthetic Reaction.
Conclusion
Photosynthetic Mechanism in Cyanobacteria
In cyanobacteria, both PSII and PSI are present but their LHC (Light Harvesting Complex) system differs from that available in plant species. Here instead of chlorophylls, these species of plants use phycobilins as antenna pigments.
But their electron transport chain is the same as in the case of chloroplasts as shown:
H₂O → PSII → PLASTOQUINONE → b₆f → CYTOCHROME c₆ → PSI → FERREDOXIN → NADPH ↑ ↓ Cyt b₆f ← PLASTOQUINONE Cytochrome c₆ is the mobile electron carrier in cyanobacteria whereas in the case of mere plant species, it was plastocyanin. Cyanobacteria can also synthesize ATP by oxidative phosphorylation like other bacteria.
The electron transport chain is: NADH Dehydrogenase → Plastoquinone → b₆f → cyt c₆ → cyt aa₃ → O₂ Where plastoquinone and cyt c₆ are the mobile electron carriers, while the proton pumps are NADH dehydrogenase, cyt b₆f, and cyt aa₃.
Cyanobacteria are the only bacterial species which would produce oxygen gas during photosynthesis.
Such organisms are scientifically henceforth believed to have produced our present-day oxygen-containing atmosphere.
Emerson Effect
Emerson effect can be defined as the increase in the rate of photosynthesis when the chloroplasts in a plant cell are exposed to 680 nm wavelength of light (which constitutes the deep red spectrum) and above (far red spectrum of light).
The rate of photosynthesis grows comparatively higher than the sum of the far red and deep red light photosynthetic rates when the plant is exposed to light of both wavelengths.
It dates back to 1957 when Robert Emerson described this naturalistic effect in his documentations by stating the following observations that he had taken note of:
Whenever plant species are exposed to light having a wavelength of 680 nm and above, then only one photosystem is activated, which is actually PS700, resulting in the formation of ATP itself.
When plants are exposed to light having wavelength less than 680 nm, the rate of photosynthesis is very low. On providing both shorter as well as longer wavelengths of light, the efficiency of the process increased, because both photosystems are working together harmonically, resulting in a higher yield.
Effect of the Color of Light on Plant Growth
Plants react invariably to different wavelengths and colors of light.
The color of light that a plant perceives during photosynthesis has a measurable impact on the total amount of energy a plant would be able to absorb. This is due to the variation in the wavelengths in different colors of light and irrespective of their length, different wavelengths of light would provide different levels of energy.
The highest energy light is at the violet or purple end of the VIBGYOR spectrum. These colored lights will have comparatively low energy but shorter wavelengths. At the end of the visible light spectrum, the light of red color would be having the maximum wavelength and would emit the least amount of energy.
Irrespective of the color of light, the plant will absorb some amount of energy from the light which it receives. Green light is the least effective for plant species because the majority of them are completely green in color due to the presence of the light-absorbing pigment—chlorophyll.
Different colors of light provide different benefits to various plant species as well.
As for instance, blue light helps to facilitate plant growth in some vegetative species of plants. Red light helps in flowering of plants when it is combined with blue light.
Cool fluorescent light is an excellent choice for plant cultivation indoors. However, the relationship between growth and pigmentation in different qualities of light is not yet understood with much clarity. It is still left uncovered in case of macroscopic algae. For red seaweeds, very little work is currently being carried out on the spectral effect of growth & metabolism.
In 1994, Leukart and Leming have both demonstrated that light of green color at extremely low intensity of 0.5 μmol/m²/s was more effective than red or blue color lights to facilitate growth in several red algae.
The contrasting better growth rate of Porphyra umbilicalis (in providing red and blue color lights) was probably due to greater photosynthetic efficiency and quantum yield. The low photosynthetic efficiency of various species of red algae in blue light has been well known from the photosynthetic action spectrum.
High Influencing Light-Emitting Diode Triggers Secondary Compound Production
Photosynthetic organisms whenever exposed to high energy light radiations develop short as well as long-term response mechanisms in order to minimize stress effects. Some of these mechanisms include for example: xanthophylls cycle, non-photochemical quenching, anti-oxidant action, re-oxidation of the reduction equivalents with the help of photo-respiration, etc.
As far as recent studies on the effect of different wavelengths of light energy on photosynthesis is concerned, the high influence effect of LED lights has been more enthusiastically studied in photosynthetic microbes, partly as because they would present before humanity a huge economic and biotechnological potential which could be brought out to all the masses as biofuels, food additives, cosmetics, pharmaceuticals, etc.
For instance, Wang et al. had assessed the economic efficiency of energy converted to biomass in micro-algae culture under different LED monochromatic lights as grams of biomass per 1 per dollar. The data even showed that at light intensity of 1500–3000 μmol/m²/s, red lights consumed the lowest amount of power and yielded the maximum amount of efficiency when it was emitted at the same intensity as compared to blue LEDs.
However, such a high influence of light is not always recommended. Additional blue light is comparatively less stressful than the red light. However, additional blue or red LED lights of wavelength 470 nm led to stresses where the xanthophylls cycle got activated. For instance, Katsuda et al. reported that LED light of red color had facilitated the growth of the green alga Haematococcus pluvialis while on the other hand blue LED light had enhanced astaxanthin production.
Artificial Light Sources for Photosynthesis
Artificial lighting must provide plants with the energy of development. That is the reason why fluorescent lamps, particularly the cool fluorescent white lamps having enhanced red and blue spectra, are widely used in the growth chambers together with additional light sources to achieve the sustained photosynthetic photon influence required for high productivity.
High Intensity Discharge lamps (HID) like high-pressure sodium lamps and metal halide lamps have an influence of 200 lumens per watt at the most, along with high energy photosynthetically active radiations (PARS) with an efficiency of 40% and are typically used in plant growth rooms and greenhouses.
Among artificial lighting systems, LEDs represent the maximum PAR efficiency. But the drawbacks of LEDs, PARS, and metal halide lamps include from elevated arc to fire-energy requirement, the high-operational temperature avoiding close-canopy placement and the spectral distribution also. This distribution constitutes a high proportion of green-yellow region of light, significant UV radiation, and lastly an altered deep red:far red ratio. Additional red or blue colored light is less stressful than the red light when used in combination. For instance, Katsuda
et al. reported that red LED light facilitated the growth of the green alga Haematococcus pluvialis, while blue LED light enhanced astaxanthin production in the organism.
The high efficiency, low operating, and small-sized LED lights can also be incorporated to be used in pulse-lighting and be placed close to the leaves in plant species in inter-lighting and intra-canopy irradiation. Their long-life expectancy and ease of control make them ideal for greenhouse facilities.
Conclusion
Almost everyone knows that plants are the real food factories of nature. Most of the people around us are aware that their energy source is mainly light energy. They take use of this form of energy to transform it into chemical energy which is ultimately stored in the food prepared by these plant species.
The process which is used to manufacture this food just merely from light energy is none other than photosynthesis.
Different plant species would respond differently to different wavelengths of light. Each organ of a plant might respond invariably to various colors of light in nature. In the field of scientific research and development, we have developed the technology to illustrate the above fact to mankind. Our research is yet pending on various topics regarding this subject with various plant species. We are still on the way to reach out to humankind with various newer and finer technologies which would be beneficial to the flora and fauna of the globe. Hence, the subject is a new field of development of technology and research. Our progress in this subject goes on.
Acknowledgement
I deeply express my gratitude towards the Head of the Biology Department – Mrs. Nilanjana Saha of our institution for providing the opportunity to explore new avenues towards the completion of the project.
With regards, I would also like to thank our respected biology teacher Mr. Rohan Mukherjee for his support with us throughout the entire session, his endeavours and guidance which paved the path before me for fulfilling this project. It has been completed under the vigilance of the Biology Department of our school, whom I would like to thank wholeheartedly for all endurances with us throughout the years. My thanks to CBSE Board for providing us the space to explore new imaginations, consolidations and thoughts regarding the subject, all my colleagues and classmates for their support during the years all throughout and lastly I would be happy to give a special mention to all my online resources, literatures and textbooks which were the basic pre-requisites for completing the entire project.
Finally, I would like to deliver the words of thankfulness to my parents whose guidance, and unconditional support has indeed given me a helping hand to walk along the path of independent action. By giving up all sorts of temptations, materialistic luxuries, pleasures, etc. has finally led me to the goal of completing this project.
References
-
Class 11 Biology. NCERT Textbook.
-
DINESH Companion Biology for Class 11. 11.
-
Rudiments of Biology for Class 11. Pradip Dasgupta, Sunil Mitra.
-
Jayasankar R, Kulandaivelu G (2021) Influence of different wavelengths of light on photosynthesis and pigment constituents and absorption spectra of gracilaria spp.
-
Bayat L, Arab M, Aliniaeifard S (2018) Effects of growth under different light spectra on the subsequent high light tolerance in rose plants. AoBP 10(5).
-
Darko E, Heydarizadeh P, Schoefs B, Sabzalian MR (2014) Photosynthesis under artificial light: the shift in primary and secondary metabolism. Philos Trans R Soc Lond B Biol Sci 369(1640): 20130243.
-
(2024) Light-dependent reactions.
-
(2021) Calvin cycle.
-
Flavors and Fragrances: Measurement Procedure. Konica Minolta.
-
(2023) Cancer Biology
-
Essays in biology (2018) The effect of light color.
- An Efficient and Affordable Method for Isolating Bone Marrow- Derived Mesenchymal Stem Cells from Swiss Albino Mice
- Superposition of Cryo-EM and AlphaFold Predictions of Dengue Antigen-Antibody Complexes
- Jugular-Applied Coherent Low-Level Laser Therapy Enhances Systemic Mitochondrial Metabolic Function and Antioxidant Response
- Role of OMC32 Polypeptide in Acrosin-Mediated Exocytosis during the Bovine Sperm Acrosome Reaction
- Association of Galectin-3 but not Laminin in Tamoxifen-Induced Growth Suppression in Breast Cancer MCF-7 Cells
- Nutritional, Therapeutic, and Environmental Effect of Oyster Mushrooms: An Editorial