Population Genetic Analysis of 12 X-STRs in a Bahraini Population Sample
To date, there are very limited genetic studies conducted on the Kingdom of Bahrain and this is one of the first studies directed to evaluate the 12 X-STRs included in the Investigator X-12 QS kit. Bahrain is a small archipelago positioned in the Arabian Gulf. X-STRs are very informative in population genetics studies, human identification and complex kinship analysis. One hundred and fifty-six (156) buccal swabs were collected using cotton swabs from non-relatives’ Bahraini males from four different regions of Bahrain. Genomic DNAs were extracted and purified using QIAsymphony SP instrument following quantification with Investigator Quantiplex HYres Kit in the 7500 Real-Time PCR System and detected in ABI 3500xl Genetic Analyzer. Analysis was done using various statistical software to obtain allele and haplotypes’ frequencies based upon the available four clusters of Linkage Groups (LGs) as well as different forensic and population parameters. Results indicated the diversity of the Bahraini population in terms of high Power of Discrimination (PD) and Probability of Match (PM) values. The combined values of each forensic parameter such as cPDM, Mean exclusion chance (cMEC) Krüger, CMEC Kishida, and CMEC Desmarais as well as CMEC Desmarais Duo, were 0.9999983, 9999979, 0.9999939, 0.9999996 and 0.9999514 respectively based on the allele and haplotype frequencies. No shared profiles were observed. Number of non-standard alleles and null alleles were obtained, and more profoundly in locus DXS10148. We have constructed phylogenetic tree as well as multidimensional scale to analyze the interpopulation diversity between Bahraini population and other neighboring populations and our findings reflected the geographical and social background of the region. Overall, the results confirmed the importance of X-STRs in discriminating between individuals among Bahraini population and in establishing DNA databases for forensic and kinship studies.
Introduction
The Investigator Argus X-12 QS Kit (Qiagen, Germany) is a multiplex solution that amplifies 12 segments of DNA located in the chromosomal X short tandem repeats (X-STRs). This solution is used for human identification, paternity testing, forensic cases and population genetic studies [1]. X-STR markers are very informative for some cases where autosomal STRs fail to provide crucial answers such as in kinship testing involving female offspring sharing the same father [2]. In this kit, the 12 X-STR markers are clustered into four distinct linkage groups (LG), each cluster includes three markers: LG1 (DX8378-DXS10135- DXS10148), LG2 (DXS7132-DXS100740-DXS10079), LG3 (DXS10101-DXS10103-HPRTB), LG4 (DXS7423-DXS10134- DXS10146) [3]. The dependency between markers is known as linkage and is the physical proximity of two loci on the same chromosome [2].
To date, there are few population genetic studies conducted on the Kingdom of Bahrain as well as in the Arabian Peninsula region. Knowledge of any such structure is crucial in the interpretation of DNA-based forensic evidence and in the construction of applicable databases. Recent studies were done using autosomal STR and YSTR kits [4, 5].
Kingdom of Bahrain is a small archipelago located in the Arabian Gulf with a total landmass of 760 square kilometers [6] consisting of 33 islands, only the five largest are inhabited. These islands are consisting of Bahrain, Muharraq, Umm and Nasan and Sitra. To the southeast of Bahrain is the State of Qatar, and to its west stands the Kingdom of Saudi Arabia, with which it is connected by a 25-kilometer causeway. To the north and east of Bahrain is the Islamic Republic of Iran [7].
Because of the geographical location of Bahrain, the diversity of the population had been affected which is generally divided into four main ethnic groups: Arabs, Baharna and Persians (Huwala and Ajam) [8, 9, 10]. This geographical and social association might be anticipated to have an effect on the patterns of the genetic variations [11]. Currently, the geographical distribution of Bahrain is included into 4 governorates: Northern, Muharraq, Capital and Southern Governorates.
This present study is to genetically characterize the Bahraini population, using Investigator Argus X-12 QS Kit (Qiagen, Germany). We present a database of 12 X-STRs allele and haplotype frequencies for Bahraini population sample including the high combined forensic statistical parameters of these loci, and collectively as haplotypes, illustrate that they are informative and discriminatory. The comparison with worldwide populations demonstrate that they generally reflect biogeography and historical relationships.
Twelve X-STRs were studied to characterize different genetic population and forensic parameters in 156 Bahraini males. These includes the following primers to co-amplify the Amelogenin (AM) used for gender determination, DXS7132, DXS7423, DXS8378, DXS10074, DXS10079, DXS10101, DXS10103, DXS10134, DXS10135, DXS10146, DXS10148 and HPRTB which have been proven to offer consistent DNA typing results and boost the power of discrimination (PD). Furthermore, the autosomal STR marker D21S11 is included as a reliable marker for common database kits and prevents sample mixup and was excluded from the genetic analysis for this study. In addition, the Kit Primer comprises of an internal PCR control (Quality Sensor QS1) to provide support about the efficacy of the PCR. The Quality Sensor is amplified along with the polymorphic X-STRs’ markers and was excluded from all the genetic analysis for this study.
Materials and Methods
Sample Collection
One hundred and fifty-six (156) buccal swabs were assembled using cotton swabs (SceneSafe, UK) from healthy unrelatives’ Bahraini males. The research study was publicized through different media platforms. Participants who wished to contribute their samples communicated with the corresponding author and presented at the General Directorate of Criminal investigation and Forensic Science – Kingdom of Bahrain to liver their buccal swabs for the research after obtaining informed consent. The age of the participants varied from 19 to 58 years old.
In each case, males with ancestry (to the level of paternal grandfather) from four different geographical subdivisions of the country (Capital Governorate, Muharraq Governorate, Northern Governorate and Southern Governorate) were sampled. Ethical review for conducting tests was obtained and approved by the Research and Research Ethics Committee (RREC) (E007-PI-10/17) in the Arabian Gulf University. All participants provided informed consent prior to contribution their buccal swab samples. DNA Processing Genomic DNAs were extracted using QIAsymphony SP instrument (Qiagen, Germany) following magnetic beads principal. Subsequently the extracted DNAs were quantified using Investigator Quantiplex HYres Kit (Qiagen, Germany) in the 7500 Real-Time PCR System (Thermo Fisher Scientific, Inc., Waltham, MA, USA) according to manufacturer’s recommendation. About 0.5 ng of the extracted DNA was amplified using Investigator Argus-X12 QS kit (Qiagen, Germany) with half-volume reactions (12.5µl) following manufacturer’s protocol in 27 cycles conditions via MicroAmp Optical 96-Well Reaction Plate (Thermo Fisher Scientific, Inc., Waltham, MA, USA) along with the provided positive control and DNA grade water as a negative control.
The PCR products (1µl) were separated by capillary electrophoresis in an ABI 3500xl Genetic Analyzer (Thermo Fisher Scientific Company, Carlsbad, USA) with reference to the BTO size standard (Qiagen, Germany) in total of 12 µl master mix consisting of BTO size standard and Hi-Di formamide (Thermo Fisher Scientific, Inc., Waltham, MA, USA). GeneMapper® ID-X Software v1.4 (Thermo Fisher
Scientific, Inc., Waltham, MA, USA) was used for genotype assignment.
Statistical Analysis
Allele and haplotype frequencies were calculated using StatsX v1.0 software [12]. Also, Linkage groups (LG) were designated as 3 loci in each LG in total of 4 LGs in StatsX v1.0 software [12]. Forensic parameters such as power of discrimination (PD), random matching probability (PM), power of exclusion (PE), polymorphism information content (PIC), number of alleles (Nall) and linkage disequilibrium (LD) between pair of loci were estimated using STRAF [13]. Mean exclusion chance in Duos (MECD), PD for females (PDf), and PD in males (PDm) were estimated using ChrX-STR.org 2.0 website [14]. It should be noted that all of the samples were compromised of males, so it was impossible to calculate the Hardy-Weinberg (HW) equilibrium.
Interpopulation pairwise genetic distances based on Fst between the population of Bahrain and the rest of populations extracted from the literature which included Saudi [15], Filipino [16], Emiratis [17], Bengali [18], Egyptian [19], Turkish [20], Indian [21], Algerian [22] and Jewish [23] were calculated using POPTREE2 software [24] and represented by a nonmetric multidimensional scaling (NM-MDS) analysis using IBM SPSS Statistics v21.0 Software to investigate the populations structure between Bahraini population and the abovementioned populations based on Fst’s genetic distances. Phylogenetic tree was constructed from allele frequency data by using the neighbor-joining method [25] via MEGA X: Molecular Evolutionary Genetics Analysis [26]. The tree is used to compare between different genetic structures of the populations with Bahraini population using the minimum available loci for different populations. The tree was constructed with allele frequency data of twelve STR loci (DXS7132, DXS7423, DXS8378, DXS10074, DXS10079, DXS10101, DXS10103, DXS10134, DXS10135, DXS10146, DXS10148 and HPRTB) for all populations in corrected fixation index (Fst) using neighbor joining for phylogeny in 1000 permutations.
Results
Allele Frequencies, Forensic Parameters and Efficiency: As for the allele frequency score, some alleles show very high frequencies in the Bahrain population such as allele 14 in DXS7423 with highest frequency of 0.462, followed by allele 19 in DXS10103 with frequency of 0.447 (Tables 1-4). The least frequent was 0.0064 for 12 different alleles. The probability that two randomly chosen person have the same unspecified genotype at a locus is the sum squares of the frequencies of all genotypes at that locus. The full set of Bahrain data is available in Table S1. No shared profiles were observed.
In this studied population, number of alleles per locus (Nall) was ranged from 5 for marker DXS8378 to 27 for DXS10135 with an average Nall per locus with 13.66, and a total number of alleles observed was 164. The most polymorphic locus was DXS10135 (Tables 1-4).
The highest gene diversity (GD) was observed for locus DXS10135 with 0.9467 while the smallest observed was for locus DXS7423 with 0.6693 (Tables 1-4).
Based on allele frequencies, we further determined the statistical parameters of forensic interest. Generally, the polymorphism degree of a specific locus can be measured by the Polymorphism Information Content (PIC) which indicates the degree of genetic polymorphism. We have found out that PIC values for all STR loci were highly informative (PIC≥0.6) with an average of 78.9% (Tables 1-4). PM was ranged from 0.0594 for DXS10135 to 0.3403 for DXS7423.
| Allele/N* | DXS8378 | DXS10135 | DXS10148 | DXS7132 | DXS10074 | DXS10079 | DXS10101 | DXS10103 | HPRTB | DXS7423 | DXS10134 | DXS10146 |
|---|---|---|---|---|---|---|---|---|---|---|---|---|
| N | 156 | 154 | 151 | 156 | 156 | 156 | 156 | 150 | 156 | 156 | 155 | 155 |
| 7 | 0.077 | |||||||||||
| 8 | 0.160 | |||||||||||
| 9 | 0.006 | |||||||||||
| 10 | 0.269 | 0.006 | ||||||||||
| 11 | 0.397 | 0.019 | 0.006 | 0.122 | ||||||||
| 12 | 0.308 | 0.192 | 0.006 | 0.385 | 0.013 | |||||||
| 13 | 0.019 | 0.237 | 0.013 | 0.256 | 0.026 | |||||||
| 13.3 | 0.020 | |||||||||||
| 14 | 0.006 | 0.256 | 0.026 | 0.179 | 0.462 | |||||||
| 15 | 0.231 | 0.096 | 0.013 | 0.038 | 0.327 | |||||||
| 16 | 0.058 | 0.135 | 0.013 | 0.067 | 0.135 | |||||||
| 17 | 0.019 | 0.007 | 0.006 | 0.186 | 0.109 | 0.100 | 0.013 | 0.038 | ||||
| 17.1 | 0.006 | |||||||||||
| 18 | 0.045 | 0.152 | 0.179 | 0.154 | 0.220 | |||||||
| 18.1 | 0.013 | |||||||||||
| 19 | 0.065 | 0.033 | 0.083 | 0.250 | 0.447 | |||||||
| 19.1 | 0.013 | |||||||||||
| 20 | 0.065 | 0.020 | 0.026 | 0.212 | 0.140 | |||||||
| 20.1 | 0.032 | 0.007 | ||||||||||
| 21 | 0.117 | 0.007 | 0.135 | 0.020 | ||||||||
| 21.1 | 0.019 | |||||||||||
| 22 | 0.071 | 0.013 | 0.109 | 0.007 | ||||||||
| 22.1 | 0.006 | 0.013 | ||||||||||
| 23 | 0.052 | 0.013 | 0.006 | |||||||||
| 23.1 | 0.013 | 0.013 | ||||||||||
| 24 | 0.058 | 0.007 | 0.013 | |||||||||
| 24.1 | 0.006 | 0.152 | ||||||||||
| 24.2 | 0.006 |
Table 1: Allele frequency and forensic efficiency parameters of (156) samples from population of Bahrain.
| Allele/N | DXS8378 | DXS10135 | DXS10148 | DXS7132 | DXS10074 | DXS10079 | DXS10101 | DXS10103 | HPRTB | DXS7423 | DXS10134 | DXS10146 |
|---|---|---|---|---|---|---|---|---|---|---|---|---|
| N | 156 | 154 | 151 | 156 | 156 | 156 | 156 | 150 | 156 | 156 | 155 | 155 |
| 25 | 0.032 | 0.007 | 0.006 | 0.052 | ||||||||
| 25.1 | 0.166 | |||||||||||
| 26 | 0.071 | 0.006 | 0.084 | |||||||||
| 26.1 | 0.006 | 0.126 | ||||||||||
| 26.2 | 0.026 | |||||||||||
| 27 | 0.071 | 0.013 | 0.006 | 0.103 | ||||||||
| 27.1 | 0.099 | |||||||||||
| 27.2 | 0.026 | |||||||||||
| 28 | 0.071 | 0.007 | 0.019 | 0.161 | ||||||||
| 28.1 | 0.060 | |||||||||||
| 28.2 | 0.007 | 0.141 | ||||||||||
| 29 | 0.032 | 0.007 | 0.019 | 0.187 | ||||||||
| 29.1 | 0.033 | |||||||||||
| 29.2 | 0.141 | |||||||||||
| 30 | 0.071 | 0.007 | 0.051 | 0.006 | 0.077 | |||||||
| 30.2 | 0.167 | |||||||||||
| 31 | 0.013 | 0.077 | 0.006 | 0.052 | ||||||||
| 31.1 | 0.007 | |||||||||||
| 31.2 | 0.096 | |||||||||||
| 32 | 0.006 | 0.090 | 0.032 | 0.013 | ||||||||
| 32.2 | 0.045 | |||||||||||
| 33 | 0.013 | 0.045 | 0.084 | |||||||||
| 33.2 | 0.006 | |||||||||||
| 34 | 0.006 | 0.013 | 0.148 | 0.006 | ||||||||
| 34.2 | 0.013 | |||||||||||
| 35 | 0.013 | 0.219 | ||||||||||
| 36 | 0.200 | |||||||||||
| 37 | 0.168 | |||||||||||
| 37.2 | 0.006 | 0.013 |
Table 2: Allele frequency and forensic efficiency parameters of (156) samples from population of Bahrain.
| Allele/N | DXS8378 | DXS10135 | DXS10148 | DXS7132 | DXS10074 | DXS10079 | DXS10101 | DXS10103 | HPRTB | DXS7423 | DXS10134 | DXS10146 |
|---|---|---|---|---|---|---|---|---|---|---|---|---|
| N | 156 | 154 | 151 | 156 | 156 | 156 | 156 | 150 | 156 | 156 | 155 | 155 |
| 25 | 0.032 | 0.007 | 0.006 | 0.052 | ||||||||
| 25.1 | 0.166 | |||||||||||
| 26 | 0.071 | 0.006 | 0.084 | |||||||||
| 26.1 | 0.006 | 0.126 | ||||||||||
| 26.2 | 0.026 | |||||||||||
| 27 | 0.071 | 0.013 | 0.006 | 0.103 | ||||||||
| 27.1 | 0.099 | |||||||||||
| 27.2 | 0.026 | |||||||||||
| 28 | 0.071 | 0.007 | 0.019 | 0.161 | ||||||||
| 28.1 | 0.060 | |||||||||||
| 28.2 | 0.007 | 0.141 | ||||||||||
| 29 | 0.032 | 0.007 | 0.019 | 0.187 | ||||||||
| 29.1 | 0.033 | |||||||||||
| 29.2 | 0.141 | |||||||||||
| 30 | 0.071 | 0.007 | 0.051 | 0.006 | 0.077 | |||||||
| 30.2 | 0.167 | |||||||||||
| 31 | 0.013 | 0.077 | 0.006 | 0.052 | ||||||||
| 31.1 | 0.007 | |||||||||||
| 31.2 | 0.096 | |||||||||||
| 32 | 0.006 | 0.090 | 0.032 | 0.013 | ||||||||
| 32.2 | 0.045 | |||||||||||
| 33 | 0.013 | 0.045 | 0.084 | |||||||||
| 33.2 | 0.006 | |||||||||||
| 34 | 0.006 | 0.013 | 0.148 | 0.006 | ||||||||
| 34.2 | 0.013 | |||||||||||
| 35 | 0.013 | 0.219 | ||||||||||
| 36 | 0.200 | |||||||||||
| 37 | 0.168 | |||||||||||
| 37.2 | 0.006 | 0.013 | ||||||||||
| Allele/N | DXS8378 | DXS10135 | DXS10148 | DXS7132 | DXS10074 | DXS10079 | DXS10101 | DXS10103 | HPRTB | DXS7423 | DXS10134 | DXS10146 |
| N | 156 | 154 | 151 | 156 | 156 | 156 | 156 | 150 | 156 | 156 | 155 | 155 |
| 38 | 0.045 | |||||||||||
| 38.1 | 0.007 | |||||||||||
| 38.2 | 0.006 | |||||||||||
| 38.3 | 0.006 | |||||||||||
| 39 | 0.026 | |||||||||||
| 39.2 | 0.019 | |||||||||||
| 39.3 | 0.019 | |||||||||||
| 40.2 | 0.032 | |||||||||||
| 41.2 | 0.013 | |||||||||||
| 41.3 | 0.019 | |||||||||||
| 42.2 | 0.026 | |||||||||||
| 42.3 | 0.013 | |||||||||||
| 43.2 | 0.045 | |||||||||||
| 44.2 | 0.032 | |||||||||||
| 45.2 | 0.019 | |||||||||||
| 46.2 | 0.019 | |||||||||||
| 47.2 | 0.013 | |||||||||||
| Forensic Statistics | ||||||||||||
| PIC | 0.607733 | 0.936221 | 0.883274 | 0.74906 | 0.851058 | 0.803967 | 0.683826 | 0.707199 | 0.696207 | 0.601068 | 0.832856 | 0.895932 |
| H | 0.325484 | 0.060488 | 0.107386 | 0.215992 | 0.134297 | 0.173134 | 0.279558 | 0.261093 | 0.262401 | 0.340264 | 0.149905 | 0.09681 |
| HET | 0.674516 | 0.939512 | 0.892614 | 0.784008 | 0.865703 | 0.826866 | 0.720442 | 0.738907 | 0.737599 | 0.659736 | 0.850095 | 0.90319 |
| PE | 0.389949 | 0.876615 | 0.780357 | 0.569705 | 0.726039 | 0.649814 | 0.460588 | 0.490981 | 0.488791 | 0.368758 | 0.695052 | 0.801942 |
| Power of Discrimination | ||||||||||||
| PD female | 0.827277 | 0.99305 | 0.979128 | 0.918399 | 0.967319 | 0.947126 | 0.885231 | 0.900123 | 0.889754 | 0.825552 | 0.960289 | 0.98337 |
| PD male | 0.674516 | 0.939512 | 0.892614 | 0.784008 | 0.865703 | 0.826866 | O.720442 | 0.738907 | 0.737599 | 0.659736 | 0.850095 | 0.90319 |
| Mean paternity exclusion change | ||||||||||||
| MEC Krüger | 0.393295 | 0.877499 | 0.784705 | 0.571867 | 0.729362 | 0.654432 | 0.501305 | 0.490852 | 0.508674 | 0.402189 | 0.698798 | 0.80587 |
| MEC Kishida | 0.607611 | 0.936115 | 0.882727 | 0.74906 | 0.850947 | 0.803853 | 0.683473 | 0.6622 | 0.696207 | 0.600947 | 0.829488 | 0.893765 |
| MEC Desmarais | 0.607733 | 0.936221 | 0.883274 | 0.74906 | 0.851058 | 0.803967 | 0.683826 | 0.707199 | 0.696207 | 0.601068 | 0.832856 | 0.895932 |
| MEC Desmarais Duo | 0.46044 | 0.883478 | 0.80012 | 0.617823 | 0.752132 | 0.687488 | 0.542731 | 0.570105 | 0.556593 | 0.455211 | 0.727428 | 0.819724 |
Table 3: Allele frequency and forensic efficiency parameters of (156) samples from population of Bahrain.
| cPD_Male cMEC_Krüger cMEC_Kishida cMEC_Desmarais cMEC_Desmarais_duo | 0.9999983 0.9999979 0.9999939 0.9999996 0.9999514 |
|---|
Table 4: Allele frequency and forensic efficiency parameters of (156) samples from population of Bahrain.
*N: Number of samples; PIC: Polymorphism information content; h: Homozygotie; HET: Heterozygotie; PE: Power of Exclusion; PD: Power of discrimination; cMEC: Combined Mean paternity exclusion change The PM was ranged from 0.0594 for DXS10135 to 0.3403 for DXS7423. The power of discrimination (PD) explains level of discriminating between members. As higher the discriminating power of a locus, the more efficient it can be used to discriminate between members. DXS10135 showed the greatest (PD) in Bahraini population with value of 0.9406, whereas DXS7423 gave the lowest value of (PD) with only 0.6597. The average (PD) of the tested loci was 0.815. The combined PD (CPD) and combined MP (CMP) for all the 12 X-STR loci were 99.99999997% and 3.02583E- 10 respectively. The combined values of each forensic parameter, cPDM, cMEC Krüger, cMEC Kishida, and cMEC Desmarais as well as cMEC Desmarais Duo, were 0.9999983, 0.9999979, 0.9999939, 0.9999996 and 0.9999514
respectively (Tables 1-4). The high values of the above- mentioned parameters indicated the usefulness of using the 12-XTRs markers included in the Investigator Argus X-12 QS Kit as a discrimination tool in complement with autosomal STRs [4] and can be utilized for genetic characterization of the Bahraini population to differentiate between individuals for forensic and kinship purposes.
Linkage Disequilibrium Analysis: As shown in Table 5, the study showed no significant deviation from linkage disequilibrium (LD) between pairwise STR loci after Bonferroni’s correction in Bahraini population except when plotting the following loci; DXS10074 - DXS10135, DXS10148 - DXS10148, DXS10134 - DXS10148, DXS7132 - DXS10146, DXS7132 - DXS7132 and DXS10103 – HPRTB. The highest pairwise LD was 0.999 when plotting DXS10101 with DXS10148 and also when plotting DXS10103 with DXS10146 and the lowest pairwise LD was 3.62E-07 when plotting DXS10148 with DXS10148.
The significance in LD was obtained between different loci in different LGs and within same LGs.
| DXS8378 | DXS10135 | DXS10148 | DXS7132 | DXS10074 | DXS10079 | DXS10101 | DXS10103 | HPRTB | DXS7423 | DXS10134 | DXS10146 | |
|---|---|---|---|---|---|---|---|---|---|---|---|---|
| DXS10146 | 0.434436 | 0.834526 | 0.000114 | 0.77173 | 0.623602 | 0.617766 | 0.999879 | 0.762272 | 0.798729 | 0.778209 | 0.460807 | |
| DXS10134 | 0.856572 | 0.00014 | 0.974159 | 0.890384 | 0.009892 | 0.978075 | 0.91026 | 0.119297 | 0.99456 | 0.198766 | ||
| DXS7423 | 0.12909 | 0.712395 | 0.856028 | 0.58943 | 0.633612 | 0.788513 | 0.874481 | 0.046661 | 0.929244 | |||
| HPRTB | 0.031025 | 0.360825 | 0.838351 | 0.660623 | 0.719482 | 0.86349 | 6.88E-06 | 0.115648 | ||||
| DXS10103 | 0.600294 | 0.173926 | 0.236435 | 0.762466 | 0.659187 | 0.750817 | 0.005649 | |||||
| DXS10101 | 0.940213 | 0.999954 | 0.803355 | 0.811644 | 0.870909 | 0.472515 | ||||||
| DXS10079 | 0.245888 | 0.014217 | 0.982419 | 0.491172 | 0.879475 | |||||||
| DXS10074 | 0.001805 | 0.93321 | 0.963231 | 0.254482 | ||||||||
| DXS7132 | 0.718462 | 0.839586 | 0.000477 | |||||||||
| DXS10148 | 0.517361 | 2.94E-06 | ||||||||||
| DXS10135 | 0.498013 | |||||||||||
| DXS8378 |
Table 5: Haplotype diversities of four X-Chromosomal linkage groups in Bahraini male individuals.
Haplotype Allele Frequencies: Haplotype allele frequencies were determined using the four LG clusters as shown in Tables 6-9. The numbers of observed haplotypes in each of the 4 linkage groups-LG1, LG2, LG3, LG4- were 148, 156, 149 and 153, respectively, while the Haplotype Diversity (HD) values were equal to 1.0000. The three most common haplotype for LG1 was 11-21-25.1 displaying 1.99% of haplotype frequency, in LG2 three sets of haplotypes 14-17-19, 14-7-20 and 15-8-19 were observed each with a frequency of 2.56 % LG3 presented haplotypes 29.2-19-12 4.46% and LG4 14-33- 29 and 15-37-27 with haplotype frequency 2.63%.
As for LG1, most of haplotype frequencies counted as 1 or 2 which gave very diverse combinations of haplotypes. Unique haplotypes, which were observed once, accounted for 55.9% of all LGs haplotype observed (339/606).
| LG1 Haplotype | Count | Frequency | LG2 Haplotype | Count | Frequency | LG3 Haplotype | Count | Frequency | LG4 Haplotype | Count | Frequency |
|---|---|---|---|---|---|---|---|---|---|---|---|
| 10 17 18 | 1 | 0.0068 | 11 15 21 | 1 | 0.0064 | 24.2 20 12 | 1 | 0.0067 | 12 37 26 | 1 | 0.0065 |
| 10 17.1 13.3 | 1 | 0.0068 | 11 16 17 | 1 | 0.0064 | 25 19 13 | 1 | 0.0067 | 12 39.3 28 | 1 | 0.0065 |
| 10 19 25.1 | 1 | 0.0068 | 11 16 22 | 1 | 0.0064 | 26 20 15 | 1 | 0.0067 | 13 33 42.2 | 1 | 0.0065 |
| 10 19 26.1 | 1 | 0.0068 | 12 15 18 | 1 | 0.0064 | 26.2 16 12 | 1 | 0.0067 | 13 34 29 | 1 | 0.0065 |
| 10 19.1 26.1 | 1 | 0.0068 | 12 15 19 | 1 | 0.0064 | 26.2 18 12 | 1 | 0.0067 | 13 37 28 | 1 | 0.0065 |
| 10 20 24.1 | 1 | 0.0068 | 12 15 20 | 1 | 0.0064 | 26.2 18 13 | 1 | 0.0067 | 13 39 30 | 1 | 0.0065 |
| 10 20 25.1 | 1 | 0.0068 | 12 15 22 | 1 | 0.0064 | 26.2 20 12 | 1 | 0.0067 | 14 31 32 | 1 | 0.0065 |
| 10 20 26.1 | 1 | 0.0068 | 12 16 19 | 2 | 0.0128 | 27 19 13 | 1 | 0.0067 | 14 32 28 | 2 | 0.0131 |
| 10 20 27.1 | 1 | 0.0068 | 12 16 20 | 1 | 0.0064 | 27.2 18 12 | 1 | 0.0067 | 14 32 29 | 1 | 0.0065 |
| 10 20.1 27.1 | 2 | 0.0135 | 12 16 21 | 1 | 0.0064 | 27.2 21 12 | 1 | 0.0067 | 14 32 31 | 1 | 0.0065 |
| 10 21 18 | 1 | 0.0068 | 12 17 17 | 2 | 0.0128 | 27.2 22 12 | 1 | 0.0067 | 14 33 26 | 1 | 0.0065 |
| 10 21 24.1 | 2 | 0.0135 | 12 17 18 | 1 | 0.0064 | 28 18 12 | 1 | 0.0067 | 14 33 29 | 4 | 0.0261 |
| 10 21 26.1 | 1 | 0.0068 | 12 17 19 | 2 | 0.0128 | 28 19 12 | 1 | 0.0067 | 14 34 25 | 1 | 0.0065 |
| 10 22 27.1 | 1 | 0.0068 | 12 17 21 | 1 | 0.0064 | 28 20 14 | 1 | 0.0067 | 14 34 26 | 3 | 0.0196 |
| 10 23 25.1 | 1 | 0.0068 | 12 18 19 | 1 | 0.0064 | 28.2 16 10 | 1 | 0.0067 | 14 34 28 | 1 | 0.0065 |
| 10 24 26.1 | 1 | 0.0068 | 12 18 20 | 2 | 0.0128 | 28.2 16 12 | 1 | 0.0067 | 14 34 29 | 1 | 0.0065 |
| 10 24 28.1 | 1 | 0.0068 | 12 18 21 | 2 | 0.0128 | 28.2 18 11 | 1 | 0.0067 | 14 34 30 | 2 | 0.0131 |
| 10 24 29.1 | 1 | 0.0068 | 12 19 18 | 1 | 0.0064 | 28.2 18 12 | 1 | 0.0067 | 14 34 31 | 1 | 0.0065 |
| 10 24.1 29.1 | 1 | 0.0068 | 12 19 22 | 1 | 0.0064 | 28.2 18 13 | 3 | 0.0201 | 14 34 41.2 | 2 | 0.0131 |
| 10 25 24.1 | 1 | 0.0068 | 12 7 17 | 1 | 0.0064 | 28.2 19 11 | 5 | 0.0336 | 14 34 44.2 | 1 | 0.0065 |
| 10 25 27.1 | 1 | 0.0068 | 12 7 18 | 1 | 0.0064 | 28.2 19 12 | 3 | 0.0201 | 14 35 24 | 1 | 0.0065 |
| 10 26 19 | 2 | 0.0135 | 12 7 19 | 1 | 0.0064 | 28.2 19 13 | 4 | 0.0268 | 14 35 25 | 3 | 0.0196 |
| 10 26 28.1 | 1 | 0.0068 | 12 7 20 | 1 | 0.0064 | 28.2 20 12 | 1 | 0.0067 | 14 35 26 | 1 | 0.0065 |
| 10 27 17 | 1 | 0.0068 | 12 8 18 | 2 | 0.0128 | 28.2 20 13 | 2 | 0.0134 | 14 35 27 | 1 | 0.0065 |
| 10 27 24.1 | 1 | 0.0068 | 12 8 19 | 1 | 0.0064 | 29 16 14 | 1 | 0.0067 | 14 35 28 | 3 | 0.0196 |
| 10 27 25.1 | 1 | 0.0068 | 12 8 20 | 1 | 0.0064 | 29 19 12 | 1 | 0.0067 | 14 35 29 | 1 | 0.0065 |
| 10 27 26.1 | 1 | 0.0068 | 12 9 18 | 1 | 0.0064 | 29.2 16 13 | 1 | 0.0067 | 14 35 30 | 3 | 0.0196 |
| 10 27 31.1 | 1 | 0.0068 | 13 11 22 | 1 | 0.0064 | 29.2 17 12 | 1 | 0.0067 | 14 35 31 | 2 | 0.0131 |
| 10 28 18 | 1 | 0.0068 | 13 12 20 | 1 | 0.0064 | 29.2 18 11 | 1 | 0.0067 | 14 35 34.2 | 1 | 0.0065 |
| 10 28 23 | 1 | 0.0068 | 13 14 19 | 1 | 0.0064 | 29.2 18 12 | 2 | 0.0134 | 14 35 37.2 | 1 | 0.0065 |
| 10 28 28.1 | 1 | 0.0068 | 13 15 17 | 1 | 0.0064 | 29.2 18 13 | 1 | 0.0067 | 14 35 43.2 | 1 | 0.0065 |
| 10 29 24.1 | 1 | 0.0068 | 13 15 18 | 1 | 0.0064 | 29.2 19 12 | 7 | 0.0470 | 14 35 44.2 | 1 | 0.0065 |
| 10 29 25.1 | 2 | 0.0135 | 13 15 19 | 2 | 0.0128 | 29.2 19 13 | 3 | 0.0201 | 14 35 47.2 | 1 | 0.0065 |
| 10 29 27.1 | 1 | 0.0068 | 13 15 20 | 1 | 0.0064 | 29.2 19 14 | 2 | 0.0134 | 14 36 26 | 1 | 0.0065 |
Table 6: Haplotype diversities of four X-Chromosomal linkage groups in Bahraini male individuals.
| LG1 Haplotype | Count | Frequency | LG2 Haplotype | Count | Frequency | LG3 Haplotype | Count | Frequency | LG4 Haplotype | Count | Frequency |
|---|---|---|---|---|---|---|---|---|---|---|---|
| 10 30 19 | 1 | 0.0068 | 13 15 22 | 1 | 0.0064 | 29.2 19 15 | 1 | 0.0067 | 14 36 27 | 1 | 0.0065 |
| 10 30 19 | 1 | 0.0068 | 13 15 22 | 1 | 0.0064 | 29.2 19 15 | 1 | 0.0067 | 14 36 27 | 1 | 0.0065 |
| 10 30 25.1 | 1 | 0.0068 | 13 16 15 | 1 | 0.0064 | 29.2 20 12 | 1 | 0.0067 | 14 36 28 | 2 | 0.0131 |
| 10 30 26.1 | 1 | 0.0068 | 13 16 18 | 1 | 0.0064 | 30 16 14 | 1 | 0.0067 | 14 36 29 | 2 | 0.0131 |
| 10 31 25.1 | 1 | 0.0068 | 13 16 20 | 1 | 0.0064 | 30 17 12 | 1 | 0.0067 | 14 36 30 | 1 | 0.0065 |
| 11 17 27 | 2 | 0.0135 | 13 16 21 | 1 | 0.0064 | 30 18 12 | 1 | 0.0067 | 14 36 37.2 | 1 | 0.0065 |
| 11 18 13.3 | 1 | 0.0068 | 13 17 19 | 1 | 0.0064 | 30 19 12 | 2 | 0.0134 | 14 36 42.2 | 2 | 0.0131 |
| 11 18 25.1 | 2 | 0.0135 | 13 17 20 | 1 | 0.0064 | 30 19 13 | 1 | 0.0067 | 14 36 43.2 | 1 | 0.0065 |
| 11 18.1 18 | 2 | 0.0135 | 13 17 21 | 3 | 0.0192 | 30 19 14 | 1 | 0.0067 | 14 36 45.2 | 1 | 0.0065 |
| 11 19 18 | 1 | 0.0068 | 13 17 22 | 1 | 0.0064 | 30.2 18 11 | 4 | 0.0268 | 14 37 27 | 1 | 0.0065 |
| 11 19 25.1 | 2 | 0.0135 | 13 17 23 | 1 | 0.0064 | 30.2 18 12 | 1 | 0.0067 | 14 37 28 | 1 | 0.0065 |
| 11 20 18 | 1 | 0.0068 | 13 18 15 | 1 | 0.0064 | 30.2 18 13 | 1 | 0.0067 | 14 37 29 | 3 | 0.0196 |
| 11 20 26.1 | 1 | 0.0068 | 13 18 18 | 1 | 0.0064 | 30.2 18 14 | 1 | 0.0067 | 14 37 30 | 1 | 0.0065 |
| 11 20.1 24.1 | 1 | 0.0068 | 13 18 19 | 3 | 0.0192 | 30.2 18 15 | 2 | 0.0134 | 14 37 42.2 | 1 | 0.0065 |
| 11 21 18 | 2 | 0.0135 | 13 18 20 | 2 | 0.0128 | 30.2 19 11 | 3 | 0.0201 | 14 37 46.2 | 1 | 0.0065 |
| 11 21 19 | 1 | 0.0068 | 13 18 21 | 1 | 0.0064 | 30.2 19 12 | 4 | 0.0268 | 14 37.2 29 | 1 | 0.0065 |
| 11 21 20 | 1 | 0.0068 | 13 18 22 | 1 | 0.0064 | 30.2 19 13 | 3 | 0.0201 | 14 38 28 | 1 | 0.0065 |
| 11 21 24.1 | 2 | 0.0135 | 13 19 17 | 1 | 0.0064 | 30.2 19 15 | 1 | 0.0067 | 14 38 46.2 | 1 | 0.0065 |
| 11 21 25.1 | 3 | 0.0203 | 13 19 21 | 1 | 0.0064 | 30.2 20 11 | 2 | 0.0134 | 14 38.3 26 | 1 | 0.0065 |
| 11 21 26.1 | 1 | 0.0068 | 13 19 22 | 1 | 0.0064 | 30.2 20 12 | 1 | 0.0067 | 14 39 28 | 2 | 0.0131 |
| 11 21 28.2 | 1 | 0.0068 | 13 8 17 | 1 | 0.0064 | 30.2 20 14 | 2 | 0.0134 | 14 39.3 31 | 1 | 0.0065 |
| 11 21 29.1 | 1 | 0.0068 | 13 8 18 | 1 | 0.0064 | 30.2 21 12 | 1 | 0.0067 | 14 41.3 27 | 1 | 0.0065 |
| 11 21.1 27.1 | 1 | 0.0068 | 13 8 20 | 1 | 0.0064 | 31 16 13 | 1 | 0.0067 | 14 42.3 27 | 1 | 0.0065 |
| 11 22 18 | 1 | 0.0068 | 13 8 21 | 1 | 0.0064 | 31 17 12 | 3 | 0.0201 | 15 30 30 | 1 | 0.0065 |
| 11 22 22 | 1 | 0.0068 | 13 8 22 | 1 | 0.0064 | 31 17 13 | 1 | 0.0067 | 15 33 28 | 1 | 0.0065 |
| 11 22 24.1 | 2 | 0.0135 | 14 13 22 | 1 | 0.0064 | 31 18 12 | 2 | 0.0134 | 15 33 29 | 2 | 0.0131 |
| 11 22 26.1 | 1 | 0.0068 | 14 15 20 | 1 | 0.0064 | 31 18 13 | 1 | 0.0067 | 15 33 31 | 1 | 0.0065 |
| 11 22 30 | 1 | 0.0068 | 14 16 16 | 1 | 0.0064 | 31 19 13 | 1 | 0.0067 | 15 33 43.2 | 1 | 0.0065 |
| 11 22.1 19 | 1 | 0.0068 | 14 16 18 | 1 | 0.0064 | 31 19 14 | 1 | 0.0067 | 15 34 28 | 2 | 0.0131 |
| 11 23 23 | 1 | 0.0068 | 14 16 19 | 3 | 0.0192 | 31 20 12 | 1 | 0.0067 | 15 34 29 | 1 | 0.0065 |
| 11 23 24.1 | 1 | 0.0068 | 14 16 20 | 1 | 0.0064 | 31 20 13 | 1 | 0.0067 | 15 34 40.2 | 1 | 0.0065 |
| 11 23 25.1 | 1 | 0.0068 | 14 16 22 | 2 | 0.0128 | 31.2 16 12 | 1 | 0.0067 | 15 35 25 | 2 | 0.0131 |
| 11 23 26.1 | 1 | 0.0068 | 14 17 18 | 1 | 0.0064 | 31.2 17 14 | 1 | 0.0067 | 15 35 26 | 1 | 0.0065 |
Table 7: Haplotype diversities of four X-Chromosomal linkage groups in Bahraini male individuals.
| LG1 Haplotype | Count | Frequency | LG2 Haplotype | Count | Frequency | LG3 Haplotype | Count | Frequency | LG4 Haplotype | Count | Frequency |
|---|---|---|---|---|---|---|---|---|---|---|---|
| 11 23 28 | 1 | 0.0068 | 14 17 19 | 4 | 0.0256 | 31.2 18 12 | 1 | 0.0067 | 15 35 28 | 1 | 0.0065 |
| 11 23.1 25.1 | 1 | 0.0068 | 14 17 21 | 1 | 0.0064 | 31.2 19 12 | 3 | 0.0201 | 15 35 31 | 1 | 0.0065 |
| 11 24 18 | 1 | 0.0068 | 14 18 17 | 1 | 0.0064 | 31.2 19 13 | 4 | 0.0268 | 15 35 34 | 1 | 0.0065 |
| 11 24 20 | 1 | 0.0068 | 14 18 18 | 2 | 0.0128 | 31.2 19 14 | 3 | 0.0201 | 15 35 39.2 | 1 | 0.0065 |
| 11 24 23.1 | 1 | 0.0068 | 14 18 19 | 2 | 0.0128 | 31.2 20 14 | 1 | 0.0067 | 15 35 43.2 | 1 | 0.0065 |
| 11 24 24.1 | 1 | 0.0068 | 14 18 20 | 2 | 0.0128 | 31.2 21 13 | 1 | 0.0067 | 15 35 44.2 | 1 | 0.0065 |
| 11 24 25.1 | 1 | 0.0068 | 14 18 22 | 1 | 0.0064 | 32 16 14 | 1 | 0.0067 | 15 36 24 | 1 | 0.0065 |
| 11 25 27.1 | 1 | 0.0068 | 14 19 18 | 2 | 0.0128 | 32 17 12 | 3 | 0.0201 | 15 36 26 | 1 | 0.0065 |
| 11 26 24.1 | 1 | 0.0068 | 14 19 22 | 1 | 0.0064 | 32 17 14 | 3 | 0.0201 | 15 36 28 | 3 | 0.0196 |
| 11 26 25.1 | 1 | 0.0068 | 14 20 20 | 1 | 0.0064 | 32 18 13 | 2 | 0.0134 | 15 36 29 | 2 | 0.0131 |
| 11 26.1 24 | 1 | 0.0068 | 14 20 22 | 1 | 0.0064 | 32 19 14 | 3 | 0.0201 | 15 36 30 | 1 | 0.0065 |
| 11 27 18 | 1 | 0.0068 | 14 7 17 | 1 | 0.0064 | 32 20 14 | 2 | 0.0134 | 15 36 40.2 | 3 | 0.0196 |
| 11 27 25.1 | 1 | 0.0068 | 14 7 20 | 4 | 0.0256 | 32.2 18 13 | 1 | 0.0067 | 15 36 46.2 | 1 | 0.0065 |
| 11 28 24.1 | 1 | 0.0068 | 14 8 18 | 1 | 0.0064 | 32.2 19 12 | 1 | 0.0067 | 15 37 26 | 2 | 0.0131 |
| 11 28 26.1 | 1 | 0.0068 | 14 8 19 | 3 | 0.0192 | 32.2 19 14 | 2 | 0.0134 | 15 37 27 | 4 | 0.0261 |
| 11 28 29.1 | 1 | 0.0068 | 14 8 20 | 1 | 0.0064 | 32.2 20 12 | 2 | 0.0134 | 15 37 28 | 1 | 0.0065 |
| 11 30 24.1 | 1 | 0.0068 | 14 8 21 | 1 | 0.0064 | 32.2 20 13 | 1 | 0.0067 | 15 37 29 | 2 | 0.0131 |
| 11 30 27.1 | 1 | 0.0068 | 15 13 19 | 1 | 0.0064 | 33 16 13 | 2 | 0.0134 | 15 37 39.2 | 1 | 0.0065 |
| 11 30 28.1 | 1 | 0.0068 | 15 14 17 | 1 | 0.0064 | 33 17 12 | 1 | 0.0067 | 15 37 47.2 | 1 | 0.0065 |
| 11 31 28.1 | 1 | 0.0068 | 15 14 20 | 2 | 0.0128 | 33 17 14 | 1 | 0.0067 | 15 38 27 | 2 | 0.0131 |
| 11 32 22 | 1 | 0.0068 | 15 15 18 | 1 | 0.0064 | 33 19 14 | 1 | 0.0067 | 15 38 29 | 1 | 0.0065 |
| 11 34 26.1 | 1 | 0.0068 | 15 16 18 | 1 | 0.0064 | 33 19 17 | 2 | 0.0134 | 15 38 34.2 | 1 | 0.0065 |
| 12 18 18 | 1 | 0.0068 | 15 16 19 | 1 | 0.0064 | 33.2 19 12 | 1 | 0.0067 | 15 38 39.2 | 1 | 0.0065 |
| 12 18 25 | 1 | 0.0068 | 15 17 16 | 1 | 0.0064 | 34 18 11 | 1 | 0.0067 | 15 39 27 | 1 | 0.0065 |
| 12 18 26.1 | 1 | 0.0068 | 15 17 17 | 1 | 0.0064 | 34 19 13 | 1 | 0.0067 | 15 39.3 30 | 1 | 0.0065 |
| 12 19 18 | 2 | 0.0135 | 15 17 19 | 2 | 0.0128 | 15 42.3 28 | 1 | 0.0065 | |||
| 12 19 20.1 | 1 | 0.0068 | 15 17 20 | 3 | 0.0192 | 16 33 27 | 1 | 0.0065 | |||
| 12 19 38.1 | 1 | 0.0068 | 15 17 21 | 2 | 0.0128 | 16 34 29 | 1 | 0.0065 | |||
| 12 19.1 28.1 | 1 | 0.0068 | 15 17 22 | 1 | 0.0064 | 16 34 30 | 1 | 0.0065 | |||
| 12 20 18 | 1 | 0.0068 | 15 18 17 | 1 | 0.0064 | 16 34 43.2 | 1 | 0.0065 | |||
| 12 20 24.1 | 2 | 0.0135 | 15 18 19 | 2 | 0.0128 | 16 35 29 | 2 | 0.0131 | |||
| 12 20 27.1 | 1 | 0.0068 | 15 18 20 | 1 | 0.0064 | 16 35 32 | 1 | 0.0065 |
Table 8: Haplotype diversities of four X-Chromosomal linkage groups in Bahraini male individuals.
| LG1 Haplotype | Count | Frequency | LG2 Haplotype | Count | Frequency | LG3 Haplotype | Count | Frequency | LG4 Haplotype | Count | Frequency |
|---|---|---|---|---|---|---|---|---|---|---|---|
| 12 20.1 18 | 1 | 0.0068 | 15 19 18 | 1 | 0.0064 | 16 35 38.2 | 1 | 0.0065 | |||
| 12 20.1 22.1 | 1 | 0.0068 | 15 19 19 | 1 | 0.0064 | 16 35 45.2 | 1 | 0.0065 | |||
| 12 21 26.1 | 1 | 0.0068 | 15 19 21 | 2 | 0.0128 | 16 36 26 | 1 | 0.0065 | |||
| 12 21 27.1 | 1 | 0.0068 | 15 7 17 | 1 | 0.0064 | 16 36 28 | 2 | 0.0131 | |||
| 12 21.1 18 | 1 | 0.0068 | 15 7 19 | 1 | 0.0064 | 16 36 29 | 2 | 0.0131 | |||
| 12 22 13.3 | 1 | 0.0068 | 15 7 22 | 1 | 0.0064 | 16 36 31 | 1 | 0.0065 | |||
| 12 22 24.1 | 1 | 0.0068 | 15 8 18 | 2 | 0.0128 | 16 37 25 | 1 | 0.0065 | |||
| 12 23 27.1 | 1 | 0.0068 | 15 8 19 | 4 | 0.0256 | 16 37 27 | 2 | 0.0131 | |||
| 12 24 27.1 | 1 | 0.0068 | 15 8 21 | 2 | 0.0128 | 16 37 29 | 1 | 0.0065 | |||
| 12 24 29 | 1 | 0.0068 | 16 15 18 | 1 | 0.0064 | 16 37 44.2 | 1 | 0.0065 | |||
| 12 25 26.1 | 2 | 0.0135 | 16 16 20 | 1 | 0.0064 | 17 32 44.2 | 1 | 0.0065 | |||
| 12 26 18 | 2 | 0.0135 | 16 18 17 | 2 | 0.0128 | 17 33 25 | 1 | 0.0065 | |||
| 12 26 24.1 | 1 | 0.0068 | 16 19 20 | 1 | 0.0064 | 17 34 43.2 | 2 | 0.0131 | |||
| 12 26 25.1 | 1 | 0.0068 | 16 20 17 | 2 | 0.0128 | 17 34 45.2 | 1 | 0.0065 | |||
| 12 26 27.1 | 1 | 0.0068 | 16 8 20 | 1 | 0.0064 | 17 41.3 40.2 | 1 | 0.0065 | |||
| 12 26 28.1 | 1 | 0.0068 | 16 8 21 | 1 | 0.0064 | ||||||
| 12 27 18 | 1 | 0.0068 | 17 15 20 | 1 | 0.0064 | ||||||
| 12 27 24.1 | 2 | 0.0135 | |||||||||
| 12 28 25.1 | 2 | 0.0135 | |||||||||
| 12 28 27.1 | 1 | 0.0068 | |||||||||
| 12 28 28.1 | 2 | 0.0135 | |||||||||
| 12 29 25.1 | 1 | 0.0068 | |||||||||
| 12 29 29.1 | 1 | 0.0068 | |||||||||
| 12 30 18 | 1 | 0.0068 | |||||||||
| 12 30 21 | 1 | 0.0068 | |||||||||
| 12 30 25.1 | 1 | 0.0068 | |||||||||
| 12 30 26.1 | 1 | 0.0068 | |||||||||
| 12 33 22.1 | 1 | 0.0068 | |||||||||
| 12 33 26.1 | 1 | 0.0068 | |||||||||
| 13 23 18 | 1 | 0.0068 |
Table 9: Haplotype diversities of four X-Chromosomal linkage groups in Bahraini male individuals.
Rare Variants, Off-ladder and Null Alleles: Several cases showed off ladder (OL) in various loci; two allelic ladder variants were detected at the DXS10146; Sample#12 indicated OL in 223.05 bp and sample#34 showed OL in 243.87 bp. Four allelic ladder variants were detected at DXS10148; Sample#29 showed OL in 312.62 bp, sample#49 and sample#50 showed OL in 312.57, and sample#123 showed OL in 280.19 bp. One allelic ladder variants were detected with OL in DXS10134; Sample#72 showed OL with 325.61 bp. Null alleles were also observed in two loci; DXS10148 in sample#105 and in DXS10103 showed drop out allele in sample#135 and sample#119 (Figure 1).
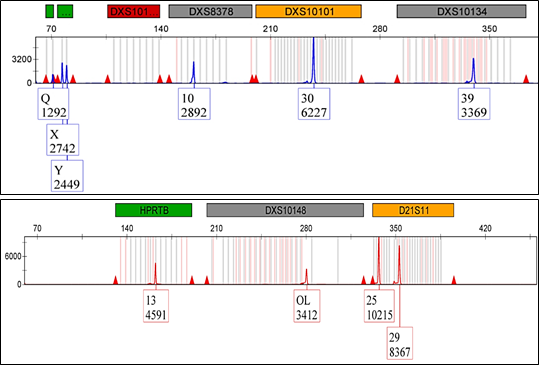
High frequent cases of non-standard ladders (OL) and null alleles were at DXS10148, which gave an indication that the Investigator Argus X-12 QS kit provided standard ladder which lacked significant coverage of bins at DXS10148 as it was confirmed in previous literature [17].
More than half of the samples (103/156) showed 0.1 variant in DXS10148 and 18 samples gave the same variant in DXS10135.
More than half of the samples (102/156) also showed 0.2 variant in DXS10101, 39 samples in DXS10146, one sample in DXS10134 and one in DXS10148. As for 0.3 variant; 9 samples were detected in DXS10134 and 3 samples in DXS10148.
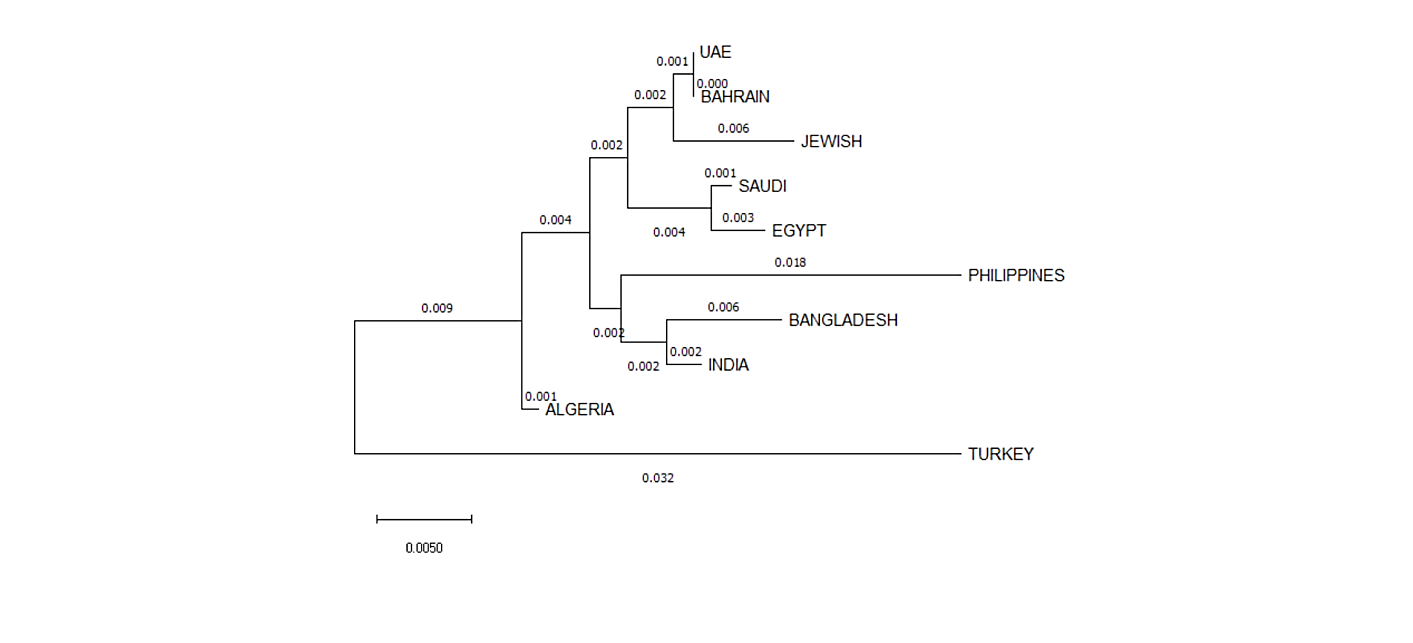
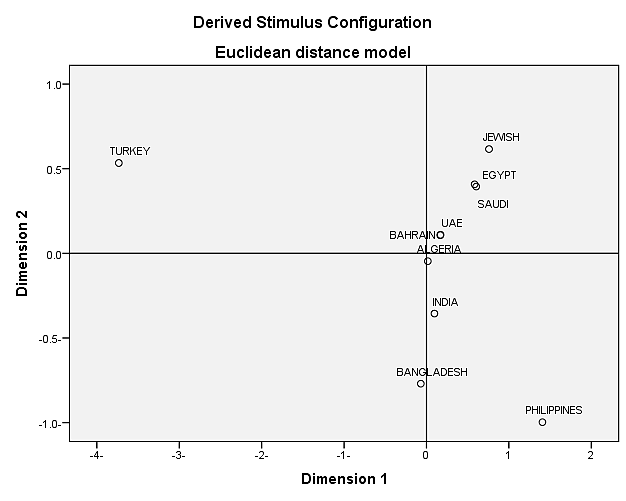
Interpopulation Diversity: To measure the diversity between Bahraini population and other populations previously reported, we have constructed the phylogenetic tree from allelic frequencies data by using the neighbor- joining (NJ) method via MEGA X: Molecular Evolutionary Genetics Analysis (Figure 2).
We have used 9 populations including: Saudi [15], Filipino [16], Emiratis [17], Bengali [18], Egyptian [19], Turkish [20], Indian [21], Algerian [22] and Jewish [23]. Fst and p-values for allele frequency distribution between Bahraini population and the published groups are shown in (Table 10). It is shown that Bahraini and Emirati populations shared the most genetic relatedness than other populations, as the Saudi population considers being the most geographically close population, however gave more genetic relatedness with Egyptian population than with Bahraini population. The rest of populations stood distant of genetic association with the Bahraini population. We have also constructed the MDS plot using IBM SPSS Statistics v21.0 Software, and it gave correlating results with the phylogenetic tree. As Bahraini, Emirati and Algerian populations gave the same clusters and Saudi, Egyptian and Jewish in another cluster (Figure 3).
| Saudi | Emirati | Egyptian | Turkish | Algerian | Jewish | Filipino | Bengali | Indian | Bahraini | |
|---|---|---|---|---|---|---|---|---|---|---|
| Saudi | 0 | 0.001 | 0.003 | 0.032 | 0.001 | 0.007 | 0.018 | 0.006 | 0.002 | 0.001 |
| Emirati | 0.009 | 0 | 0.004 | 0.002 | 0.002 | 0.002 | 0.002 | 0.002 | 0.002 | 0.003 |
| Egyptian | 0.004 | 0.011 | 0 | 0.009 | 0.003 | 0.004 | 0.002 | 0.004 | 0.004 | 0.012 |
| Turkish | 0.052 | 0.048 | 0.055 | 0 | 0.009 | 0.002 | 0.002 | 0.003 | 0.003 | 0.006 |
| Algerian | 0.013 | 0.01 | 0.015 | 0.042 | 0 | 0.003 | 0.018 | 0.002 | 0.002 | 0.006 |
| Jewish | 0.012 | 0.008 | 0.017 | 0.059 | 0.013 | 0 | 0.002 | 0.002 | 0.002 | 0.002 |
| Filipino | 0.023 | 0.025 | 0.027 | 0.066 | 0.027 | 0.03 | 0 | 0.002 | 0.002 | 0 |
| Bengali | 0.022 | 0.013 | 0.02 | 0.051 | 0.008 | 0.024 | 0.029 | 0 | 0.002 | 0.041 |
| Indian | 0.017 | 0.009 | 0.014 | 0.05 | 0.013 | 0.019 | 0.02 | 0.008 | 0 | 0.018 |
| Bahraini | 0.009 | 0 | 0.012 | 0.051 | 0.012 | 0.007 | 0.027 | 0.016 | 0.012 | 0 |
Table 10: Nei genetic distance matrix between Bahraini population and other populations. Above the diagonal are p values while bel
Discussion
The observed deviation from LD (neglecting the Bonferroni’s correction) could be a result of the high diversity of the Bahraini population or caused by high polymorphism at the same loci investigated loci. This observation are likely to reflect the high level of inbreeding with consanguinity rates in Bahrain, with intra-familial unions accounting for 20–50% of all marriages compared to other Arab countries [27]. The PD in correlation with PM supports the high degree of polymorphism between Bahraini individuals.
As shown the significance of LD provided of loci in different LGs, suggesting of using individual allele frequency as well as haplotype allele frequencies for population database and likelihood studies.
We have compared Bahraini population data with other populations according to the available data using the accessible loci (Table S2).
It is shown that the Bahraini population shares similar results with the study conducted of Emirati populations using the X-STRs loci. Allele 14 in locus DXS7423 scored the highest frequency for Bahraini, Emirati, Egyptian and Indians populations [17, 19, 21] whereas allele 15 in same locus were the highest frequency for Filipino and Algerian populations [16, 22]. Turkish population gave the highest allele frequency in allele 13 (HPRTB) [20]. Jewish and the Saudi populations shared the highest frequency with allele 19 (DXS10103) [15, 23]. Bengali population showed the highest allele frequency in allele 11(DXS8378) [18].
Regarding the Interpopulation diversity, the phylogenetic tree was constructed based upon the data from the nine populations which were consistent with other population data from the region based upon the Fst values obtained. The obtained Fst value of Bahrain is <0.0000 which is less than the recommended value for casework statistics of Fst < 0.01 [28].
As shown, Bahraini and Emirati populations were more genetically related in terms of phylogenetic tree and MDS plot in contrary of Saudi population which was shown in previous papers published being more genetically related to Bahrain [4, 5]. This can be explained by studying the origins of the mothers of participants as it wildly affects the X-STRs results.
Once more studies of Arab populations in the region become accessible, it may be more probable to develop a greater understanding of the genetic associations between the different populations for the Arabian Peninsula. Further linkage studies must be conducted to determine if the loci are physically linked.
Conclusion
In conclusion, this is first study to report the allele frequencies and forensic statistical parameters of the X chromosomal STRs included in the Investigator Argus X-12 QS Kit in a sample population of Bahrain. X-STRs panels can be used for some cases for forensics investigations such as human identification and paternity testing.
It is shown that X-STRs included in the Investigator Argus X-12 kit can be utilized for forensic practice in Bahraini population. Our results demonstrate the importance of analyzing diverse populations using X-STRs markers.
Conflict of Interest
The authors declare that they have no conflict of interest
Acknowledgment
We would like to thank the authorities in General Directorate of Criminal Investigation and forensic Science in Bahrain, namely Mr. Abdulaziz Mayoof Alrumaihi, Mr. Raed Ali Almaeeli and Mr. Mohammed Abdulla Ghayyath for allowing us to utilize the Bahrain forensic Science Laboratory. Also, many thanks to Sabah Nazir and Meshael Ahmed Alqerainees for their technical support. This research did not receive any specific grant from funding agencies in the public, commercial, or not-for-profit sectors.
References
-
Edelmann J, Lutz-Bonengel S, Naue J, Hering S (2012) X-chromosomal haplotype frequencies of four linkage groups using the Investigator Argus X-12 Kit. Forensic Sci Int Genet 6(1): e24-e34.
-
Kling D, Dell’Amico B, Haddeland PJ, Tillmar AO (2014) Population genetic analysis of 12 X-STRs in a Somali population sample. Forensic Sci Int Genet 11: e7-e8.
-
Nothnagel M, Szibor R, Vollrath O, Augustin C, Edelmann J, et al. (2012) Collaborative genetic mapping of 12 forensic short tandem repeat (STR) loci on the human X chromosome. Forensic Sci Int Genet 6(6): 778- 784.
-
Al-Snan NR, Messaoudi S, R Babu S, Bakhiet M (2019) Population genetic data of the 21 autosomal STRs included in GlobalFiler kit of a population sample from the Kingdom of Bahrain. PLoS One 14(8): e0220620.
-
Al-Snan NR, Messaoudi SA, Khubrani YM, Wetton JH, Jobling MA, et al. (2019) Genetic Variation At 27 Y-STRs In Four Regions Of Bahrain. bioRxiv 787341.
-
CIO (2015) The estimates of population growth are based on the results of 2010 census and on the population register’s records.
-
Abdulla MAZa-A, Bashir (2009) Modern History of Bahrain (1500–2002). Bahrain: Historical Studies Centre, University of Bahrain.
-
Lawson FH (1989) Bahrain: The modernization of autocracy. 1st(Edn.), Westview Press, USA, pp: 146.
-
Khuri FI (1980) Tribe and state in Bahrain: The transformation of social and political authority in an Arab state: University of Chicago press, USA.
-
Fuccaro N (2009) Histories of city and state in the Persian Gulf: Manama since 1800: Cambridge University Press, UK.
-
P Bearman, Th Bianquis, CE Bosworth, E van Donzel, WP Heinrichs (2014) Encyclopaedia of Islam, 2nd (Edn), Brill Publishers, Netherlands.
-
Guo F (2017) Population genetic data for 12 X-STR loci in the Northern Han Chinese and StatsX package as tools for population statistics on X-STR. Sci Int Genet 26: e1- e8.
-
Gouy A, Zieger M (2017) STRAF—A convenient online tool for STR data evaluation in forensic genetics. Forensic Sci Int Genet 30: 148-51.
-
ChrX-STR.org 2.0.
-
Messaoudi SA, Babu SR, Alsaleh AB, Albajjah M, AlSnan N (2019) Genetic diversity and haplotypic structure of a Saudi population sample using Investigator Argus X-12 amplification kit. bioRxiv, pp: 1-18.
-
Salvador JM, Apaga DLT, Delfin FC, Calacal GC, Dennis SE, et al. (2018) Filipino DNA variation at 12 X-chromosome short tandem repeat markers. Forensic Sci Int Genet 36: e8-e12.
-
Almarri MA, Lootah RA (2018) Allelic and haplotype diversity of 12 X-STRs in the United Arab Emirates. Forensic Sci Int Genet 33: e4-e6.
-
Sufian A, Hosen MI, Fatema K, Hossain T, Hasan MM, et al. (2017) Genetic diversity study on 12 X-STR loci of investigator® Argus X STR kit in Bangladeshi population. Int J Legal Med 131(4): 963-965.
-
Elakkary S, Hoffmeister-Ullerich S, Schulze C, Seif E, Sheta A, et al. (2014) Genetic polymorphisms of twelve X-STRs of the investigator Argus X-12 kit and additional six X-STR centromere region loci in an Egyptian population sample. Forensic Sci Int Genet 11: 26-30.
-
Poulsen L, Tomas C, Drobnič K, Ivanova V, Mogensen HS, Kondili A, et al. (2016) NGMSElect™ and Investigator® Argus X-12 analysis in population samples from Albania, Iraq, Lithuania, Slovenia, and Turkey. Forensic Sci Int Genet 22: 110-112.
-
Shrivastava P, Jain T, Gupta U, Trivedi VB (2015) Genetic polymorphism study on 12 X STR loci of investigator Argus X STR kit in Bhil tribal population of Madhya Pradesh, India. Leg Med (Tokyo) 17(3): 214-217.
-
Tomas C, Pereira V, Morling N (2012) Analysis of 12 X-STRs in greenlanders, danes and somalis using argus X-12. Int J Legal Med 126(1): 121-128.
-
Ferragut J, Castro J, Ramon C, Picornell A (2015) Genetic diversity of 12 X-chromosomal short tandem repeats in Jewish populations. Forensic Science International: Genetics Supplement Series 5: e327-e9.
-
Takezaki N, Nei M, Tamura K (2010) POPTREE2: Software for constructing population trees from allele frequency data and computing other population statistics with Windows interface. Mol Biol Evol 27(4): 747-752.
-
Saitou N, Nei M (1987) The neighbor-joining method: a new method for reconstructing phylogenetic trees. Mol Biol Evol 4(4): 406-425.
-
Kumar S, Stecher G, Li M, Knyaz C, Tamura K (2018) MEGA X: molecular evolutionary genetics analysis across computing platforms. Mol Biol Evol 35(6): 1547-1549.
-
Al-Arrayed S, Hamamy H (2012) The changing profile of consanguinity rates in Bahrain, 1990–2009. Journal of biosocial science 44(3): 313-319.
-
Council NR (1996) The Evaluation of Forensic DNA Evidence. Washington, DC: The National Academies Press, pp: 272.
- Narcotics and Digital Forensics: Bridging Crimes in the Digital Age
- Ethics in Forensic Psychiatry: Principles, Dilemmas, and Human Rights
- Impact of Acute Stress on Attentional Orienting to Social Cues
- Head Injury and Intracranial Hemorrhage in Western Region of Libya
- A Forensic Study on Handedness: Examination of Handwriting Features in Right and Left Handed Writers
- Techniques for Latent Fingerprint Development Using Natural and Synthetic Powders: A Review