Development of Regression Analysis for Determination of Irbesartan in Pharmaceutical Tablets using Fourier Transform Infrared Spectrophotometry
A simple, cost-effective, fast and non-destructive analytical method was developed for the quantification of irbesartan in tablets using Fourier Transform Infrared (FT-IR) spectroscopy. The FTIR quantification of irbesartan in tablets was performed using two chemometric approaches, partial least squares (PLS) and principal component regression (PCR) methods. To compare the predictive ability of these models, the standard errors of prediction (SEP) were calculated. SEP error values in the range of 0.941–1.62% for calibration and validation data sets were obtained for the twoprocedures applied. A successful quantification of irbesartan in tablets containing 150 mg active ingredient/tablet was performed using the PLS model, with good recovery. The proposed procedure can be a fast, precise and convenient method of irbesartan quantification in commercial tablets.
Introduction
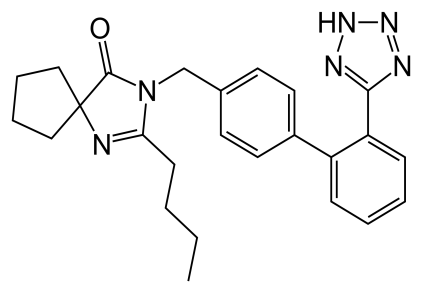
Irbesartan (2-butyl-3-[p-(o-1H-tetrazol-5- ylphenyl)benzyl]-1,3-diazaspiro [4.4] non-1-en-4-one) [1], Figure 1, is belongs to non-peptide, orally active angiotensin-II receptor antagonists (ARAs II) used in the treatment of hypertension, congestive heart failure, and chronic renal failure [2, 3].
Medicinal & Analytical Chemistry International Journal
According to the literature, many methods have been used to determine this active pharmaceutical ingredient (API). By using UV- spectrophotometry [4, 5, 6, 7, 8, 9, 10] the manipulation is simple, the sensitivity is low. VS- Spectrophotometric and spectrofluorimetric [6, 11] methods, have high sensitivity, but cumbersome, time- consuming manipulation and poor repeatability. Capillary electrophoresis [12], LC-MS [13, 14, 15, 16], HPTLC and HPLC [17, 18, 19, 20, 21, 22, 23, 24, 25, 26, 27] methods need costly apparatus and harmful organic solvents. Polarographic methods [28, 29, 30] need to use a lot of metal mercury which harms human health. For the past two decades, Fourier Transform Infrared spectroscopy has undergone significant application in the pharmaceutical analysis field [31, 32] due to its main advantages of an easy sample preparation with reduced or no pre-processing steps and the prediction of chemical and physical sample parameters from a single spectrum based on the use of multivariate calibration. Determination of API with FTIR spectrometry provides an enormous amount of spectroscopic information about a sample. Chemometric methods, such as principal component regression (PCR) and partial least squares (PLS) analysis are commonly used to extract the specific information relevant to the analyte of interest from the full spectrum.To develop a good regression model, the PCR andPLS regression were evaluated; the model with the optimal performance in terms of predictive results based on the lowest Root Mean Square Error (RMSE) was chosen. To enhance the predictive ability of each developed model, different data pre-processing methods, i.e. centering, normalization, Standard Normal Variate (SNV), derivative and Kennard Stone data partitioning algorithm, were tested on the FTIR spectra dataset. They were found to greatly affect the outcome of the data analysis. The main objective of the present study was the development of a rapid, cheap analytical method for the determination of irbesartan in tablet formulation for routine quality control analysis, based on FT-IR spectroscopy.
Experimental
Reagents and Samples
Pure Irbesartan (Certified to contain 100.1% w/w) was kindly provided by Medical Union Pharmaceuticals, Abu-sultan, Ismailia, Egypt. Dichloromethane (CH2Cl2) HPLC grade was purchased from Merck, Darmstadt, Germany. X-TENSION® tab (Marcyrl Company, Egypt) Aprovel® tab (Sanofi-Aventis Egypt), each tablet was labeled to contain 150mg irbesartan.
Standard Solutions
A 4.0 mgmL-1 irbesartan stock solution was prepared in CH2Cl2, the stock solution was kept protected from light using amber colored flask and refrigerated. Working standard solutions were freshly obtained by diluting the stock standard solution with CH2Cl2 during the analysis day.
Apparatus and Software
A Varian 640 FTIR spectrophotometer (Varian Inc., Palo Alto, CA, USA was employed for FTIR spectra acquisition. A demountable liquid cell (Pike Technologies) consisted of two KBr windows (32 mm in diameter, 3 mm thick) separated by a Teflon spacer. To minimize water vapor and CO2 interferences, the system was continuously purged with dry nitrogen. Acquisition time for each spectrum was less than two minutes for both background and spectral measurements. The sample was introduced into the cell by filling ports using a 3 mL syringe. The chemometric analysis (PCA, PCR and PLS) were performed using Unscrambler X version 10.3.0 (CAMO Software AS, Oslo, Norway).
Recommended Procedures
Standard irbesartan samples (n= 31) were scanned from 400-4000 cm-1 at resolution of 32 cm-1and averaging 18 accumulated scans per spectrum. A background spectrum of CH2Cl2 was measured for each sample; this was used as the background signal subtracted from each sample signal.
Multivariate Data Analysis Methods
PCA was performed on all spectra using all the samples to search for outliers and to determine the optimal regions to use in developing the calibration models. After detection and removal of outliers, the spectra of all samples were divided into 2 groups used for setting up the calibration model and external validation set. The selection of the data for calibration was done by Kennard Stone algorithm [33]. The performance of PCR/PLSR was evaluated for the calibration set by calculating the root mean-squared error of calibration (RMSEC) and the root-mean- squared error of cross validation (RMSECV) were computed by the same software and used as indicators of calibration performance. The calibration models were then tested using the validation set. The root-mean-squared error of prediction (RMSEP) and coefficient of determination (R2) were calculated as outlined in the literature [34].
Medicinal & Analytical Chemistry International Journal
For this study, PCR/PLSR models building was an iterative procedure that involved changing the degree of data pre-processing, e.g., standardization, normalization and derivatives, until the best PCR/PLS models were attained. The final models were chosen based on (1) its ability to minimize the number of PCs required to model the data, (2) optimize the R2 statistics, and (3) minimize the RMSEC and RMSEP.
Results and Discussion
Spectral Analysis of Irbesartan
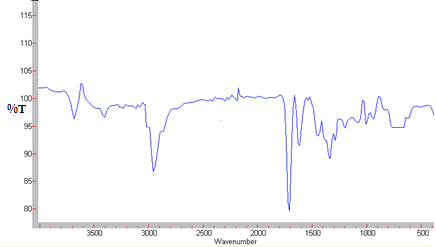
Figure 2 shows the FTIR spectra of 400 µg/mL irbesartan in CH2Cl2, in the wavenumber region from 400-4000 cm-1.
![Figure 2: FTIR spectra of pure irbesartan in CH2Cl2. The characteristic peak observed at 3412 cm-1 was due to NH stretching vibrations [1]. Peaks observed at 2870-3000 cm-1 was attributed to asymmetric and symmetric CH stretching modes. Peaks observed at 1717 and 1617cm-1 were due to C=O and C=N stretching [35].](/fulltextimages/999/fig_2.jpeg)
Effect of Measurement Conditions
The effects of the spectral resolution and the number of accumulated scans per spectrum on the signal intensity were evaluated in order to select the most appropriate conditions. With this purpose, optimal response surface experiment with two factors (the resolution and the accumulated scans per spectrum) and single response (peak height values at 1717cm-1) was performed. An optimal response surface experiment with 17 runs was constructed using Design- Expert® 8.0.7.1 (Stat-Ease Inc., Minneapolis). Desirability function approach was used to get the best conditions, Figure 3 shows, the 3-D plots of the desirability function results, from which the highest results were obtained with resolution of 32 and 18 accumulated scans per spectrum.
Detection of Outliers
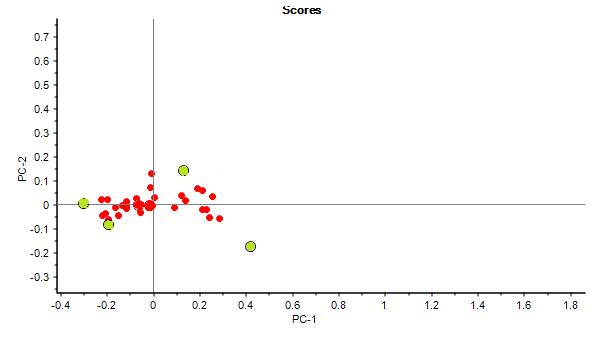
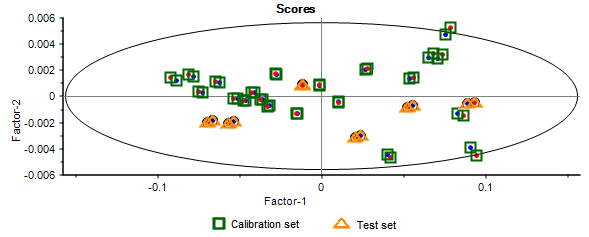
A PCA was performed on the FTIR data set (n=31) which enabled to detect 4 spectral outliers in the data (Figure 4, green color filled circles) of irbesartan. The absorbance spectra of these (spectral outlier) samples were excluded from the PCR and PLS analysis performed to develop a final calibration model (as described next).
Selection of Significant Frequency Regions
The selection of the significant frequency regions in FTIR analysis is very difficult because the chosen regions must be describing the most characteristics analytes to be determined and to provide non- interfered data for the analytes [36]. PCA allows to explore, in an efficient way, the spectra in the full range Medicinal & Analytical Chemistry International Journal
(4000–400 cm-1) and to identify the most significant regions.
Figure 5 represent PCA-loadings plot of spectra of irbesartan samples shows that the most important regions were 1218-1527, 1542-1666, 1666-1835, and 2792-3039 cm-1.
![Figure 5: A PCA-loadings plot performed on the 400-4000 cm-1 range of FTIR spectra of irbesartan In other way, PLS can be used for selection of the best frequency region from the important regions [37], as the proper frequency region must be has highest value of coefficient of determination (R2) and lowest value of root mean standard error of calibration (RMSEC). The most important region is from 1666 and 1835 with R2 value of 0.9994 and 0.5372 RMSEC, Table 1.](/fulltextimages/999/fig_5.png)
Figure 5: A PCA-loadings plot performed on the 400-4000 cm-1 range of FTIR spectra of irbesartan In other way, PLS can be used for selection of the best frequency region from the important regions [37], as the proper frequency region must be has highest value of coefficient of determination (R2) and lowest value of root mean standard error of calibration (RMSEC). The most important region is from 1666 and 1835 with R2 value of 0.9994 and 0.5372 RMSEC, Table 1.
| Spectral region | R2 | Q2 | ||||||||||||
| RMSEC | R | MSEC | V | |||||||||||
| cm-1 | value | value | ||||||||||||
| 1218-1527 | 0.9991 | 0.6541 | 0.7653 | 0.9988 | ||||||||||
| 1542-1666 | 0.9994 | 0.5423 | 0.6375 | 0.9992 | ||||||||||
| 1666-1835 | 0.9994 | 0.5372 | 0.5781 | 0.9993 | ||||||||||
| 2792-3039 | 0.9978 | 1.02 | 1.13 | 0.9975 | ||||||||||
| 1542-1835 | 0.9984 | 0.858 | 0.927 | 0.9983 |
Table 1: PLSR analysis of irbesartan spectra using regions which selected by PCA and its combinations.
Data pre-processing
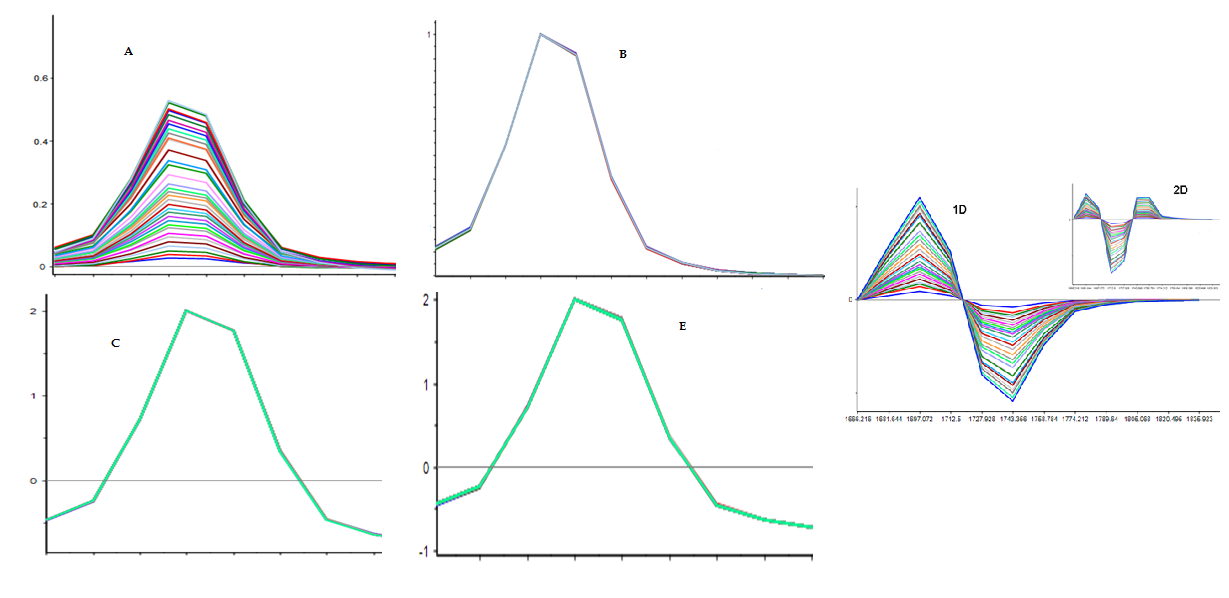
The development of useful models requires both appropriate methods (PLSR, PCR etc.) and high quality data. In many situations, choice of data is limited due to the specific physicochemical properties of the samples, the availability of instruments, and so on. However, the data quality could be improved by appropriate pre- processing methods. Although it is common for pre- processing methods to be used before multivariate modelling, there is no set standard approach and the results of multivariate analysis are affected by the methods used. This also means that data pre-processing is often revisited to ascertain optimal solutions before performing any computational analysis. In the methods below, both normalization, and Standard Normal Variate (SNV), was first performed separately and then together to evaluate their effect. Another way to correct instrumentation errors that was investigated was to calculate the first and second derivative of all spectra to compare results to the results of normalization and standardization (Figure 6).These three methods of pre-processing were tested in quantitative analysis as performance of pre- processing method is not easy to analyze prior to modeling [38]. Standard normal variates (SNV) which involve centering the data and scaling at the same time to give a correlation of the samples in the dataset. Comparing the SNV plot to the plot of the normalized spectra in Figure
Medicinal & Analytical Chemistry International Journal
6. It is obvious that SNV gives tighter groupings of the measurements and a better attempt at peak separation. In fact, SNV has been shown to do better with infrared spectroscopic data of this sort; however, Normalization (range scaling) also keeps the data close to their original form as opposed to SNV, but SNV centered the data better than Normalization.
Data Selection Scheme
From the ‘X’ and ‘Y’ matrices of the calibration set of irbesartan in CH2Cl2, 20 spectra were used to develop the calibration models, and 7 spectra were used for validation set. Kennard Stone algorithm (KS) did this selection [33]. KS is a well-known method for the selection of a sample subset for calibration. It chooses objects that are uniformly distributed in the X-matrix by assigning a sample to the calibration set, closest to the mean of the entire sample; the next sample is then chosen based on the square distance to the sample already assigned [39]. The sample furthest from the already selected sample is added to the calibration set, etc. In this way, variations of the dataset are chosen up front. The algorithm was set to select 20 standards representing the dataset, with the rest left for validation. The calibration modelwas constructed and subsequently validated. Figure 7 represent the KS selections split into calibration set and test set.
Medicinal & Analytical Chemistry International Journal
PLS and PCR Modeling
For our data calibration, PLS and PCR cross- validation were plotted for comparison. These plots are shown in Figure 8. The plot suggest that as few as 2 PCR/PLS components may be adequate to interpret the information in the predictor (X) which is related to the response (Y).
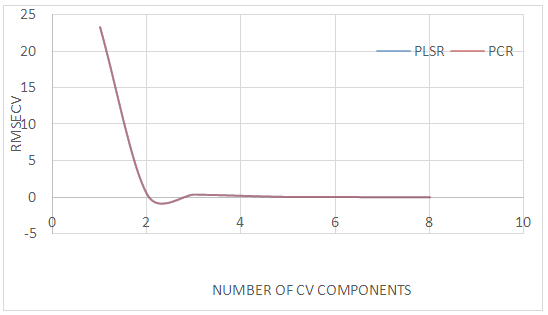
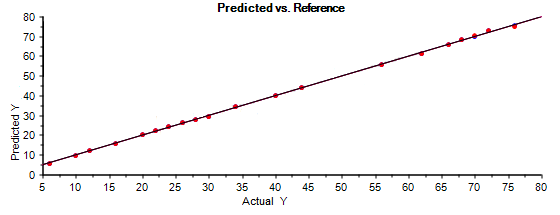
Figure 8: Plot of RMSECV versus number of components for a calibration set prediction using cross-validation of PLSR/PCR for irbesartan. As the object of this comparison is to show the difference in fitting between PLSR and PCR with similar components, this was done using selected spectral regions for irbesartan and pre-processed as described before. The values of R2 together with RMSEC were used for calibration criteria. PLS with normalized spectra was selected because it produced the lowest RMSEC (0.360) and highest R2 value (0.9998) which after cross-validation, gave an RMSECV value of 0.447 with only 2 components. The RMSEP of the test set was 1.03 with an R2 of 0.9973. Figure 9 shows the predicted vs actual plots for irbesartan calibration from the selected region of the FTIR spectra using the same method. Table 2 summarizes PCR/PLSR model results for irbesartan for the different pre-processing methods when using the selected spectral ranges. Among the different transformation methods, the best PLSR model result is indicated for models based on spectra combined with normalization.
| Method | Pre-processing | NO. component | RMSEC | R² | RMSECV | Q² |
| PLS | Norm | PC2 | 0.36 | 0.9998 | 0.447 | 0.9996 |
| PCR | Norm | PC2 | 0.37 | 0.9997 | 0.457 | 0.9996 |
| PLS | SNV | PC2 | 0.383 | 0.9997 | 0.462 | 0.9996 |
| PCR | SNV | PC2 | 0.385 | 0.9997 | 0.463 | 0.9995 |
| PLS | Norm+SNV | PC2 | 0.383 | 0.9997 | 0.461 | 0.9996 |
| PCR | Norm+SNV | PC2 | 0.385 | 0.9997 | 0.463 | 0.9996 |
| PLS | 1st D | PC2 | 0.653 | 0.9991 | 0.77 | 0.9986 |
| PCR | 1st D | PC2 | 0.655 | 0.9991 | 0.772 | 0.9979 |
| PLS | 2nd D | PC2 | 0.534 | 0.9994 | 0.635 | 0.9992 |
| PCR | 2nd D | PC2 | 0.542 | 0.9994 | 0.645 | 0.992 |
Table 2: Results for PCR and PLSR methods on preprocessed spectra of irbesartan.
Validation of the Method
The validation based on traditional chemometric parameters such as Q2 and RMSEP is insufficient towards pharmaceutical regulatory requirements [40]. So the selected model was validated in accordance with the International Conference on Harmonisation ICH using parameters usually recommended: accuracy, precision and linearity. A straight line calibration was obtained by plotting of FTIR predicted values by PLS model versus reference values. Table 3 presents the performance data and statistical parameters including linear regression Medicinal & Analytical Chemistry International Journal
equations, concentration ranges, correlation coefficients and slope. Intra-day accuracy ranged from 99.16 to 99.70 for irbesartan, while inter-day accuracy ranged from 99.57 to 99.62.
Intra-day precision (repeatability) ranged from 0.17 to 1.09, while inter-day precision (intermediate precision) ranged from 0.22 to 0.73, as shown in Table 4 The small values of RSD % indicate high precision of the method.
| Method | Range μg/mL | r | Pre-processing | Intercept | Slope | SEP | RMSEP | R² |
| PLS | 6.0-76.0 | 0.9999 | Norm | 0.004 | 0.9997 | 0.941 | 1.03 | 0.9973 |
| PCR | 6.0-76.0 | 0.9999 | Norm | 0.004 | 0.9997 | 0.941 | 1.13 | 0.9963 |
| PLS | 6.0-76.0 | 0.9999 | SNV | 0.006 | 0.9997 | 0.968 | 1.07 | 0.9971 |
| PCR | 6.0-76.0 | 0.9999 | SNV | 0.006 | 0.9997 | 0.968 | 1.27 | 0.9951 |
| PLS | 6.0-76.0 | 0.9999 | Norm+SNV | 0.006 | 0.9997 | 0.968 | 1.07 | 0.9971 |
| PCR | 6.0-76.0 | 0.9999 | Norm+SNV | 0.006 | 0.9997 | 0.968 | 1.17 | 0.9961 |
| PLS | 6.0-76.0 | 0.9996 | 1st D | 0.026 | 0.9991 | 1.31 | 1.45 | 0.9948 |
| PCR | 6.0-76.0 | 0.9996 | 1st D | 0.0282 | 0.9992 | 1.62 | 1.48 | 0.9958 |
| PLS | 6.0-76.0 | 0.9997 | 2nd D | 0.017 | 0.9994 | 1.2 | 1.31 | 0.9957 |
| PCR | 6.0-76.0 | 0.9997 | 2nd D | 0.019 | 0.9994 | 1.21 | 1.33 | 0.9956 |
Table 3: Mathematical modeling for calibration of irbesartan by FTIR method using PLS and PCR.
| Concentration (µg/mL) | Intra-day precision | Inter-day precision | |||||
|---|---|---|---|---|---|---|---|
| Found (Conc.±SD) | Accuracy (R%) | Precision (RSD%) | Found (Conc.±SD) | Accuracy (R%) | Precision (RSD%) | ||
| IRS | 10 | 9.96±0.054 | 99.63 | 0.55 | 9.96±0.048 | 99.61 | 0.49 |
| IRS | 40 | 39.66±0.066 | 99.16 | 0.17 | 39.84±0.289 | 99.62 | 0.73 |
| IRS | 70 | 69.79±0.75 | 99.7 | 1.09 | 69.70±0.155 | 99.57 | 0.22 |
Table 4: Inter-day and intra-day precision and accuracy for captopril and irbesartan using PLS (normal) method.
Analysis of Pharmaceutical Tablets
Ten tablets of each pharmaceutical were weighed, separately, finely powdered. An accurately weighed quantity of drug powder (equivalent to 150 mg of irbesartan) was dissolved, separately, in 80 mL of CH2Cl2, and was sonicated for 20 min. after cooling, the flasks were filtered through a 0.45-µm (Nylon 66- membrane) filter into 100 mL volumetric flask and made up to the mark with CH2Cl2 to obtain a concentration of irbesartan as 1.5 mgmL-1, respectively.
The resulted solution was diluted with CH2Cl2 to produce the desired concentrations. Five replicates determination were made and satisfactory results were obtained in agreement with the label claim, where no interference from excipients and additives was observed as shown in Table 5. The results were compared with reported methods [41, 42]. Regarding the calculated student’s t-test and variance ratio F-test, there is no significant difference between the proposed and the reference methods regarding accuracy and precision
| % Recovery ± S.D. | |||||||||||||||||
|---|---|---|---|---|---|---|---|---|---|---|---|---|---|---|---|---|---|
| Pharmaceutical | |||||||||||||||||
| Drug | Proposed method | Reported | t-value* | F-value* | |||||||||||||
| Dosage forms | |||||||||||||||||
| (n=5) | method (n=5) | ||||||||||||||||
| Irbesartan | Approvel™ tablets | 99.62±0.57 | 99.41±0.51 | 0.61 | 1.22 | ||||||||||||
| X-TENSION® tablets | 99.74±0.55 | 0.97 | 1.15 |
Table 5: Application of the proposed FTIR method for analysis of the studied drug.
Medicinal & Analytical Chemistry International Journal
Conclusion
FT-IR spectrometry is capable for the analytical quantification of irbesartan in pharmaceutical tablets. Commercial softwareinvolving chemometric approaches, the method proposedis simple, precise and not time-consuming compared to thechromatographic methods that exist in literature.
References
-
Franca CA, Etcheverry SB, R Pis Diez Patricia AMW (2009) Irbesartan: FTIR and Raman spectra. Density functional study on vibrational and NMR spectra. Journal of Raman Spectroscopy 40(9): 1296-1300.
-
Bauer JH, Reams GP (1995) The Angiotensin II Type 1 Receptor Antagonists A New Class of Antihypertensive Drugs. Arch Inter Med 155(13): 1361-1368.
-
Weber MA (1997) Comparison of type 1 angiotensin II receptor blockers and angiotensin converting enzyme inhibitors in the treatment of hypertension. J Hypertens Suppl 15(6): S31-S36.
-
Ramakrishna S, SudhaLakshmi PB, Rambabu C (2012) Visible Spectrophotometric Methods for The Determination Of Irbesartan In Pharmaceutical Formulations. International Journal of Pharmacy and Pharmaceutical Sciences 4(3): 86-87.
-
Sena C, Armagan O (2010) Two simple and rapid spectrophotometric methods for the determination of a new antihypertensive drug olmesartan in tablets. J Anal Chem 65(3): 239-243.
-
Ganesh K, Balraj C, Elango KP (2011) Spectroscopic and spectrofluorimetric studies on the interaction of irbesartan with 2,3-dichloro-5,6-dicyano-1,4- benzoquinone and iodine. Spectrochim Acta Part A 79(5): 1621-1629.
-
Abdellatef HE (2007) Extractive- spectrophotometric determination of disopyramide and irbesartan in their pharmaceutical formulation. Spectrochim Acta Part A 66(4-5): 1248-1254.
-
Rahman N, Anwar N, Kashif M, Hoda N (2006) A sensitive kinetic spectrophotometric method for the determination of captopril in bulk and dosage forms. Acta Pharm (Zagreb, Croatia) 56(3): 347- 357.
-
Lakshmi S, Lakshmi KS (2014) H-Point Standard Addition Method for Simultaneous Spectrophotometric Determination of Irbesartan, hydrochlorothiazide and Telmisartan in tablets IJPRC 4(2): 373-380.
-
Pradhan KK, Mishra US, Pattnaik S, Debananda Mishra, Ghanshyam Panigrahi, et al. (2011) Method Development, Validation and Stability Study of Irbesartan in Bulk and Pharmaceutical Dosage Form by UV-Spectrophotometric Method. International Journal of Pharmaceutical & Biological Archives 2(4).
-
Mahmoud A, Sama HA, Ahmed AA, Ahmed MA (2011) Spectrophotometric and Spectrofluorimetric Determination of Certain Angiotensin Receptor Blockers through Complex Formation. J Pharm Sci & Res 3(10): 1499-1510.
-
Hillaert S, van den Bossche W (2002) Optimization and validation of a capillary zone electrophoretic method for the analysis of several angiotensin-II- receptor antagonists. J Chromatogr A 979(1-2): 323-333.
-
Ferreiros N, Dresen S, Alonso RM, Weinmann W (2007) Validated quantitation of angiotensin II receptor antagonists (ARA-II) in human plasma by liquid-chromatography-tandem mass spectrometry using minimum sample clean-up and investigation of ion suppression. Ther Drug Monit 29(6): 824- 834.
-
Gonzalez, O, Gonzalez O, Alonso RM, Ferreirós N, Weinmann W, et al. (2011) Development of an LC- MS/MS method for the quantitation of 55 compounds prescribed in combined cardiovascular therapy. J Chromatogr B Anal Technol Biomed Life Sci 879(3-4): 243-252.
-
Qui X, Wang Z, Wang B, Zhan H, Pan X, et al. (2014) Simultaneous determination of irbesartan and hydrochlorothiazide in human plasma by ultra high performance liquid chromatography tandem mass spectrometry and its application to the bioequivalence study. J Chromatogr B Analyt Technol Biomed Life Sci 957: 110-115.
-
Lu CY, Feng CH (2011) Quantitation of Irbesartan and Major Proteins in Human Plasma by Mass Spectrometry with Time-of-Flight Analyzer. J Pharm Biomed Anal 54(1): 100-105.
-
Bae SK, Kim MJ, Shim EJ, Cho DY, Shon JH, et al. (2009) HPLC determination of irbesartan in human plasma: its application to pharmacokinetic studies. Biomed Chromatogr 23(6): 568-572. Medicinal & Analytical Chemistry International Journal
-
Rao RN, Bompelli S, Maurya PK (2011) High- performance liquid chromatographic determination of anti- hypertensive drugs on dried blood spots using a fluorescence detector – method development and validation. Biomed Chromatogr 25(11): 1252-1259.
-
Mbah CJ (2004) Kinetics of decomposition of irbesartan in aqueous solutions determined by high performance liquid chromatography. Pharmazie 59(12): 920-922.
-
Ferreirós N, Iriarte G, Alonso RM, Jiménez RM (2007) Development of a solid phase extraction procedure for HPLC-DAD determination of several angiotensin II receptor antagonists in human urine using mixture design. Talanta 73(4): 748-756.
-
François C, Laurent H, Sandrine L, Eliane MB, Philippe B, et al. (2011) HPLC–DAD Analysis of Hydrochlorothiazide and Irbesartan in Hypertensive Patients on Fixed-Dose Combination Therapy. Chromatographia 74(7-8): 559-565.
-
Shakya AK, Al-Hiari YM, Alhamami OMO (2007) Liquid chromatographic determination of irbesartan in human plasma. J Chromatogr B Anal Technol Biomed Life Sci 848(2): 245-250.
-
Lundberg DE Jr, Person CR, Knox S, Cyronak MJ (1998) Determination of SK&F 108566 (Teveten) in human plasma by reversed-phase high- performance liquid chromatography. J Chromatogr B Biomed Appl 707(1-2): 328-333.
-
Ferreirós N, Iriarte G, Alonso RM, Jiménez RM, Ortíz E (2008) Separation and quantitation of several angiotensin II receptor antagonist drugs in human urine by a SPE-HPLC-DAD method J Sep Sci 31(4): 667-676.
-
Koyuturk S, Can NO, Atkosar Z, Arli G (2014) A novel dilute and shoot HPLC assay method for quantification of irbesartan and hydrochlorothiazide in combination tablets and urine using second generation C18 bonded monolithic silica column with double gradient elution. J Pharm Biomed Anal 97: 103-110.
-
Nishant G (2014) A validated stability indicating liquid chromatographic method for determination of process related impurities and degradation behaviour of irbesartan in solid dosage form. J Adv Pharm Tech Res 5(1): 33-40.
-
Alanazi AM, Abdelhameed AS, Khalil NY, Khan AA, Darwish IA (2014) HPLC method with monolithic column for simultaneous determination of irbesartan and hydrochlorothiazide in tablets. Acta Pharm 64(2): 187-198.
-
Gupta VK, Jain R, Agarwal S, Mishra R, Dwivedi A (2011) Electrochemical determination of antihypertensive drug irbesartan in pharmaceuticals. Anal Biochem 410(2): 266-271.
-
Bozal B, Dogan-Topal B, Uslu B, Ozkan SA, Aboul- Enein HY (2009) Quantitative analysis of irbesartan in pharmaceuticals and human biological fluids by voltammetry. Anal Lett 42(13-15): 2322-2338.
-
El-Desoky HS, Ghoneim MM, Habazy AD (2011) Voltammetry of irbesartan drug in pharmaceutical formulations and human blood: Quantification and pharmacokinetic studies. J Braz Chem Soc 22(2): 239-247.
-
Moros J, Garrigues S, de la Guardia M (2007) Quality control Fourier transform infrared determination of diazepam in pharmaceuticals. J Pharm Biomed Anal 43(4): 1277-1282.
-
Ovalles F, Maximo G, Rebeca R, Maria RB, Rafael L (2009) Determination of Sulphate for Measuring Magnesium Sulphate in Pharmaceuticals by Flow Analysis-Fourier Transforms Infrared Spectroscopy. Lat Am J Pharm 28(2).
-
Kennard RW, Stone LA (1969) Computer Aided Design of Experiments. Technometrics 11(1): 137- 148.
-
Sivakesava S, Irudayaraj J (2002) Classification of simple and complex sugar adulterants in honey by mid-infrared spectroscopy. International Journal of Food Science & Technology 37(4): 351-360.
-
Silverstein RM, Bassler GC, Morrill TC (1981) Spectrometric identification of organic compounds. 4th (Edn.), Wiley. New York, pp: 442.
-
Rohman A, Che Man YB (2011) The optimization of FTIR spectroscopy combined with partial least square for analysis of animal fats in quaternary mixtures. Spectroscopy 25(3-4): 169-176.
-
Faber NM, Rajko R (2007) How to avoid over-fitting in multivariate calibration--the conventional validation approach and an alternative. Anal Chim Acta 595(1-2): 98-106.
-
Rinnan Å, Fvd Berg, SB Engelsen (2009) Review of the most common pre-processing techniques for near-infrared spectra. TrAC Trends in Analytical Chemistry 28(10): 1201-1222. Medicinal & Analytical Chemistry International Journal
-
Perez-Guaita D, Ventura-Gayete J, Pérez-Rambla C, Sancho-Andreu M, Garrigues S, et al, (2012) Protein determination in serum and whole blood by attenuated total reflectance infrared spectroscopy. Anal Bioanal Chem 404(3): 649-656.
-
De Bleye C, Chavez PF, Mantanus J, Marini R, Hubert P, et al. (2012) Critical review of near-infrared spectroscopic methods validations in pharmaceutical applications. J Pharm Biomed Anal 69: 125-132.
-
El-Enany N, Belal F, Rizk M (2008) Novel Spectrophotometric Method for the Assay of Captopril in Dosage Forms using 2, 6- Dichloroquinone-4-Chlorimide. International Journal of Biomedical Science IJBS 4(2): 147-154.
-
Rani GT, Sankar DG, Madhavi L, Satyanarayana B (2012) Extractive visible spectrophotomrtric method for determination of telmesartan and irbesartan in bulk and pharmaceutical formulations. Asian Journal of Pharmaceutical and Clinical Research 5(1): 41-45.
- Spectrophotometric Determination of Lanthanum (III) and Some Rare Earths with Xylenol Orange
- Introduction and Sources of Molluscicides
- Trimetazidine: An Antianginal Drug and Not Only!
- Nature Inspired Discovery and Development of Antibacterials: An Update
- Fungal Biodegradation of Polycyclic Aromatic Hydrocarbons (PAHs)
- Recent Approaches of Impurity Profiling in Pharmaceutical Analysis: A Concise Review