Consciousness Energy Healing Treatment and Its Impact on the Structural Properties and Isotopic Abundance Ratios of Thiamine
Thiamine (vitamin B1) is an essential water soluble vitamin required in all living cells for many cellular functions. The objective of the study was to investigate the impact of the Trivedi Effect®-Consciousness Energy Healing Treatment on the isotopic abundance ratios (PM+1/PM and PM+2/PM) and structural properties of thiamine hydrochloride using LC-MS, GC-MS, and NMR spectroscopy. Thiamine sample was divided into two parts, one part of the sample was termed as untreated/control thiamine, while the other part of the sample received the Trivedi Effect®-Biofield Energy Healing Treatment remotely by a renowned Biofield Energy Healer, Mr. Mahendra Kumar Trivedi and designated as Biofield Energy Treated thiamine. The LC-ESI-MS analysis of both the thiamine samples showed the mass of parent molecular ion at m/z 265.03 (calcd for C12H17N4OS+, 265.11) at the retention times (Rt) 1.51 minutes with similar fragmentation pattern. But, the relative peak intensities of the treated sample were significantly improved compared to the control sample. The isotopic abundance ratios of PM+1/PM (2H/1H or 13C/12C or 15N/14N or 17O/16O or 33S/32S) and PM+2/PM (18O/16O or 34S/32S) were significantly increased by 43.60% and 42.68%, respectively in the treated thiamine compared to the control sample. Therefore, 2H, 13C, 15N, 17O, and 33S contributions from C12H17N4OS+ to the isotopic m/z 266 and 18O and 34S contributions to the isotopic m/z 267 was significantly increased in the treated sample compared with the control sample. The GC-MS mass peak intensity of the treated sample (52940.7) was significantly increased by 131.01% compared to the control sample (22917.04). The proton and carbon signals for CH3, CH2, NH2, CH, =C=, and C-OH groups in the 1H and 13C NMR spectra of the control and treated samples were similar. The increased mass peak intensities and isotopic abundance ratios in thiamine might be due to the Trivedi Effect®-Consciousness Energy Healing Treatment via the possible mediation of neutrinos, which may change the intra-atomic bond strength, its physical stability, kinetic isotope effects of the treated thiamine. Thus, the Trivedi Effect®-Consciousness Energy Healing Treated thiamine would be advantageous for designing better nutraceuticals and pharmaceutical formulations which might provide better therapeutic response against vitamin B1 deficiency and related disorders, including beriberi, Korsakoff’s syndrome, Parkinson’s and Alzheimer’s diseases, maple syrup urine disease, Leigh’s disease, optic neuropathy, alcoholism, and aging.
Introduction
Vitamin B1 is a water-soluble vitamin, also known as thiamine (or thiamin). It is an essential nutrient; animals must obtain it from foods like yeast, cereal grains, nuts, beans, spinach, meat, and in the dietary supplements [1]. Phosphate derivatives of thiamine needed in all living cells for many cellular processes [2]. Naturally, thiamine has five known phosphate derivatives, i.e., thiamine monophosphate (ThMP), thiamine diphosphate/ thiamine pyrophosphate (ThDP/TPP), thiamine triphosphate (ThTP), adenosine thiamine triphosphate (AThTP), and adenosine thiamine diphosphate (AThDP) [3, 4]. Thiamine acts as a coenzyme for the citric acid cycle, glycolytic pathway, pentose phosphate pathway, and degradation of branched-chain amino acids, helps change carbohydrates into energy in the cells of the body and strengthening the immune system, muscle contraction, functioning of the nervous system, heart, liver, and kidney [5, 6, 7, 8, 9]. It’s supplement used for the prevention and treatment of thiamine deficiency and related disorders, including beriberi, Korsakoff’s psychosis, Korsakoff’s syndrome, maple syrup urine disease, Leigh’s disease, optic neuropathy, Parkinson’s and Alzheimer’s diseases, alcoholism, and aging [10, 11, 12]. The side effects of thiamine include allergic reactions, i.e., anaphylaxis may occur [12]. Thiamine reported interacting with other medications like furosemide, 5-fluorouracil [13, 14].
The Trivedi Effect®-Energy of Consciousness Healing Treatment significantly influenced the bioavailability of pharmaceutical/nutraceuticals compounds, i.e., resveratrol, berberine, and 25-hydroxyvitamin D3 in Male Sprague- Dawley rats [15, 16, 17]. The Trivedi Effect® is a natural and only scientifically proven phenomenon in which a person can harness this inherently intelligent energy (Biofield Energy) and transmit it anywhere on the planet. Biofield Energy field is the electromagnetic field that exists around the human body [18, 19]. Biofield based Energy Healing Therapies used against various human disease conditions and accepted in many countries [20, 21]. Biofield Energy Healing therapy has been recognized worldwide as a Complementary and Alternative Medicine (CAM) health care approach by National Center of Complementary and Integrative Health (NCCIH) with other therapies, medicines and practices such as traditional Chinese herbs and medicines, Ayurvedic medicine, aromatherapy, homeopathy, yoga, Qi Gong, Tai Chi, chiropractic/osteopathic manipulation, meditation, acupuncture, acupressure, naturopathy, healing touch, movement therapy, cranial sacral therapy, Reiki, hypnotherapy, etc [22, 23]. The Trivedi Effect®-Energy of Consciousness Healing Treatment has astonishing ability to alter the characteristic properties of metals and ceramics [24, 25], organic compounds [26, 27], nutraceuticals/pharmaceuticals [28, 29, 30], crops [31, 32], etc. The Trivedi Effect® proposed to act through the possible mediation of neutrinos [18] resulted in alteration of the isotopic abundance ratio of some of the organic compounds [33, 34]. Study on the natural stable isotope required to understand the isotope effects resulting from the alterations of the isotopic composition, which have lots of applications in different fields of sciences [35, 36, 37]. Highly sophisticated Gas chromatography-mass spectrometry (GC-MS) and liquid chromatography-mass spectrometry (LC-MS) techniques are widely used for the study of isotope ratio analysis with sufficient precision [36]. Based on the various applications of the Trivedi Effect®-Consciousness Energy Healing Treatment the current study has been designed to perform the isotopic abundance ratio analysis of PM+1/PM (2H/1H or 13C/12C or 15N/14N or 17O/16O or 33S/32S) and PM+2/PM (18O/16O or 34S/32S) in thiamine to evaluate the influence of the Trivedi Effect® on the isotopic abundance ratio and structural properties using LC-MS, GC-MS, and NMR (Nuclear Magnetic Resonance) techniques.
Materials and Methods
Chemicals and Reagents
Thiamine hydrochloride (≥99%) was purchased from Sigma-Aldrich, India. The HPLC grade acetonitrile and formic acid were purchased from Merck, India. Methanol was purchased from Advent, India and Milli Q® water was procured from Evoqua, India.
Consciousness Energy Healing Treatment Strategies
Thiamine powder sample was divided into two parts. One part of thiamine was considered as a control sample which was not subjected to the Biofield Energy Treatment. Whereas, the second part of thiamine sample was treated with the Trivedi Effect®-Energy of Consciousness Healing Treatment remotely under standard laboratory conditions for 3 minutes by a famous Biofield Energy Healer, Mr. Mahendra Kumar Trivedi (USA) and termed as the Biofield Energy Treated thiamine. Further, the control sample was treated with a “sham” healer who did not have any knowledge about the Biofield Energy Treatment. After all, both samples of thiamine were kept in sealed conditions and characterized using LC-MS, GC-MS, and NMR techniques.
Characterization
Liquid Chromatography-Mass Spectrometry (LC-MS) Analysis and Calculation of Isotopic Abundance Ratio: The LC-MS analysis of the thiamine was performed using LC- Dionex Ultimate 3000, MS-TSQ Endura, USA, equipped with a photo-diode array (PDA) detector connected with a triple- stage quadrupole mass spectrometer (Thermo Scientific TSQ Endura, USA) with a Thermo Scientific Ion Max NG source and atmospheric pressure chemical ionization (APCI). The analysis was performed on a reversed phase Zorbax SB- C18 100 × 4.6 mm, 3.5 µm in gradient mode in the liquid chromatograph. The mobile phase was 2mM ammonium formate and 0.5% formic acid in water (mobile phase A), and acetonitrile (mobile phase B) at a constant flow rate of 0.6 mL/min. The column temperature was kept constant at 40˚C. The injection volume was 10 µL and the total run time was 45 minutes. Chromatographic separation was achieved using gradient condition as follow: 0 min-5%B, 5 min-5%B, 15 min-60%B, 25 min-95%B, 35 min-95%B, 40 min-5%B, and 45 min-5%B. Peaks were monitored using the PDA detector. The mass spectrometric analysis was performed under +ve ESI mode. The total ion chromatogram, peak area% and mass spectrum of the individual peak, which was appeared in LC along with the full scan, were recorded. The mass peak intensities of the mass spectrum of the individual peak were recorded.
The natural abundance of C, O, and H isotope can be predicted from the comparison of the relative abundance of the isotope peak with respect to the base peak. The values of the natural isotopic abundance of the common elements are obtained from the literature [37, 38, 39, 40]. The % change in the isotopic abundance ratios (PM+1/PM and PM+2/PM) of the Biofield Energy Treated thiamine were calculated compared to the control sample using equation 1.
% Change in isotopic abundance ratio = [(IARTreated – IARControl)/ IARControl)] x 100 (1) Where, IARTreated: Isotopic abundance ratio in the treated thiamine and IARControl: Isotopic abundance ratio in the control thiamine.
Gas Chromatography-Mass Spectrometry (GC-MS) Analysis: The GC-MS analysis of the control and Biofield Energy Treated thiamine was performed using Agilent
7890B Gas chromatograph equipped with a silica capillary column HP-5 MS (30m x 0.25mm x 0.25µm) and coupled to a quadrupole detector with pre-filter (5977B, USA) was operated with electron impact (EI) ionization in positive ion mode at 70 eV. The oven temperature was programmed from 50°C (1min hold) to 150°C@20°C/min to 200°C (6min hold)@25°C/min to 280°C@20°C/min (12min hold). Temperatures of the injector, detector (FID), auxiliary, ion source, and quadrupole detector were 230, 250, 280, 230, and 150°C. Thiamine was dissolved in methanol, and 5.0 µL was splitlessly injected with helium as a carrier gas with a flow rate of 2.0 mL/min. Mass spectra were scanned from m/z 40 to 1050 at stability of ± 0.1 m/z mass accuracy over 48 hours and mass peak intensities of the mass spectrum of the individual peak were recorded.
The % change in peak intensity (I) was calculated using the following equation 2:
% Change in peak intensity (I) = [I_Treated-I_Control]/I_Control × 100 (2)
Where, IControl and ITreated are the peak intensity of the control, and Biofield Energy Treated samples, respectively.
Nuclear Magnetic Resonance (NMR) Analysis: 1H NMR spectra of thiamine were recorded at 400 MHz on Agilent- MRDD2 FT-NMR. Approximately 3 mg of the sample was dissolved in DMSO-d6. Chemical shifts (d) were in parts per million (ppm) relative to the solvent’s residual proton chemical shift {(CD3)2SO, δ = 2.5}. Similarly, 13C NMR spectra of thiamine were measured at 100 MHz on Agilent-MRDD2 FT-NMR spectrometer at room temperature. Approximately 25 mg of the sample was dissolved in DMSO-d6. Chemical shifts (d) were in parts per million (ppm) relative to the solvent’s residual carbon chemical shift {(CD3)2SO, δ = 39.52}.
Results and Discussion
Liquid Chromatography-Mass Spectrometry (LC-MS) Analysis
The control and Biofield Energy Treated thiamine showed a clear and sharp chromatographic peak at retention times (Rt) 1.51 minutes in case of both the samples (Figure 1). The peak area% of the control and Biofield Energy Treated thiamine at Rt 1.51 minutes was 99.99 in both control and Biofield Energy Treated samples. The peak area% of the Biofield Energy Treated sample was similar to the control sample, which indicated that the polarity of both the samples remained similar.
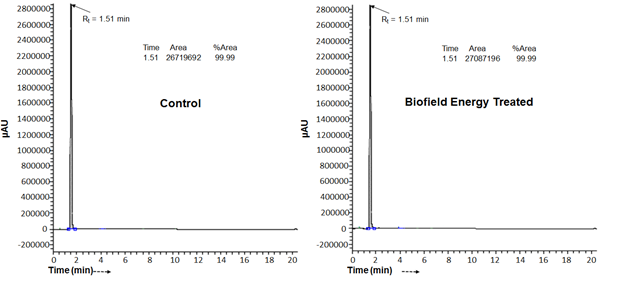
The ESI-MS spectra of the control and Biofield Energy Treated samples exhibited the molecular ion peak (Figure 2) of thiamine at m/z 265.03 (calcd for C12H17N4OS+, 265.11). The other major fragmented mass peak of at m/z 144.03 (calcd for C6H10NOS+, 144.05) and 122.11 (calcd for C6H8N3 +, 122.07) both in the mass spectra of control and Biofield Energy Treated thiamine (Figure 2).
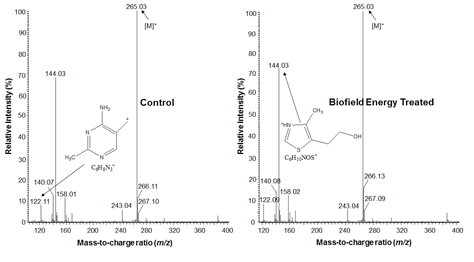
The parent mass peak at m/z 265.03 (calcd for C12H17N4OS+, 265.11) was the base peak which exhibited 100% relative peak intensity in both the spectra (Figure 2). From the mass spectra, the fragmentation patterns of the control and Biofield Energy Treated thiamine were the similar type (Figure 2). But, the relative peak intensities of the other ion peaks in the treated thiamine were significantly altered compared to the control sample.
Isotopic Abundance Ratio Analysis
The control and treated samples of thiamine showed the mass of molecular ion at m/z 265.03 (calcd for C12H17N4OS+, 265.11) with 100% relative abundance in the mass spectra. The theoretical calculation of isotopic peak PM+1 for the protonated thiamine presented below: P (13C) = [(12 x 1.1%) x 100% (the actual size of the M+ peak)] / 100% = 13.2% P (2H) = [(17 x 0.015%) x 100%] / 100% = 0.255% P (15N) = [(4 x 0.40%) x 100%] / 100% = 1.6% P (17O) = [(1 x 0.04%) x 100%] / 100% = 0.04% P (33S) = [(1 x 0.76%) x 100%] / 100% = 0.76% PM+1 i. e.13C, 2H, 15N, 17O, and 33S contributions from C12H17N4OS+ to m/z 266 = 15.86% Similarly, the theoretical calculation of isotopic peak PM+2 for the protonated thiamine presented below: P (18O) = [(1 x 0.20%) x 100%] / 100% = 0.2% P (34S) = [(1 x 4.29%) x 100%] / 100% = 4.29% PM+2 of 18O and 34S contributions from C12H17N4OS+ to m/z 267 = 4.49% The calculated isotopic abundance of PM+1 value 15.86% was little higher to the observed value (11.49%). But, the calculated PM+2 value 4.49% was very close to the observed value (3.96%) (Table 1). The probability of A+1 and A+2 elements having an isotope with one and two mass unit heavier, respectively than the most abundant isotope (i.e., 13C, 15N, 17O, 18O, and 33S) contributions to the mass of the isotopic molecular ion [M+1]+ and [M+2]+. 2H did not contribute much any isotopic m/z ratios because of its less natural abundance compared to the abundances of C, N, O, and S isotopes [38, 39, 40, 41]. But, the contributions of 13C, 15N, 17O, 18O, and 33S were major from thiamine to the isotopic mass peak at m/z 266 and 277 confirmed from the calculations. Therefore, PM, PM+1, and PM+2 of the thiamine at m/z 265, 266, and 277 of the control and Biofield Energy Treated samples were obtained from the experimental relative abundance of M+, (M+1)+, and (M+2)+ peaks, respectively in the mass spectra (Figure 2 and Table 1).
| Parameter | Control sample | Biofield Energy Treated sample |
|---|---|---|
| P at m/z 265 (%) M | 100 | 100 |
| P at m/z 266 (%) M+1 | 11.49 | 16.5 |
| P /P M+1 M | 0.1149 | 0.165 |
| % Change of isotopic abundance ratio (P /P ) with respect to the control thia- M+1 M mine | 43.6 | |
| P at m/z 267 (%) M+2 | 3.96 | 5.65 |
| P /P M+2 M | 0.0396 | 0.0565 |
| % Change of isotopic abundance ratio (P /P ) with respect to the control thia- M+2 M mine | 42.68 |
Table 1: LC-ESI-MS isotopic abundance ratio analysis of control and treated thiamine. PM = the relative peak intensity of the par
The % change in the isotopic abundance ratios (PM+1/ PM and PM+2/PM) in the Biofield Energy Treated thiamine compared to the control sample are shown in Table 1. The isotopic abundance ratio of PM+1/PM (2H/1H or 13C/12C or 15N/14N or 17O/16O or 33S/32S) in treated thiamine was significantly increased by 43.60% compared to the control sample (Table 1). This indicated that the 2H, 13C, 15N, 17O, and 33S contributions from C12H17N4OS+ to the isotopic m/z 266 in the Biofield Energy Treated thiamine sample were significantly increased compared to the control sample. Similarly, the isotopic abundance ratio of PM+2/PM (18O/16O or 34S/32S) in the Biofield Energy Treated thiamine also significantly increased by 42.68% compared to the control sample (Table 1). Therefore, the 18O and 34S contributions from C12H17N4OS+ to the isotopic m/z 267 in the Biofield Energy Treated thiamine was significantly increased compared to the control sample.
The neutrino is an electrically neutral elementary particle with very small mass, interacts only via the weak subatomic force and gravity [42, 43]. The neutrino oscillations seem to give credence to the postulates of Mr. Mahendra Kumar Trivedi on the Trivedi Effect®. Alteration of the number of neutrons in an atom leads to the increased or decreased isotopic abundance of the compounds. Changes in atomic/molecular weights are postulated to the changes in atomic mass and charge through the possible mediation of neutrinos [18, 44, 45, 46]. Neutrino travels straightly in any matter as if it is traveling in the vacuum and seldom interacts with matter. Thus, it can be assumed that the Trivedi Effect®- Consciousness Energy Healing Treatment might provide the necessary energy for the neutrino oscillations leads to the alteration of the fundamental properties of any object [18, 33, 34, 47]. The change in the isotopic abundance ratios (2H/1H or 13C/12C or 15N/14N or 17O/16O or 33S/32S or 18O/16O
or 34S/32S) may change the intra-atomic bond strength, its physical stability, kinetic isotope effects of the atoms/ molecules, which is very useful to study the reaction mechanism, understand the enzymatic transition state, and enzyme mechanism that is supportive for designing effective and specific inhibitors, etc [37, 48]. Thus, the Biofield Energy Treated thiamine with altered isotopic abundance ratio (PM+1/PM and PM+2/PM) was assumed to be more advantageous for the designing of better nutraceutical and pharmaceutical formulations.
Gas Chromatography-Mass Spectrometry (GC- MS) Analysis
The GC-MS of thiamine showed two clear chromatographic peaks in the chromatograms in case of both the samples (Figure 3). The two retention times were found at 6.9 and 16.7 minutes in both the chromatograms of control and Biofield Energy Treated samples. From the results, it was concluded that the polarity of the Biofield Energy Treated sample remained similar compared to the control sample. But, the GC chromatographic peak area% of Biofield Energy Treated thiamine (10.32%) was significantly decreased by 25.95% compared to the control sample (13.75%) (Table 2). This indicated that the solubility of Biofield Energy Treated thiamine decreased compared to the control sample.
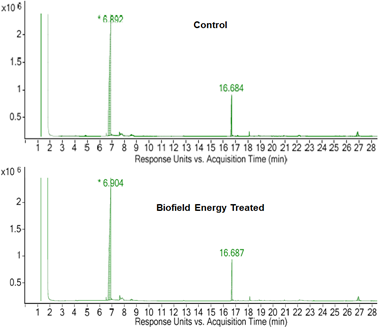
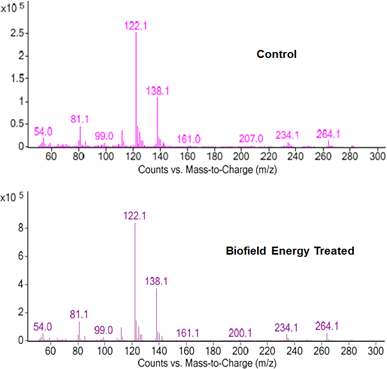
The GC-MS spectra of the control and Biofield Energy Treated thiamine at Rt of 16.7 minutes exhibited the presence of the molecular ion (Figure 4) at m/z 264.1 (calcd for C12H16N4OS+, 264.1). The other mass fragmentation peak at lower m/z 122.1 (calcd for C6H8N3 +, 122.07) and 138.1 (calcd for C7H8NS3 +, 138.04) in both control and Biofield Energy Treated thiamine (Figure 4). The mass fragmentation pattern of both the samples of thiamine was similar. But the mass peak intensities of the Biofield Energy Treated thiamine were significantly altered compared to the control thiamine. The mass peak intensity of the control and Biofield Energy Treated thiamine were 22917.04 and 52940.7, respectively at Rt of 16.7 minutes. The mass peak intensity of the Biofield Energy Treated sample was significantly increased by 131.01% compared to the control sample (Table 2). The mass peak intensities were significantly increased which assumed to be the impact of the Trivedi Effect®-Consciousness Energy Healing Treatment.
| Parameters | Control sample | Biofield Energy Treated sample | % Change |
|---|---|---|---|
| Peak area% | 13.75 | 10.32 | -24.95 |
| Mass peak (m/ z=264.1) inten- sity | 22917.04 | 52940.7 | 131.01 |
Table 2: GC-MS peak intensity analysis at Rt 16.7 minutes of the control and treated thiamine.
Nuclear Magnetic Resonance (NMR) Spectroscopy Analysis
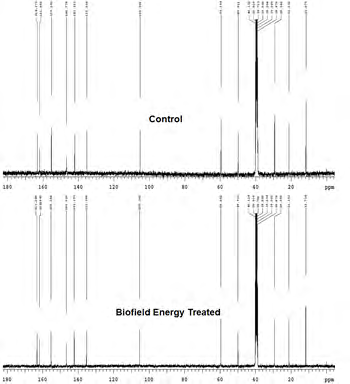
The 1H spectra of the control and Biofield Energy Treated thiamine are shown in Figure 5. The signals for the protons coupling of CH3, CH2, NH2, CH, and OH protons in both the 1H NMR spectra of thiamine were in the range of δ 2.53 to 9.97 ppm (Figure 5 and Table 3). The 1H signals for the control and Biofield Energy Treated thiamine were very close to each other. Similarly, 13C NMR spectra of the control and Biofield Energy Treated thiamine are shown in Figure 6. The carbon signals for CH3, CH2, CH, =C=, and C-OH groups in both the control and Biofield Energy Treated 13C NMR spectra were in the range of 11.71-163.19 (Figure 6 and Table 3). The experimental data were closely matched to the published literature [49]. The NMR spectral data indicated that there was no structural modification of Biofield Energy Treated thiamine compared to the control sample.
| 1H & 13C S. No | 1H NMR d (ppm) & Multiplicity | 13C NMR d (ppm) | ||
|---|---|---|---|---|
| Untreated | Biofield Energy Treated | Untreated | Biofield Energy Treated | |
| 1 | 3.66 (t, J = 12 Hz, 2H) | 3.66 (t, J = 12 Hz, 2H) | 59.59 | 59.6 |
| 2 | 3.08 (t, J = 12 Hz, 2H) | 3.08 (t, J = 12 Hz, 2H) | 29.34 | 29.35 |
| 3 | -- | -- | 135.34 | 135.32 |
| 4 | 9.97 (S, 1H) | 10.01 (S, 1H) | 155.29 | 155.29 |
| 5 | -- | -- | 142.16 | 142.19 |
| 6 | 2.53 (S, 3H) | 2.54 (S, 3H) | 11.68 | 11.71 |
| 7 | 5.62 (S, 2H) | 5.67 (S, 2H) | 49.91 | 49.91 |
| 8 | -- | -- | 163.17 | 163.19 |
| 9 | -- | -- | 105.3 | 105.34 |
| 10 | 9.19 (S, 2H) | 9.27 (S, 2H) | -- | -- |
| 11 | -- | -- | 161.96 | 161.83 |
| 12 | 2.57 (S, 3H) | 2.58 (S, 3H) | 21.23 | 21.17 |
| 13 | 8.36 (S, 1H) | 8.39 (S, 1H) | 146.78 | 146.61 |
Table 3: 1H and 13C NMR spectroscopic data of both the control and treated thiamine.
S- singlet and T-triplet. Table 3: 1H and 13C NMR spectroscopic data of both the control and treated thiamine.
![Figure 5: The signals for the protons coupling of CH3, CH2, NH2, CH, and OH protons in both the 1H NMR spectra of thiamine were in the range of δ 2.53 to 9.97 ppm (Figure 5 and Table 3). The 1H signals for the control and Biofield Energy Treated thiamine were very close to each other. Similarly, 13C NMR spectra of the control and Biofield Energy Treated thiamine are shown in Figure 6. The carbon signals for CH3, CH2, CH, =C=, and C-OH groups in both the control and Biofield Energy Treated 13C NMR spectra were in the range of 11.71-163.19 (Figure 6 and Table 3). The experimental data were closely matched to the published literature [49]. The NMR spectral data indicated that there was no structural modification of Biofield Energy Treated thiamine compared to the control sample.](/fulltextimages/4975/fig_5.png)
Conclusion
The Consciousness Energy Healing Treatment on thiamine by the renowned Biofield Energy Healer, Mr. Mahendra Kumar Trivedi showed the astonishing significant impact on the relative peak intensities and isotopic abundance ratios. The LC-ESI-MS analysis of both control and Biofield Energy Treated thiamine samples showed the mass of parent molecular ion at m/z 265.03 (calcd for C12H17N4OS+, 265.11) at the retention times (Rt) 1.51 minutes with similar fragmentation pattern. But, the relative peak intensities of the Biofield Energy Treated sample were significantly improved compared to the control sample. The isotopic abundance ratios of PM+1/PM (2H/1H or 13C/12C or 15N/14N or 17O/16O or 33S/32S) and PM+2/PM (18O/16O or 34S/32S) were significantly increased by 43.60% and 42.68%, respectively in the Biofield Energy Treated thiamine compared to the control sample. Therefore, 2H, 13C, 2H, 15N, 17O, and 33S contributions from C12H17N4OS+ to the isotopic m/z 266 and 18O and 34S contributions to the isotopic m/z 267 significantly increased in the Biofield Energy Treated sample compared with the control sample. The GC-MS mass peak intensity of the Biofield Energy Treated sample (52940.7) was significantly increased by 131.01% compared to the control sample (22917.04). The proton and carbon signals for CH3, CH2, NH2, CH, =C=, and C-OH groups in the 1H and 13C NMR spectra of the control and Biofield Energy Treated samples were similar. The increased mass peak intensities and isotopic abundance ratios in thiamine might be due to the Trivedi Effect®-Consciousness Energy Healing Treatment via the possible mediation of neutrinos, which may change the intra-atomic bond strength, its physical stability, and kinetic isotope effects of the thiamine. Thus, the Trivedi Effect®-Consciousness Energy Healing Treated thiamine would be advantageous for designing more efficacious nutraceuticals and pharmaceutical formulations against vitamin B1 deficiency and related disorders, including beriberi, Korsakoff’s syndrome, Parkinson’s and Alzheimer’s diseases, maple syrup urine disease, Leigh’s disease, optic neuropathy, alcoholism, and aging.
Acknowledgement
The authors are grateful to GVK Biosciences Pvt. Ltd., Trivedi Science, Trivedi Global, Inc., Trivedi Testimonials, and Trivedi Master Wellness for their assistance and support during this work.
References
-
Office of Dietary Supplements-Thiamin.
-
Balk L, Hagerroth PA, Gustavsson H, Sigg L, Akerman G, et al. (2016) Widespread episodic thiamine deficiency in Northern Hemisphere wildlife. Sci Reports 6: 38821.
-
Mkrtchyan G, Aleshin V, Parkhomenko Y, Kaehne T, Salvo MLD, et al. (2015) Molecular mechanisms of the non-coenzyme action of thiamin in brain: biochemical, structural and pathway analysis. Sci Rep 5: 12583.
-
Bettendorff L, Wirtzfeld B, Makarchikov AF, Mazzucchelli G, Frédérich M, et al. (2007) Discovery of a natural thiamine adenine nucleotide. Nat Chem Biol 3(4): 211- 212.
-
Bettendorff L, Mastrogiacomo F, Kish SJ, Grisar T (1996) Thiamine, thiamine phosphates and their metabolizing enzymes in human brain. J Neurochem 66(1): 250-258.
-
Meador KJ, Nichols ME, Franke P, Durkin MW, Oberzan RL, et al. (1993) Evidence for a central cholinergic effect of high-dose thiamine. Ann Neurol 34(5): 724-726.
-
Ianchii OR, Parkhomenko Iu M, Donchenko HV (2001) Properties of thiamine-binding proteins isolated from rat brain, liver and kidneys. Ukr Biokhim Zh 73(3): 107- 111.
-
Frédérich M, Delvaux D, Gigliobianco T, Gangolf M, Dive G, et al. (2009) Thiaminylated adenine nucleotides. Chemical synthesis, structural characterization and natural occurrence. FEBS Journal 276(12): 3256-3268.
-
Smithline HA, Donnino M, Greenblatt DJ (2012) Pharmacokinetics of high-dose oral thiamine hydrochloride in healthy subjects. BMC Clin Pharmacol 12: 4.
-
Blass JP, Gleason P, Brush D, DiPonte P, Thaler H (1988) Thiamine and Alzheimer’s disease. A pilot study. Arch Neurol 45(8): 833-835.
-
Luong KV, Nguyen LT (2013) The beneficial role of thiamine in Parkinson disease. CNS Neurosci Ther 19(7): 461-468.
-
https://en.wikipedia.org/wiki/Thiamine.
-
Zenuk C, Healey J, Donnelly J, Vaillancourt R, Almalki Y, et al. (2003) Thiamine deficiency in congestive heart failure patients receiving long term furosemide therapy. Can J Clin Pharmacol 10(4): 184-188.
-
Cho IJ, Chang HJ, Lee KE, Won HS, Choi MY, et al. (2009) A case of Wernicke’s encephalopathy following fluorouracil-based chemotherapy. J Korean Med Sci 24(4): 747-750.
-
Branton A, Jana S (2017) The influence of energy of consciousness healing treatment on low bioavailable resveratrol in male Sprague Dawley rats. Int J Clin Developmental Anatomy 3(3): 19-25.
-
Branton A, Jana S (2017) The use of novel and unique biofield energy healing treatment for the improvement of poorly bioavailable compound, berberine in male Sprague Dawley rats. American Journal of Clinical and Experimental Medicine 5(4): 138-144.
-
Branton A, Jana S (2017) Effect of The biofield energy healing treatment on the pharmacokinetics of 25-hydroxyvitamin D3 [25(OH)D3] in rats after a single oral dose of vitamin D3. American Journal of Pharmacology and Phytotherapy 2(1): 11-18.
-
Trivedi MK, Mohan TRR (2016) Biofield Energy Signals, Energy Transmission and Neutrinos. American Journal of Modern Physics 5(6): 172-176.
-
Rubik B, Muehsam D, Hammerschlag R, Jain S (2015) Biofield Science and Healing: History, Terminology, and Concepts. Glob Adv Health Med 4: 8-14.
-
Warber SL, Cornelio D, Straughn J, Kile G (2004) Biofield energy healing from the inside. J Altern Complement Med 10(6): 1107-1113.
-
Movaffaghi Z, Farsi M (2009) Biofield therapies: Biophysical basis and biological regulations?. Complement Ther Clin Pr 15(1): 35-37.
-
Sewitch MJ, Rajput Y (2010) A literature review of complementary and alternative medicine use by colorectal cancer patients. Complement Ther Clin Pr 16(1): 52-56.
-
Koithan M (2009) Introducing complementary and alternative therapies. J Nurse Pract 5(1): 18-20.
-
Trivedi MK, Tallapragada RM (2008) A transcendental to changing metal powder characteristics. Metal Powder Report 63(9): 22-28.
-
Trivedi MK, Nayak G, Patil S, Tallapragada RM, Latiyal O (2015) Studies of the atomic and crystalline characteristics of ceramic oxide nano powders after bio field treatment. Ind Eng Manage 4: 161.
-
Trivedi MK, Branton A, Trivedi D, Nayak G, Bairwa K, et al. (2015) Impact of biofield treatment on spectroscopic and physicochemical properties of p-nitroaniline. Insights in Analytical Electrochemistry 1: 1-8.
-
Trivedi MK, Branton A, Trivedi D, Nayak G, Latiyal O, et al. (2015) Evaluation of biofield treatment on atomic and thermal properties of ethanol. Organic Chem Curr Res 4: 145.
-
Trivedi MK, Tallapragada RM, Branton A, Trivedi D, Nayak G, et al. (2015) Evaluation of Biofield Energy Treatment on Physical and Thermal Characteristics of Selenium Powder. Journal of Food and Nutrition Sciences 3(6): 223-228.
-
Trivedi MK, Patil S, Shettigar H, Bairwa K, Jana S (2015) Effect of biofield treatment on spectral properties of paracetamol and piroxicam. Chem Sci J 6: 98.
-
Trivedi MK, Branton A, Trivedi D, Nayak G, Saikia G, et al. (2015) Physical and structural characterization of biofield treated imidazole derivatives. Nat Prod Chem Res 3: 187.
-
Trivedi MK, Branton A, Trivedi D, Nayak G, Mondal SC, et al. (2015) Evaluation of plant growth regulator, immunity and DNA fingerprinting of biofield energy treated mustard seeds (Brassica juncea). Agriculture, Forestry and Fisheries. 4(6): 269-274.
-
Trivedi MK, Branton A, Trivedi D, Nayak G, Bairwa K, et al. (2015) Physical, thermal, and spectroscopic characterization of biofield energy treated murashige and skoog plant cell culture media. Cell Biology 3(4): 50- 57.
-
Trivedi MK, Branton A, Trivedi D, Nayak G, Panda P, et al. (2016) Evaluation of the isotopic abundance ratio in biofield energy treated resorcinol using gas chromatography-mass spectrometry technique. Pharm Anal Acta 7(5): 481.
-
Trivedi MK, Branton A, Trivedi D, Nayak G, Panda P, et al. (2016) Gas chromatography-mass spectrometric analysis of isotopic abundance of 13C, 2H, and 18O in biofield energy treated p-tertiary butylphenol (PTBP). American Journal of Chemical Engineering 4(4): 78-86.
-
Schellekens RC, Stellaard F, Woerdenbag HJ, Frijlink HW, Kosterink JG (2011) Applications of stable isotopes in clinical pharmacology. Br J Clin Pharmacol 72(6): 879- 897.
-
Muccio Z, Jackson GP (2009) Isotope ratio mass spectrometry. Analyst 134(2): 213-222.
-
Weisel CP, Park S, Pyo H, Mohan K, Witz G (2003) Use of stable isotopically labeled benzene to evaluate environmental exposures. J Expo Anal Environ Epidemiol 13(5): 393-402.
-
http://www.ionsource.com/Card/Mass/mass.htm
-
https://chem.libretexts.org/Core/Analytical_ Chemistry/Instrumental_Analysis/Mass_Spectrometry/ Mass_Spectrometry%3A_Isotope_Effects
-
Smith RM (2004) Understanding Mass Spectra: A Basic Approach, 2nd (Edn.), John Wiley & Sons, Inc, ISBN 0-471- 42949-X.
-
Jürgen H (2004) Gross Mass Spectrometry: A Textbook. 2nd (Edn.), Springer: Berlin.
-
Susanne M (2016) Direct neutrino mass experiments. Journal of Physics: Conference Series 718: 022013.
-
Nakamura K, Petcov ST (2016) Neutrino mass, mixing, and oscillations. Chin Phys 40: 100001.
-
Kajita T (2010) Atmospheric neutrinos and discovery of neutrino oscillations. Proc Jpn Acad Ser B Phys Biol Sci 86(4): 303-321.
-
McDonald AB (2015) The sudbury neutrino observatory: Observation of flavor change for solar neutrinos: Lecture slides Nobel Lecture, Aula Magna, Stockholm University.
-
Kajita T (2015) Discovery of atmospheric neutrino oscillations: lecture slides, Nobel lecture, Aula Magna, Stockholm University.
-
Trivedi MK, Branton A, Trivedi D, Nayak G, Panda P, et al. (2016) Isotopic abundance ratio analysis of 1,2,3-trimethoxybenzene (TMB) after biofield energy treatment (the Trivedi Effect®) using gas chromatography-mass spectrometry. American Journal of Applied Chemistry 4(4): 132-140.
-
Santesteban LG, Miranda C, Barbarin I, Royo JB (2014) Application of the measurement of the natural abundance of stable isotopes in viticulture: A review. Australian Journal Of Grape And Wine Research 21(2): 157-167.
-
Spectral Database for Organic Compounds SDBS.
- Spectrophotometric Determination of Lanthanum (III) and Some Rare Earths with Xylenol Orange
- Introduction and Sources of Molluscicides
- Trimetazidine: An Antianginal Drug and Not Only!
- Nature Inspired Discovery and Development of Antibacterials: An Update
- Fungal Biodegradation of Polycyclic Aromatic Hydrocarbons (PAHs)
- Recent Approaches of Impurity Profiling in Pharmaceutical Analysis: A Concise Review