Analytical Method Development and Validation of Flecainide Acetate by Chromatographic and Spectrophotometric Techniques
The aim of the present work is to establish three simple, economical and rapid methods for the quantification of Flecainide acetate in bulk drug and in tablets formulation. This study is designed to validate and developed spectroscopic and chromatographic methods as per ICH guidelines. In Method A, area under curve (AUC) of zero-order spectrum was recorded between 277.00 and 310.00nm. Linearity was found in the concentration range of 20-120μg/ml. In Method B, zero-order spectra were derivatized into first-order and the AUC was recorded between 280.00 and 310.20 nm. The linearity was found in the conc. range of 20-120μg/ml. In Method C, separation was achieved using RP-HPLC by gradient elution using a C18 Qualisil BDS (250mm×4.5mm×5µm) column, a mobile phase consisting of water: acetonitrile (60:40 v/v) with mobile phase pH adjusted with orthophosphoric acid (pH 3.0), a flow rate of 1.0ml/min and UV detection at 296nm. The linearity was obtained in the concentration range of 10-50μg/ml. The developed methods are validated successfully across various parameters in accordance with ICH guidelines. Thus, the proposed methods can be used for routine analysis of Flecainide acetate as it does not showed any interference of excipients when estimated in pharmaceutical formulations.
Introduction
Flecainide Acetate (FA) is chemically designated as N-(2-piperidinylmethyl)-2, 5-bis (2, 2, 2–trifluoroethoxy) benzamide acetate having molecular formula: C19H24F6N2O5 with molecular weight: 474.4g/mol (Figure 1) [1]. It is a white solid powder with melting point 146-152°C [2]. It is an antiarrhythmic agent (class IC) causing a decreased in intra- cardiac conduction velocity in all parts of the heart [3]. It is used for the treatment of tachyarrhythmia, atrial fibrillation, supraventricular tachycardia and ventricular tachycardia by blocking Na+ current delayed rectifier K+ current [classified as a Na+ channel blocker drug] [4]. Flecainide also has local anesthetic effects. It selectively increases anterograde and retrograde accessory pathway refractoriness. The action of Flecainide in the heart prolongs the PR interval and widens the QRS complex. The effect on the JT interval is insignificant as Flecainide does not lengthen ventricular repolarization [5]. The drug is official in the European [6], British [7] and US pharmacopeias [8]. Several chromatographic methods have been reported in the literature for the determination of FA in its bulk powder, in pharmaceutical formulations or in the presence of its enantiomers, metabolites or other antiarrhythmic drugs [4].
Analysis part is an important for formulation development of any drug molecule. A suitable and validated method should be vacant for the drug delivery system for analysis of bulk drug and formulation [9]. The developed methods were validated for accuracy, precision, ruggedness, and sensitivity. Accordingly, the objective of this study was to develop and validate the simple spectrophotometric method for the estimation of FA in bulk and tablets as per ICH guidelines.
Experimental
Instrumentation
The Shimadzu double beam UV-VIS spectrophotometer with spectra manager software UV Probe 2.21 with 10mm quartz cells was used. The chromatographic separation was achieved by using Agilent system consisting photodiode array detector, C18 Qualisil BDS (250mm×4.5mm×5µm) column [10]. All weights were taken on an electronic balance (Model Shimadzu AUX 120).
Chemicals
The gift sample of FA was obtained from Indeus Life Sciences Pvt. Ltd, Mumbai. Analytical grade solvents and reagents were purchased from Merck specialties Pvt. Ltd. Mumbai (India). Double distilled water filtered through the membrane filter was used. Flecarite tablets each containing 100mg of active drug were purchased from the local market.
Preparation of Standard Stock Solution
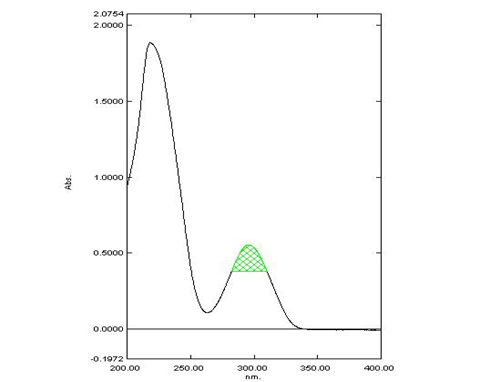
The standard stock solution was prepared by dissolving 10mg of FA in the 100ml of water, sonicated and to obtain the concentration of 100μg/ml. Method A: Area under Curve Zero Order UV Spectrophotometric Method: Concentration of 10μg/ml was prepared by diluting 1ml of standard stock solution with 10ml of water. This solution was scanned in the UV-visible range 400-200nm. FA showed the maximum absorbance at 296 nm as shown in and the AUC of the zero order spectrums was recorded between the 277.00-310.00nm (Figure 2).
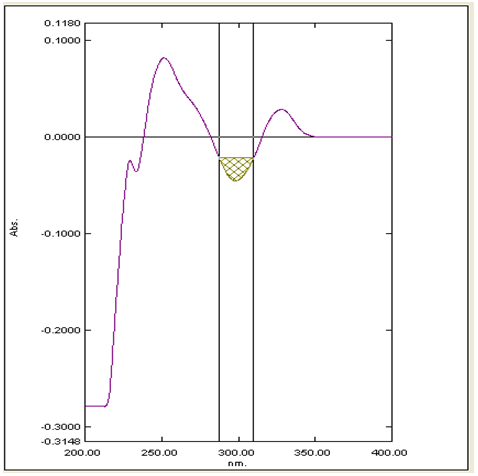
Method B: Area Under Curve First Order UV Spectrophotometric Method: The zero order spectrums were derivatized into first order spectrum and the AUC was recorded between 280.00-310.20nm as shown in Figure 3.
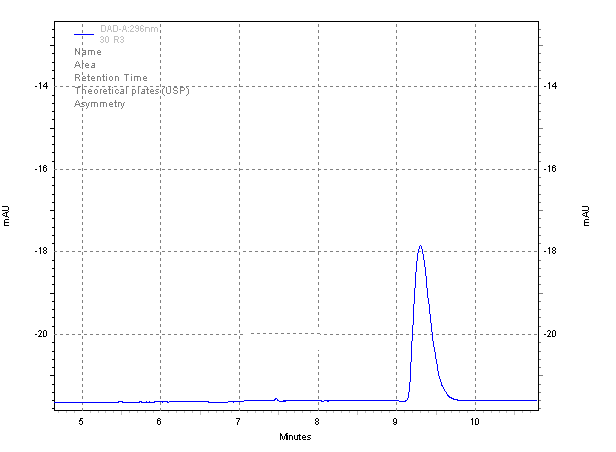
Method C: RP-HPLC Method: In Method C RP-HPLC method in which separation was achieved by gradient elution using a C18 Qualisil BDS (250mm×4.5mm×5µm) column, a mobile phase consisting of water: acetonitrile (60:40 v/v) with mobile phase pH adjusted with orthophosphoric acid (pH 3.0), a flow rate of 1.0ml/min and UV detection at 296nm. The linearity was obtained in the conc. range of 10-50μg/ml. The retention time of Flecainide acetate was 9.3min (Figure 4).
Validation of Proposed Methods A, B and C
The proposed UV and HPLC methods A, B and C were validated across various parameters like linearity, accuracy, precision, ruggedness, sensitivity, repeatability, bulk and pharmaceutical formulation assay according to ICH guidelines [11].
Linearity
The concentration range 20-120μg/ml for method A and method B, while for method C the linearity concentration range 10-50μg/ml.
Accuracy
To the pre-analyzed sample solutions, a known amount of stock standard solution was added at different levels, i.e. 80%, 100%, and 120%. The solutions were re-analyzed by the proposed methods.
Precision
The precision of the methods was studied as intra-day and inter-day variations. In Method A and B precision was determined by analyzing the 40, 60, and 80μg/ml of FA solutions as intra-day and inter-day variations. While in method C precision was determined by analyzing 20, 30, and 40μg/ml of FA solutions as intra-day and inter-day variations.
Ruggedness
The ruggedness of the proposed methods was determined for 60μg/ml concentrations of drug in Method A and B and 30μg/ml in Method C by analysis of aliquots from a homogenous slot by two analysts using the same operational and environmental conditions.
Sensitivity
The sensitivity of measurements of FA by the use of the proposed methods was estimated in terms of the limit of quantification (LOQ) and the limit of detection (LOD). The LOQ and LOD were calculated using equation LOD=3.3×N/B and LOQ=10×N/B, where ‘N’ is the standard deviation of the AUC of the drugs (n=3), taken as a measure of noise, and ‘B’ is the slope of the corresponding calibration curve.
Repeatability
Repeatability was determined by analyzing 60μg/ml concentration of FA solution for six times for methods A and B and 30μg/ml for method C.
Determination of Flecainide Acetate in bulk
A quantity of powder equivalent to 60μg/ml was transferred into a 100ml volumetric flask containing 30 ml of water, sonicated for 15min, the volume was adjusted to the mark using the same solvent and filtered through Whatman filter paper no. 41. An appropriate volume 6 ml was transferred into a 10ml volumetric flask and volume was adjusted to the mark to obtain the desired concentration of 10μg/ml. The AUC was recorded at selected wavelengths for Method A while in Method B, AUC of the first-order derivative spectrum were recorded in between selected wavelength ranges and for method C concentration of 30μg/ml was injected in system and the concentration of the drug was determined from the respective linear regression equations.
Application of Proposed Method for Pharmaceutical Tablet Formulation
The pharmaceutical tablet formulation, Flecarite (Torrent) 20 tablets were accurately weighed, average weight determined and ground into fine powdered. A quantity of powder equivalent to 60μg/ml was transferred into a 100ml volumetric flask containing 30ml of water, sonicated for 15min, volume was adjusted to the mark using the same solvent and filtered through Whatman filter paper no. 41. An appropriate volume 6ml was transferred into a 10ml volumetric flask and the volume were adjusted to the mark to obtain the desired concentration of 10μg/ml. The AUC was recorded at selected wavelengths for method A while in method B, AUC of the first-order derivative spectrum was recorded in between selected wavelength ranges and 30μg/ ml injected in HPLC system (Method C).The concentration of the drug was determined from the respective linear regression equations.
Results and Discussion
The proposed methods (A, B and C) was validated across the various parameters like linearity, accuracy, precision, ruggedness, sensitivity, repeatability, bulk and pharmaceutical formulation assay as per ICH guidelines.
Linearity
The linear regression data for the calibration curves showed a good linear relationship over the concentration range 20-120μg/ml for Method A and Method B. The linear regression equation was found to be y= 0.0463x−0.0403 and y = 0.0373x+0.1652 for AUC zero order and AUC first order respectively while a good correlation coefficient (r²=0.9995 and r²=0.9993) for both the methods A and B (Figures 5a & 5b) and for method C the linearity concentration range 10- 50μg/ml and the linear regression equation was found to be y= 327.29x+5649.7 with r²=0.9992 (Figure 6).
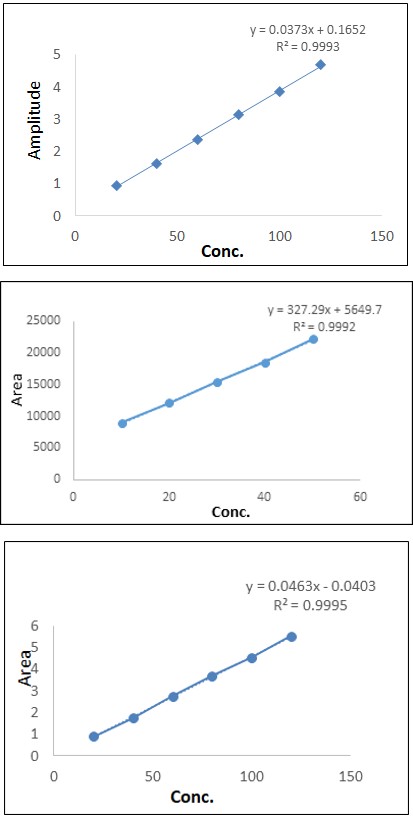
Figure 5a: Linearity Curve of Flecainide Acetate by AUC Zero Order Derivatives.
Figure 5b: Linearity Curve of Flecainide Acetate by AUC First Order Derivatives.
The results of linearity are expressed in Table 1.
| Method A | Method B | Method C | |||
|---|---|---|---|---|---|
| Conc.(μg/ml) | Area | Conc.(μg/ml) | Amplitude | Conc.(μg/ml) | Area |
| 20 | 0.9103 | 20 | 0.9503 | 10 | 9015 |
| 40 | 1.7547 | 40 | 1.6393 | 20 | 12155 |
| 60 | 2.7497 | 60 | 2.3803 | 30 | 15445 |
| 80 | 3.7031 | 80 | 3.1376 | 40 | 18540 |
| 100 | 4.5489 | 100 | 3.8512 | 50 | 22187 |
| 120 | 5.5188 | 120 | 4.6912 |
Table 1: Linearity Studies of Flecainide Acetate.
Accuracy
The solutions were reanalyzed by proposed method. The mean % recovery was found to be in the range of 98.45 to
99.99% for all three methods with % RSD less than 2 indicate that the methods were precise. The results are expressed in Table 2.
Methods at 80% at 100% at 120% % recovery ±SD %RSD % recovery ±SD %RSD % recovery ±SD %RSD A 98.45± 0.71 0.72 99.40± 1.42 1.42 99.99± 0.44 0.44 B 98.88± 0.38 0.38 99.70± 0.80 0.8 99.68± 1.09 1.09 C 98.62± 0.64 0.64 99.40± 1.03 1.04 99.29± 0.67 0.68
- *(n=3)
Table 2: Accuracy Studies of Flecainide Acetate.
Precision
The precision of the developed method was expressed in terms of % relative standard deviation (% RSD). These results show reproducibility of the assay. The % RSD values found to be less than 2 indicate that the methods were precise for the determination of drugs in formulation. The results are expressed in Table 3.
| Methods | Conc. (μg/ml) | Intra-day precision | Inter-day precision | ||
|---|---|---|---|---|---|
| % Amount found*± SD | % RSD | % Amount found*± SD | % RSD | ||
| A | 40 | 98.35± 0.65 | 0.66 | 98.48± 0.47 | 0.48 |
| 60 | 99.36± 0.76 | 0.77 | 99.31± 0.72 | 0.73 | |
| 80 | 99.12± 0.13 | 0.13 | 99.05± 0.11 | 0.11 | |
| B | 40 | 98.25± 0.55 | 0.56 | 98.31± 0.50 | 0.51 |
| 60 | 98.44± 0.59 | 0.6 | 98.56± 0.61 | 0.62 | |
| 80 | 99.40± 0.62 | 0.62 | 99.50± 0.67 | 0.68 | |
| C | 20 | 98.66± 0.86 | 0.87 | 98.71± 0.83 | 0.84 |
| 30 | 98.82± 0.82 | 0.83 | 98.44± 1.13 | 1.14 | |
| 40 | 98.36± 0.14 | 0.14 | 98.68± 0.33 | 0.34 |
Table 3: Precision Studies of Flecainide Acetate.
*(n=3) Table 3: Precision Studies of Flecainide Acetate.
Ruggedness
Ruggedness of the proposed methods was determined for selected concentrations. The results were in the acceptable range for all the three methods and % RSD was found to be less than 2, indicating that the method is rugged. The detail results are tabulated as in Table 4.
| Methods | Conc. (µg/ml) | Analyst I | Analyst II | ||
|---|---|---|---|---|---|
| % Amount found*± SD | % RSD | % Amount found*± SD | % RSD | ||
| A | 60 | 99.07± 1.04 | 1.05 | 98.56± 0.84 | 0.85 |
| B | 60 | 98.54± 0.70 | 0.71 | 99.04± 1.05 | 1.06 |
| C | 30 | 98.86± 0.81 | 0.82 | 98.47± 0.83 | 0.84 |
Table 4: Ruggedness Studies of Flecainide Acetate.
*(n=6) Table 4: Ruggedness Studies of Flecainide Acetate.
Repeatability
Repeatability was determined for selected concentrations of FA solution for six times and the % amount determined with % RSD less than 2 for all the three methods. The results are expressed in Table 5.
| Methods | Amount taken (µg/ml) | Amount found* | % Amount found*± SD | % RSD |
|---|---|---|---|---|
| A | 60 | 59.07 | 98.45± 0.87 | 0.88 |
| B | 60 | 59.14 | 98.56± 0.66 | 0.67 |
| C | 30 | 29.63 | 98.77± 0.84 | 0.85 |
Table 5: Repeatability Studies of Flecainide Acetate.
Analysis of Flecainide Acetate in Bulk
The concentrations of the drug were calculated from linear regression equations. The % amount found was within 98.66% to 99.15% with % RSD less than 2 for all the three methods. The results are expressed in Table 6.
| Methods | Amount taken (µg/ml) | Amount found* | % Amount found*± SD | % RSD |
|---|---|---|---|---|
| A | 60 | 59.42 | 99.03± 1.03 | 1.04 |
| B | 60 | 59.49 | 99.15± 0.90 | 0.91 |
| C | 30 | 29.59 | 98.66± 0.99 | 1 |
Table 6: Analysis of Flecainide Acetate in Bulk.
*(n=6) Table 6: Analysis of Flecainide Acetate in Bulk.
Analysis of Flecainide Acetate in Tablet Formulation
The spectrum was recorded at 296nm. The
concentrations of the drug were calculated from linear regression equation. The % amount was found around 98% with % RSD less than 2 for all the three methods. The results are expressed in Table 7.
| Methods | Amount taken (µg/ml) | Amount found* | % Amount found*± SD | % RSD |
|---|---|---|---|---|
| A | 60 | 59.11 | 98.52± 0.80 | 0.81 |
| B | 60 | 59.2 | 98.67± 0.79 | 0.8 |
| C | 30 | 29.59 | 98.64± 0.68 | 0.69 |
Table 7: Analysis of Flecainide Acetate in Tablet Formulation.
*(n=6) Table 7: Analysis of Flecainide Acetate in Tablet Formulation.
Sensitivity
The LOD and LOQ for selected drug were found to be
0.20 and 0.61μg, respectively, for method A, and 0.32 and 0.97μg, respectively for method B while it is found to be 0.03 and 0.12 for method C. The results are expressed in Table 8.
| Methods | Linear Regression Equation | LOD (µg/ml) | LOQ (µg/ml) |
|---|---|---|---|
| A | y =0.0463x−0.0403 (r²=0.9995) | 0.2 | 0.61 |
| B | y =0.0373x+0.1652 (r²=0.9993) | 0.32 | 0.97 |
| C | y =327.29x+5649.7 (r²=0.9992) | 0.03 | 0.12 |
Table 8: Sensitivity Studies of Flecainide Acetate.
Conclusion
The spectrophotometric and chromatographic methods are developed and validated successfully for estimation of Flecainide acetate. The determination of drug candidate was done by taking bulk as well as in pharmaceutical tablet formulation. The results of the analysis of pharmaceutical formulation by the proposed methods are reproducible and reliable. This indicates that there is no interference of excipients. All these developed spectrophotometric and chromatographic methods are found to be simple, accurate, precise, and economical when validated as per ICH guidelines. Thus the proposed method can be used for routine analysis of Flecainide acetate.
Acknowledgments
The authors are thankful to Life Sciences Pvt. Ltd, Mumbai, (India) for providing Flecainide acetate as a gift sample.
References
-
Chang SP, Welscher TM, Miller AM, McQuinn RL, Fox JM (1985) High-performance liquid chromatographic method for the quantitation of a meta-O-dealkylated metabolite of Flecainide Acetate, a new antiarrhythmic. Journal of Chromatography B: Biomedical Sciences and Applications 343: 119-127.
-
European Pharmacopeias (2004) 5th (Edn), Vol. I, European Pharmacopoeia Commission, Strasbourg, pp: 1598.
-
Benijts T, Borrey D, Lambert WE, De Letter EA, Piette MHA, et al. (2003) Analysis of Flecainide and two metabolites in biological specimens by HPLC: application to a fatal intoxication. J Anal Toxicol 27(1): 47-52.
-
El‐Ragehy NA, Hassan NY, Tantawy MA, Abdelkawy M (2016) Stability‐indicating chromatographic methods for determination of Flecainide Acetate in the presence of its degradation products; isolation and identification of two of its impurities. Biomedical Chromatography 30(10): 1541-1548.
-
Aliot E, Capucci A, Crijns HJ, Goette A, Tamargo J (2011) Twenty-five years in the making: Flecainide is safe and effective for the management of atrial fibrillation. Europace 13(2): 161-173.
-
European Pharmacopeias (1999) 3rd (Edn), European Pharmacopoeia Commission, Strasbourg, pp: 513.
-
British Pharmacopeias (2005) (Vol. III) The department of Health, Social Services and public safety, pp. 2476.
-
United States pharmacopoeia (2005) Government of U.S, pp: 826.
-
Patel J, Kevin G, Patel A, Raval M, Sheth N (2011) Development of the UV spectrophotometric method of Olmesartan medoxomil in bulk drug and pharmaceutical formulation and stress degradation studies. Pharmaceutical Methods 2(1): 36-41.
-
Snyder LR, Kirkland JJ, Glajchl JI (1988) Practical HPLC Method Development. 3rd (Edn), pp: 2-21 and 624-631.
-
ICH-Guidelines Q2 (R1) (2005) Validation of Analytical Procedures: Text and Methodology.
- Spectrophotometric Determination of Lanthanum (III) and Some Rare Earths with Xylenol Orange
- Introduction and Sources of Molluscicides
- Trimetazidine: An Antianginal Drug and Not Only!
- Nature Inspired Discovery and Development of Antibacterials: An Update
- Fungal Biodegradation of Polycyclic Aromatic Hydrocarbons (PAHs)
- Recent Approaches of Impurity Profiling in Pharmaceutical Analysis: A Concise Review