Assessment on the Level of Perception of Clinical Learning Environment among Undergraduate Nursing Students under Institute of Medicine, Tribhuwan University, Nepal
The study investigated undergraduate nursing students’ perceptions of the clinical learning environment (CLE) in Nepal. A sample of 117 undergraduate students from two nursing campuses under the Tribhuwan University was participated. A semi-structured self-administered questionnaire was used to assess various dimensions of the CLE, including pedagogical environment, personalization, student involvement, innovation, individualization, task orientation, and supervision. The findings revealed that approximately one-third of the students had a high perception level of the CLE. Student involvement received the highest mean score, while individualization and innovation scored lower. Results of the study suggest areas for improvement in the clinical education of nursing students in Nepal.
Abbreviations
CLE: Clinical Learning Environment; BSN: Bachelor of Science in Nursing; CLEI: Clinical Learning Environment Inventory.
Introduction
Nursing education encompasses both theoretical and clinical components, with clinical learning playing a predominant role [1]. The quality of the clinical learning environment significantly influences learning outcomes and the acquisition of skills and nursing students’ perception of this environment is crucial for patient care [2]. Understanding students’ perspectives on the clinical environment, which can evoke anxiety due to the balancing act between learning and professional demands, is essential [1, 3]. Student satisfaction, reflecting the fulfilment of educational expectations, serves as a key measure [4]. Discrepancies in studies regarding students’ perceptions underscore the necessity for this review to explore various contexts.
Clinical education is fundamental for the development of nurses’ practical skills. Creating an engaging clinical setting supports learning, with faculty involvement enhancing the environment [5]. Understanding multiple perspectives of the clinical learning environment, including physical surroundings, relationships, and teaching components, is crucial [6, 7]. Positive student-faculty relationships influence on learning outcomes [8, 9]. Clinical faculty must consider various factors affecting student relationships to guide them effectively [10]. Assessing students’ experiences and providing tailored learning opportunities are vital tasks for nurse educators [6, 11]. Faculty should focus on leadership, teaching, and creating authentic and motivational environments [12]. Effective communication and addressing psychological needs are crucial for student learning [7, 13]. Clinical faculty serves as intermediaries between the clinical environment and student learning, necessitating strategies to foster a positive environment [14].
The field of nursing education is witnessing rapid expansion in Nepal, evident in the increasing number of colleges and the availability of study levels ranging from PCL to PhD programs. Formal nursing education commenced in 1956 AD [15]. The Basic B.Sc. Nursing program, a four- year course, targets students who have completed their +2 education in the science stream with a major in biology. Notably, in 1996, Nepal introduced its first Four-year Generic Bachelor Nursing Programme (B.Sc. Nursing), initially enrolling 20 students at BPKIHS Dharan. Subsequently, in 2005 AD, this program was extended to Tribhuvan University [16].
Though many studies has been carried out in other countries, very few researches are found in researcher knowledge, that have been conducted in Nepal to assess the perception regarding CLE among nursing student [17]. Thus researcher has interested to study on perception regarding CLE among undergraduate nursing student. This research seeks to assess the conduct of clinical faculty as perceived by nursing students in the clinical setting, with a specific emphasis on improving positive coaching approaches. The study addresses questions regarding the influence of clinical faculty on the learning of nursing students and the methods employed by clinical faculty to foster student-centered learning within the clinical environment.
Materials and Methodology
Setting of the Study
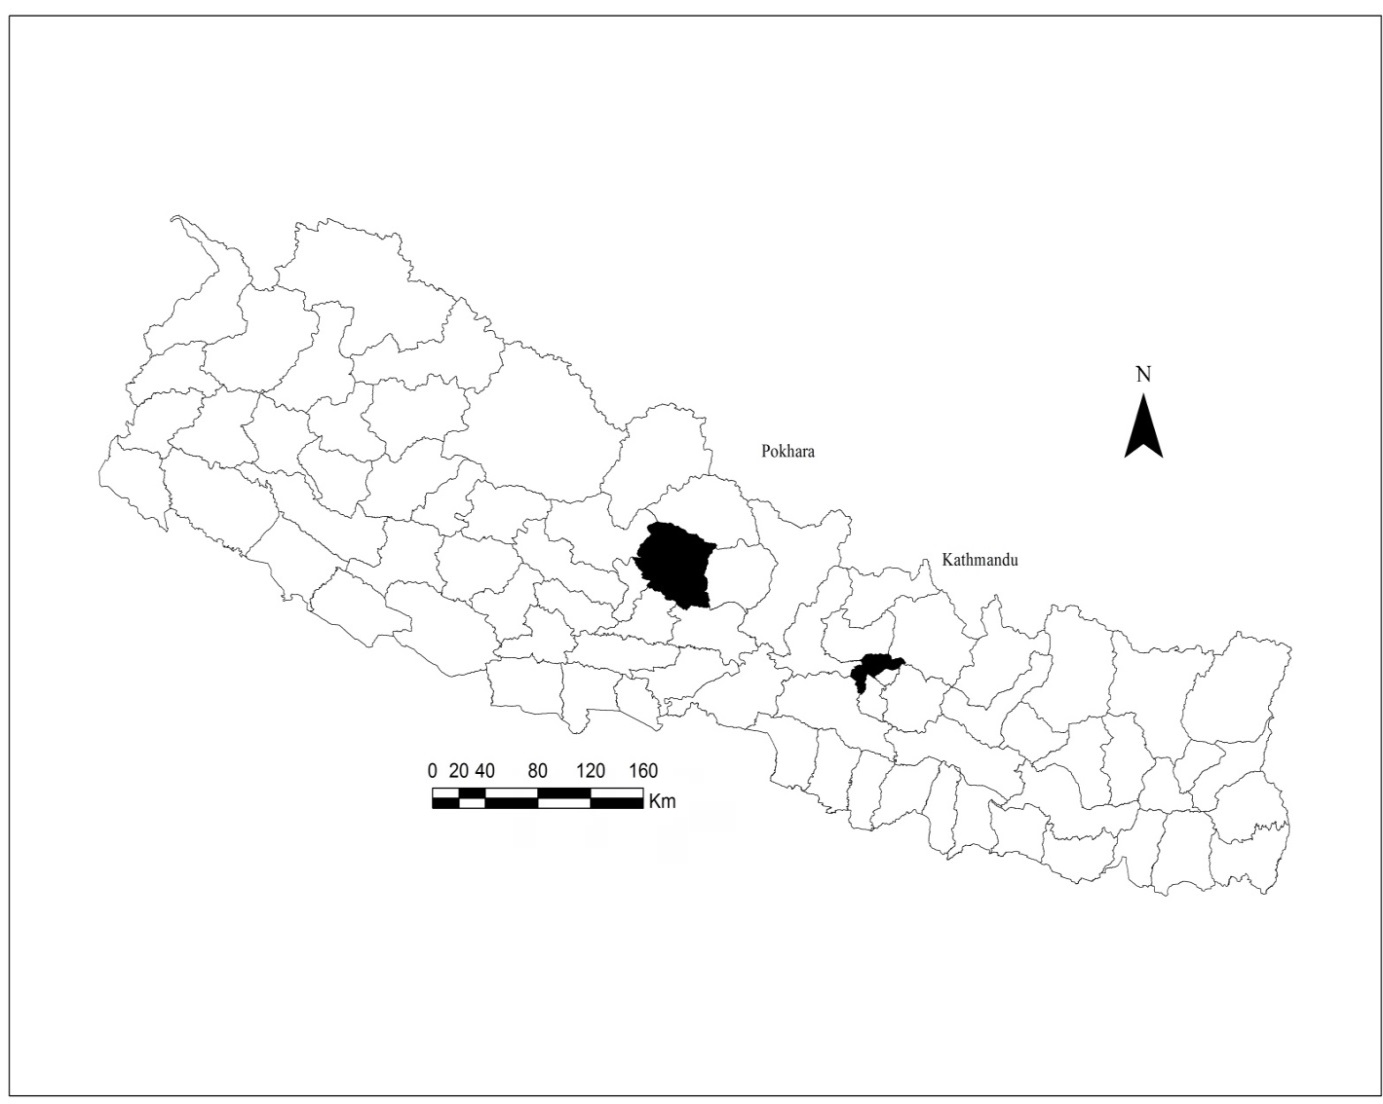
This study was conducted at Maharajgunj Nursing Campus and Pokhara Nursing Campus, both under the Institute of Medicine, Tribhuwan University, which is a leading institution in Nepal [18]. The B.Sc. nursing program was initiated at Maharajgunj Nursing Campus in 2005 and at Pokhara Nursing Campus in 2016. Maharajgunj Nursing Campus, established in 1956 AD, is a pioneering nursing institution in Nepal [19]. It offers various academic programs including Post Basic Bachelor of Nursing, Generic Bachelor of Science in Nursing, Master of Nursing, and PHD Nursing Program. Pokhara Nursing Campus, established in 1985 in Pokhara, Ramghat 12, was founded to provide nursing education. It operates as a constituent college of Tribhuwan University and offers a range of nursing academic programs including PCL in nursing, BNS, B.Sc. nursing, and Master in nursing, facilitated by experienced and qualified faculty members [20]. The selected study area is as shown in Figure 1.
Study Population Sampling Procedure
The study included all second years nursing students enrolled in the B.Sc. Nursing program at Maharajgunj Nursing Campus and Pokhara Nursing Campus under the Institute of Medicine, Tribhuwan University, who had completed more than 90% of practical work, were willing to participate, and were available during the data collection period. No Campus additional exclusion criteria were applied. Stratified random sampling with proportionate allocation was employed to select samples from Maharajgunj Nursing Campus and Pokhara Nursing Campus. The sample was chosen using a lottery method and the sampling sizes are as shown in Figure 2.
Maharajgunj Nursing Campus Pokhara Nursing Campus
Students Class
| 1st year | 2nd year | 3rd year |
|---|
No. of Students
| 40 | 40 | 36 |
|---|
Sample No.
| 29 | 29 | 26 |
|---|
The sample size was determined using a formula based on the percentage of students perceiving the Clinical Learning Environment (CLE) as “very good” in a similar study conducted in Vellore, India [21]. The total population was 176, and after considering a confidence level of 95% and an allowable error of 5%, the sample size was calculated to be 117. Adding a 10% non-response rate, the total sample size became 128.
Research Tool
A semi-structured self-administered questionnaire is a research tool used to collect data from participants in a study. In a semi-structured questionnaire, there is a predetermined set of questions or topics to guide the inquiry, but respondents have some flexibility in how they answer and can provide additional information beyond the predefined options and self-administered means that participants complete the questionnaire on their own, without direct involvement from the researcher. Thus, a semi-structured self-administered questionnaire provides a framework for data collection while allowing respondents some freedom in their responses, making it a versatile tool for gathering information in research studies.
| 1st year | 2nd year | 3rd year |
|---|
| 20 | 20 | 20 |
|---|
| 15 | 15 | 15 |
|---|
In this study, the data was collected using a semi- structured self-administered questionnaire comprising two parts: i) socio-demographic information and ii) perceptions of the clinical learning environment. The questionnaire was validated through extensive literature review and pretesting, ensuring reliability [22, 23, 24, 25]. The initial segment involved inquiries regarding the socio-demographic characteristics of the participants, which were devised by the researcher. The subsequent section evaluated perceptions of the clinical learning environment using a 5-point Likert scale, ranging from “strongly disagree” to “strongly agree,” across 42 statements, yielding a total score of 210. The items in this section were adapted from [26, 27]. Clinical Learning Environment Inventory (CLEI), covering seven dimensions: pedagogical environment, personalization, innovation, student involvement, individualization, task orientation, and supervision.
Validity and Reliability
Validity and reliability assessments were conducted to ensure the quality of the tool. Content validity for parts I and II was established through a non-statistical approach, including extensive literature review, consultation with a research advisor, subject matter experts, and research professionals.
Reliability was ensured by pretesting the tool among 10% of the total sample size (117 students), resulting in a sample of 12 participants from the Manmohan Memorial Institute of Health Sciences, Kathmandu, Nepal. This pretest aimed to evaluate the practicality and applicability of the questionnaire and estimate the time required for completion. Necessary modifications were made based on the pretest results, guided by the supervisor. For the reliability analysis of part II, Cronbach’s alpha coefficient was computed for the total scale, yielding a value of 0.716 (ranging from 0.501 to 0.76 among dimensions).
Data Collection Procedure
Permission was obtained from the research committee of Maharajgunj Nursing Campus, and ethical approval was obtained from the Institutional Review Board of the Institute of Medicine, Tribhuwan University. Formal permission was also obtained from Maharajgunj Nursing Campus and Pokhara Nursing Campus. Informed consent was obtained from participants, confidentiality and anonymity were ensured, and data was collected by the researcher over a period of four weeks.
Data Analysis
Data was edited, coded, and entered into SPSS VERSION 20. The assessment of missing data was conducted using Little’s Missing Completely at Random test, as suggested by Li C [28]. The results of the test indicated that the missing data occurred randomly and were not statistically significant. Descriptive statistics were used to summarize the data, including percentages, means, and standard deviations. Inferential statistics, such as the chi-square test and Pearson’s correlation, were employed to analyze associations and relationships.
Results of Study
Demographic Characteristics
In terms of socio-demographic information, Table 1 reveals that the majority of respondents, comprising 71.3%, are over 20 years old, with a mean age of 19.88 and a standard deviation of ±1.12. The religious beliefs of the respondents indicate that 93% identify with Hinduism, while only 1.6% identify with Christianity. Ethnically, approximately two- thirds (69%) identify as Brahmin/Chhetri, whereas only 1.6% identify as Madhesi. Furthermore, 89.9% of respondents come from nuclear families, while the remaining 10.1% belong to joint families. Regarding living arrangements, approximately three-fourths (77.5%) of respondents reside in hostels, with the remaining 22.5% living at home.
| Characteristics | Number | Percent |
|---|---|---|
| Age in completed yrs. | ||
| ≤ 20 | 92 | 71.3 |
| >20 | 37 | 28.7 |
| Religious | ||
| Hinduism | 120 | 93 |
| Buddhism | 7 | 5.4 |
| Christianity | 2 | 1.6 |
| Ethnicity | ||
| Brahmin/ Chhetri | 89 | 69 |
| Janajati | 33 | 25.6 |
| Dalit | 5 | 3.9 |
| Madhesi | 2 | 1.6 |
| Academic Year | ||
| B.Sc. 1st year | 44 | 34.1 |
| B.Sc. 2nd year | 44 | 34.1 |
| B.Sc. 3rd year | 41 | 31.8 |
| Type of Family | ||
| Nuclear | 116 | 89.9 |
| Joint | 13 | 10.1 |
| Residence | ||
| Hostel | 100 | 77.5 |
| Home | 29 | 22.5 |
| Exposure in Clinical Practice this Year | ||
| Fundamental | 44 | 34.1 |
| Midwifery & Pediatric | 44 | 34.1 |
| Adult, Geriatric & Psychiatric | 41 | 31.8 |
| Duration of Exposure Completed in Weeks | ||
| 16 | 44 | 34.1 |
| 21 | 41 | 31.8 |
| 29 | 29 | 22.5 |
| 30 | 15 | 11.6 |
Table 7: Socio-Demographic Characteristics of the Respondents.
In terms of clinical practice exposure, 34.1% of respondents practiced fundamental nursing, 34.1% practiced midwifery and pediatrics, and 31.8% practiced adult, geriatric, and psychiatric care during the current year.
Students’ Perceptions of the University Supervision and Guidance Environment
Regarding supervision and guidance, Table 2 indicates that the majority of respondents (58.1%) were consistently supervised and guided by clinical nurses. Additionally, 23.3% received supervision from clinical teachers, while 18.6% received guidance from both clinical teachers and clinical nurses.
| Variables | Always | Often | Sometime | |||
|---|---|---|---|---|---|---|
| NO | % | NO | % | NO | % | |
| Clinical Nurse | 75 | 58.1 | 24 | 18.6 | 30 | 23.3 |
| Clinical teacher | 30 | 23.3 | 68 | 52.7 | 31 | 24 |
| Both Clinical Nurse & Teacher | 24 | 18.6 | 38 | 29.5 | 67 | 51.9 |
Table 8: Supervision and Guidance in Clinical Learning Environment.
Student’ Perception on Pedagogical Atmosphere
Regarding students’ perception of the pedagogical atmosphere, Table 3 illustrates that half of the respondents (51.2%) agreed that the staff were easily approachable in the ward. Nearly half (47.3%) of the respondents agreed that they felt comfortable going to the ward at the start of their shift. Similarly, a majority (56.6%) of respondents agreed that there was a positive atmosphere for meaningful learning situations on the ward. However, one-third (33.3%) of respondents disagreed that the staff were generally interested in student supervision. Additionally, 41.1% of respondents disagreed that the staff learned to know the students by their personal names. On the other hand, more than half (55.8%) of respondents agreed that the learning situation was multidimensional in terms of content.
The highest mean score for the pedagogical atmosphere was (3.62 ± 0.82) for “there was a positive atmosphere for meaningful learning situations on the ward,” while the lowest was (1.05 ± 1.05) for “the learning situation was multidimensional in terms of content.”
| Statements | Responses | |||||
|---|---|---|---|---|---|---|
| SD | D | U | A | SA | Mean ± SD | |
| NO (%) | NO (%) | NO (%) | NO (%) | NO (%) | ||
| The staff were easy to approach in the ward | 2 | 21 | 29 | 66 | 11 | 3.49±0.92 |
| -1.6 | -16.3 | -22.5 | -51.2 | -8.5 | ||
| I felt comfortable going to the ward at the start of my shift | 7 | 34 | 22 | 61 | 5 | 3.18±1.05 |
| -5.4 | -26.4 | -17.1 | -47.3 | -3.9 | ||
| There was a positive atmosphere for meaningful learning situation on the ward | 3 | 8 | 35 | 73 | 10 | 3.62±0.82 |
| -2.3 | -6.2 | -27.1 | -56.6 | -7.8 | ||
| The staffs were generally interested in student supervision | 5 | 43 | 42 | 37 | 2 | 2.91±0.92 |
| -3.9 | -33.3 | -32.6 | -28.7 | -1.6 | ||
| The staff learned to know the student by their personal names | 2 | 53 | 28 | 23 | 3 | 2.48±1.05 |
| -17.1 | -41.1 | -21.7 | -17.8 | -2.3 | ||
| The learning situation multidimensional in term of content (medical equipment, case availability, supportive staff) | 7 | 12 | 27 | 72 | 11 | 1.05±1.05 |
| -5.4 | -3.3 | -20.9 | -55.8 | -8.5 |
Table 9: Respondents’ Perception on Pedagogical Atmosphere.
n=117 Table 3: Respondents’ Perception on Pedagogical Atmosphere.
Students’ Perception on Personalization
In response to students’ perception of personalization, Table 4 indicates that nearly half (42.6%) of the respondents agreed that clinical teachers consider students’ feelings. Regarding individual communication with students, a majority (59.7%) of respondents agreed that clinical teachers talk individually with students whenever needed. Moreover, more than half (59.7%) of the respondents agreed that clinical teachers help students who have problems or difficulties with clinical work, followed by (52.7%) who agreed that clinical teachers are friendly and understanding towards students. Similarly, (42.6%) of respondents agreed that clinical teachers regularly visit the ward to talk to students. Additionally, more than one-third (39.6%) of respondents agreed that clinical teachers are interested in students’ personal and academic problems and try to solve them.
The highest mean score was 3.6 ± 0.85 for “the clinical teacher helps students who have problems or difficulties with clinical work,” while the lowest was 3.13 ± 1.00 for “the clinical teacher is interested in students’ personal and academic problems and tries to solve them.”
| Statements | Responses | |||||
|---|---|---|---|---|---|---|
| SD | D | U | A | SA | Mean ± SD | |
| No (%) | No (%) | No (%) | No (%) | No (%) | ||
| The clinical teacher consider students’ feeling | 10 | 30 | 33 | 55 | 1 | 3.05±1.00 |
| -7.8 | -23.3 | -25.6 | -42.6 | -0.8 | ||
| The clinical teacher talk individually with students whenever needed | 3 | 11 | 27 | 77 | 11 | 3.63±0.84 |
| -2.3 | -8.5 | -20.9 | -59.7 | -8.5 | ||
| The clinical teacher helps the student who have problem or difficulty with the clinical work | 3 | 11 | 27 | 77 | 11 | 3.64±0.85 |
| -2.3 | -8.5 | -20.9 | -59.7 | -8.5 | ||
| The clinical teacher is friendly and understanding towards students | 4 | 15 | 40 | 68 | 2 | 3.38±0.84 |
| -3.1 | -11.6 | -31 | -52.7 | -1.6 | ||
| The clinical teacher regularly goes around to the ward to talk to the students | 5 | 27 | 35 | 55 | 7 | 3.25±0.98 |
| -3.9 | -20.9 | -27.1 | -42.6 | -5.4 | ||
| The clinical teacher is interested in students’ personal & academic problems and try to solve them | 6 | 33 | 34 | 51 | 5 | 33.13±1.00 |
| -4.7 | -25.6 | -26.4 | -39.6 | -3.9 |
Table 10: Respondents’ Perception on Personalization.
n=117 Table 4: Respondents’ Perception on Personalization.
Students’ Perception on Student Involvement
As shown in Table 5 reveals that nearly half (47.3%) of the respondents agreed that clinical teachers always talk more rather than listen to the students. Additionally, close to one-third (28.7%) of the respondents agreed that students put effort into the activities they do in the ward. However, a majority of respondents (70.5%) agreed that students pay attention to what others are saying and doing in the ward. Concerning whether clinical teachers encourage debriefing sessions, (63.6%) of respondents agreed. Similarly, more than one-third (39.5%) of respondents agreed that there are opportunities for students to express their opinions in the clinical ward. Furthermore, (41.1%) of respondents agreed that students have enough opportunities to be involved in the process of handing over to staff for the next shift.
The highest mean score was 4.1 ± 0.64 for “students pay attention to what others are saying and doing in the ward,” while the lowest mean score was 0.78 ± 0.93 for “there are opportunities for students to express their opinions in the clinical ward.”
| Statements | Responses | |||||
|---|---|---|---|---|---|---|
| SD | D | U | A | SA | Mean ±SD | |
| No (%) | No (%) | No (%) | No (%) | No (%) | ||
| The clinical teacher always talk more rather than listens to the students* | 3 | 29 | 25 | 61 | 11 | 2.6±1.00 |
| -2.3 | -22.5 | -19.4 | -47.3 | -8.5 | ||
| Students put effort into the activities what they do in the ward. | 0 | 2 | 10 | 80 | 37 | 4.18±0.64 |
| -1.6 | -7.8 | -62 | -28.7 | |||
| Students pay attention to what others are saying and doing in the ward | 0 | 4 | 7 | 91 | 27 | 4.18±0.62 |
| -3.1 | -5.4 | -70.5 | -20.9 | |||
| The clinical teacher encourage debriefing (reviews of the actions or activities taken in the ward) sessions | 2 | 8 | 26 | 82 | 11 | 3.72±0.78 |
| -1.6 | -6.3 | -20.2 | -63.6 | -8.6 | ||
| There are opportunities for students to express their opinions in the clinical ward | 6 | 25 | 44 | 51 | 3 | 0.78±0.93 |
| -4.7 | -19.4 | -34.1 | -39.5 | -2.3 | ||
| Students have enough opportunity to involve in the process of handing over to staff in the ward for the next shift | 9 | 27 | 22 | 53 | 18 | 3.35±1.17 |
| -7 | -20.9 | -17.1 | -41.1 | -14 |
Table 11: Respondents’ Perception on Student Involvement.
n=117 Table 5: Respondents’ Perception on Student Involvement.
Students Perception on Innovation
Table 6 illustrates that more than one-third (35.7%) of the respondents agreed that new ideas are always tried out for patient care in the ward. Concerning the utilization of new and different ways of clinical teaching for students, close to one-third (31.8%) of respondents agreed. Similarly, nearly half (45.7%) of respondents agreed that clinical teachers or supervisors devise innovative activities and teaching approaches for students. Additionally, almost half (46.3%) of respondents agreed that students seem to do the same type of tasks in every shift. However, one-third (34.1%) of respondents disagreed that clinical teachers or supervisors often think of interesting activities for students. Regarding whether the same ward staff member works with students for most of their placement, one-third (34.9%) of respondents disagreed.
The highest mean score was 3.58 ± 1.13 for “students seem to do the same type of tasks in every shift,” while the lowest mean score was 2.32 ± 1.09 for “students seem to do the same type of tasks in every shift.”
| Statements | Responses | |||||
|---|---|---|---|---|---|---|
| SD | D | U | A | SA | Mean ± SD | |
| No (%) | No (%) | No (%) | No (%) | No (%) | ||
| New ideas are always tried out for the patient care in the ward | 9 | 32 | 36 | 46 | 6 | 3.06±1.04 |
| -7 | -24.8 | -27.9 | -35.7 | -4.7 | ||
| New and different ways of clinical teaching to the students are always used in the ward | 12 | 31 | 36 | 41 | 9 | 3.03±1.10 |
| -9.3 | -24 | -27.9 | -31.8 | -7 | ||
| The clinical teacher or supervisor thinks up innovative activities and teaching approaches for students. | 8 | 18 | 41 | 59 | 3 | 3.24±0.94 |
| -6.2 | -14 | -31.8 | -45.7 | -2.3 | ||
| Students seem to do the same type of tasks in every shift * | 5 | 23 | 21 | 52 | 28 | 2.32±1.09 |
| -3.9 | -17.8 | -16.3 | -40.3 | -21.7 | ||
| The clinical teacher or supervisor often thinks of interesting activities for the students | 19 | 44 | 39 | 24 | 3 | 2.6±1.03 |
| -14.7 | -34.1 | -30.2 | -18.6 | -2.3 | ||
| The same ward staff member works with the students for most of this placement | 11 | 45 | 40 | 31 | 2 | 2.75±2.75 |
| -8.5 | -34.9 | -31 | -24 | -1.6 |
Table 12: Respondents’ Perception on Innovation.
n=117 Table 6: Respondents’ Perception on Innovation.
Students’ Perception on Individualization
Table 7 presents the perception on individualization, indicating that nearly half (45.7%) of the respondents agreed that all staff in the ward are expected to do the same work in the same way. Conversely, around half (41.1%) of respondents disagreed that students are generally allowed to work at their own pace. Similarly, almost half (46.5%) of the respondents disagreed that students are allowed to negotiate their workload in the ward. Regarding the perception that there is little opportunity for a student to pursue their particular interest in this ward, one-third (35.7%) of respondents agreed. Additionally, nearly half (44.2%) of respondents agreed that teaching approaches allow students to proceed at their own pace.
The highest mean score was 2.79 ± 1.13 for “all staff in the ward are expected to do the same work in the same way,” while the lowest mean score was 1.09 ± 0.95 for “teaching approaches allow students to proceed at their own pace.”
| Statements | Responses | |||||
|---|---|---|---|---|---|---|
| SD | D | U | A | SA | Mean ± SD | |
| No (%) | No (%) | No (%) | No (%) | No (%) | ||
| All staff in the ward are expected to do the same work in the same way* | 10 | 36 | 18 | 59 | 6 | 2.79±1.13 |
| -7.8 | (27. 9) | -14 | -45.7 | -4.7 | ||
| Students are generally allowed to work at their own pace | 16 | 53 | 21 | 35 | 4 | 2.67±1.10 |
| -12.4 | -41.1 | -16.3 | -27.1 | -3.1 | ||
| Students are allowed to negotiate their work load in the ward | 25 | 60 | 19 | 21 | 4 | 2.37±1.07 |
| -19.4 | -46.5 | -14.7 | -16.3 | -3.1 | ||
| There is little opportunity for a student to pursue her particular interest in this ward* | 9 | 23 | 37 | 46 | 14 | 2.72±1.08 |
| -7 | -17.8 | -28.7 | -35.7 | -10.9 | ||
| Teaching approaches allow students to proceed at their own pace | 4 | 36 | 30 | 57 | 2 | 1.09±0.95 |
| -3.1 | -27.9 | -23.3 | -44.2 | -1.6 |
Table 13: Respondents’ Perception on Individualization.
n=117 Table 7: Respondents’ Perception on Individualization.
Students’ Perception on Task Orientation
Table 8 presents that more than half (54.3%) of the respondents agreed that ward staff and students are often punctual on duty in the ward. Similarly, over half (56.6%) of the respondents agreed that ward assignments are clear, allowing students to know what to do in the ward. Regarding the organization of the clinical placement, 43.4% of respondents agreed that getting a certain amount of work done is important in this ward, while nearly two- thirds (63.6%) agreed. Additionally, 43.4% of respondents gave an uncertain response regarding whether the clinical teacher often gets side tracked instead of sticking to the point. Concerning workload allocation, nearly half (44.2%) of the respondents agreed that it is carefully planned for the students. Furthermore, half of the respondents (51.9%) strongly agreed that there was clear communication and information flow related to patients’ care in the ward. Regarding the documentation of nursing care, more than half (59.7%) of the respondents agreed.
The highest mean score was observed for “ward assignments are clear so that students know what to do in the ward” (3.85 ± 0.86), along with the documentation of nursing care (3.85 ± 2.74). Conversely, the lowest mean score was recorded for “the clinical teacher often gets sidetracked instead of sticking to the point” (2.68 ± 0.78).
| Statements | Responses | |||||
|---|---|---|---|---|---|---|
| SD | D | U | A | SA | Mean ± SD | |
| No (%) | No (%) | No (%) | No (%) | No (%) | ||
| Ward staffs and students are often punctual on duty of the ward | 4 | 14 | 17 | 70 | 24 | 3.74±099 |
| -3.1 | -10.9 | -13.2 | -54.3 | -18.6 | ||
| Ward assignments are clear so that students know what to do in the ward | 1 | 11 | 19 | 73 | 25 | 3.85±0.86 |
| -0.8 | -8.5 | -14.7 | -56.6 | -19.4 | ||
| This is an organized clinical placement | 8 | 18 | 33 | 56 | 14 | 3.39±1.06 |
| -6.2 | -14.2 | -25.6 | -43.4 | -10.9 | ||
| Getting a certain amount of work done is important in this ward | 0 | 11 | 25 | 82 | 11 | 3.72±0.74 |
| -8.5 | -19.4 | -63.6 | -8.5 | |||
| The clinical teacher often gets sidetracked instead of sticking to the point* | 3 | 21 | 56 | 45 | 4 | 2.68±0.78 |
| -2.3 | -16.3 | -43.4 | -34.9 | -3.1 | ||
| Workload allocation in the ward is carefully planned for the students. | 10 | 33 | 25 | 57 | 4 | 3.09±1.06 |
| -7.8 | -25.6 | -19.4 | -44.2 | -3.1 | ||
| There was clear communication and information flow related to patients’ care in the ward | 2 | 25 | 27 | 67 | 8 | 3.42±0.92 |
| -1.6 | -19.4 | -20.9 | -51.9 | -6.2 | ||
| Documentation of nursing care (nursing plan, daily recording of nursing procedure) was clear in the ward | 2 | 19 | 18 | 77 | 13 | 3.85±2.74 |
| -1.6 | -14.7 | -14 | -59.7 | -10 |
Table 14: Respondents’ Perception on Task Orientation.
n=117 Table 8: Respondents’ Perception on Task Orientation.
Students’ Perception on Supervision
Table 9 illustrates that more than one third (40.3%) of the respondents disagreed that they felt each student received individual supervision. Conversely, over half (56.6%) of the respondents agreed that students continuously received feedback from the clinical supervisor. Regarding supervision based on a relationship of equality and promoted by learning, nearly half of the respondents (44.2%) agreed.
Concerning mutual interaction and respect in the supervisory relationship, nearly two-thirds (48.8%) of the respondents agreed. Similarly, almost two-thirds (61.2%) of the respondents agreed that the supervisory relationship was characterized by a sense of trust.
The highest mean score of 3.74 ± 0.92 was obtained for “students continuously received feedback from the clinical supervisor.”
| Statements | Responses | |||||
|---|---|---|---|---|---|---|
| SD | D | U | A | SA | Mean± SD | |
| No (%) | No (%) | No (%) | No (%) | No (%) | ||
| I felt each student received individual supervision | 16 | 52 | 24 | 30 | 7 | 2.69±1.12 |
| -12.4 | -40.3 | -18.6 | -23.3 | -5.4 | ||
| Students continuously received feedback from the clinical supervisor. | 2 | 15 | 18 | 73 | 21 | 3.74±0.92 |
| -1.6 | -11.6 | -14 | -56.6 | -16.3 | ||
| The supervision was based on a relationship of a equality and promoted by learning | 2 | 26 | 40 | 57 | 4 | 3.27±0.87 |
| -1.6 | -20.2 | -31 | -44.2 | -3.1 | ||
| There was a mutual interaction and respect in the supervisory relationship | 2 | 12 | 49 | 63 | 3 | 3.41±0.76 |
| -1.6 | -9.3 | -38 | -48.8 | -2.3 | ||
| The supervisory relationship was characterized by a sense of trust | 1 | 14 | 29 | 79 | 6 | 3.58±0.78 |
| -0.8 | -10.9 | -22.5 | -61.2 | -4.7 |
Table 15: Respondents’ Perception on Supervision.
Students’ Perception on Different Dimensions of CLE
Table 10 displays the scores for different dimensions of the clinical learning environment as perceived by the respondents. The highest score was obtained for student involvement (3.51 ± 0.40), followed by task orientation (3.44 ± 0.50). Conversely, the lowest score was obtained for individualization (2.73 ± 0.54).
| Different Dimension | Minimum | Maximum | Mean | SD |
|---|---|---|---|---|
| Student Involvement | 2.17 | 4.33 | 3.54 | 0.4 |
| Task orientation | 2 | 4.38 | 3.44 | 0.5 |
| personalization | 1 | 5 | 3.36 | 0.64 |
| Supervision | 1.6 | 5 | 3.33 | 0.56 |
| Pedagogical Atmosphere | 1.67 | 4.67 | 3.19 | 0.59 |
| Innovation | 1 | 4.33 | 2.83 | 0.63 |
| Individualization | 1.4 | 4 | 2.73 | 0.54 |
Table 16: Obtained Mean Score in Different Dimension of Clinical Learning Environment
Students’ Perception on Distribution of the CLE
Table 11 illustrates the distribution of respondents’ perceptions of the clinical learning environment. More than one third (34.9%) of respondents had a high perception, while 42 (32.6%) had a moderate perception, and another 42 (32.6%) had a high level of perception regarding the clinical learning environment. The mean score of respondents’ perception was 3.29.
| Level of Perception | Number | Percent |
|---|---|---|
| High ( > 66.6 percentile) | 45 | 34.9 |
| Moderate ( 33.3-66.6 percentile) | 42 | 32.6 |
| Low (< 33.3 percentile) | 42 | 32.6 |
Table 17: Overall Level of Students’ Perception on Clinical Learning Environment.
Discussion
This study examined nursing students’ perceptions of the clinical learning environment across various dimensions. The findings reveal insights into the levels of perception and highlight specific areas of strengths and weaknesses.
In terms of overall perception levels, approximately one third of respondents had high, moderate, and low levels of perception regarding the clinical learning environment, with an average mean score of 3.29. Comparisons with studies conducted in Vellore, India [21], and elsewhere indicate variations in perception levels among nursing students.
Across different dimensions of the clinical learning environment, notable findings emerged. Regarding the pedagogical environment referring Table 3, respondents generally perceived a positive atmosphere for meaningful learning situations, although challenges were identified in terms of multidimensional content learning. Similar studies in other regions have reported varying perceptions of the pedagogical environment, suggesting contextual differences.
Personalization, as another dimension in Table 4, revealed mixed perceptions. While students acknowledged assistance from clinical teachers with clinical work, there were lower levels of agreement regarding teachers’ interest in students’ personal and academic problems. Studies from Greece, Iran, and Myanmar offer comparisons, indicating the importance of personalized support in enhancing the learning experience [29, 30].
Student involvement received the highest mean score among the dimensions assessed, indicating active participation and attentiveness in ward activities. However, opportunities for students to express their opinions were perceived to be limited, suggesting areas for improvement in fostering student engagement.
Innovation, individualization, and task orientation dimensions presented challenges as shown in Tables 5-7, with lower mean scores indicating areas of concern such as repetitive tasks and limited decision-making opportunities for students. Comparisons with studies from other regions highlight consistent issues across different contexts, emphasizing the need for innovative teaching approaches and tailored learning experiences.
Supervision emerged as a crucial aspect, with respondents generally agreeing on receiving continuous feedback from clinical supervisors. However, disparities in perception levels were observed across studies, suggesting variations in supervision quality and effectiveness.
Overall, the findings underscore the importance of addressing areas of concern while building on existing strengths to enhance the clinical learning environment for nursing students. By focusing on personalized support, active student involvement, and effective supervision practices, nursing education programs can optimize the learning experience and better prepare students for their future roles in healthcare.
Conclusion
In conclusion, this study offers valuable insights into nursing students’ perceptions of the clinical learning environment, highlighting both strengths and areas for improvement across various dimensions. The findings underscore the significance of organizational effectiveness, supervision quality, and student engagement in shaping the overall learning experience. The positive perceptions regarding punctuality, clear assignments, and continuous feedback underscore the strengths of the clinical placements under investigation. However, the study also identifies areas for enhancement, particularly in individualized supervision and mitigating distractions during supervision sessions.
Moreover, the variability in perceptions across different dimensions of the clinical learning environment emphasizes the complex nature of student experiences. While student involvement and task orientation received commendable scores, challenges in individualization suggest the need for tailored approaches to cater to diverse learning needs.
Overall, the study indicates a generally positive perception of the clinical learning environment among nursing students, alongside identifiable areas for improvement. Addressing these areas holds the potential to foster a more supportive, engaging, and effective learning environment. Looking ahead, it is crucial for nursing educators and clinical supervisors to integrate these findings into curriculum development, supervision practices, and organizational management. By addressing identified areas for improvement and leveraging existing strengths, nursing education programs can better equip students for their future roles as competent and empathetic healthcare professionals.
References
-
Alatawi A, Domantay AA, Alatawi M, Qawwadi S, Alhiri M, et al. (2020) Nursing Students’ Satisfaction of the Clinical Learning Environment in Saudi Arabia. International Journal of Nursing Didactics 10(06): 9-17.
-
Neupane N, Pandey N, Sah SK (2018) Postnatal Care of the Mother and Newborn Geneva. International Journal of Advanced Microbilogy and Health Research 2(1): 36- 41.
-
Boylston MT, Jackson C (2008) Adult Student Satisfaction in an Accelerated RN-to-BSN Program: A Follow-Up Study. J Prof Nurs 24(5): 285-295.
-
Kabanya CN, Karani AK, Mirie W (2017) Determinants of Satisfaction with Training Process among Final Year Nursing Students at Kenya Medical Training College. Biomedical Journal of Scientific & Technical Research 1(4): 4-9.
-
Souza MS, Karkada SN, Parahoo K, Venkatesaperumal R (2015) Perception of and Satisfaction with the Clinical Learning Environment among Nursing Students. Nurse Educ Today 35(6): 833-840.
-
Flott EA, Linden L (2016) The Clinical Learning Environment in Nursing Education: A Concept Analysis. J Adv Nurs 72(3): 501-513.
-
Subke J, Downing C, Kearns I (2020) Practices of Caring for Nursing Students: A Clinical Learning Environment. Int J Nurs Sci 7(2): 214-219.
-
Papastavrou E, Dimitriadou M, Tsangari H, Andreou C (2016) Nursing Students’ Satisfaction of the Clinical Learning Environment: A Research Study. BMC Nursing 15(1): 1-10.
-
Riet PVD, Jones TL, Pratt HC (2018) Nursing Students’ Perceptions of a Collaborative Clinical Placement Model: A Qualitative Descriptive Study. Nurse Educ Pract 30: 42- 47.
-
Ramsbotham J, Dinh H, Truong H, Huong N, Dang T (2019) Evaluating the Learning Environment of Nursing Students: A Multisite Cross-Sectional Study. Nurse Education Today 79: 80-85.
-
Phillips KF, Mathew L, Aktan N, Sandanapitchai P (2019) The Effectiveness of Shared Clinical Teaching in Nursing. Int J Nurs Sci 6(2): 211-215.
-
Haraldseid C, Friberg F, Aase K (2015) Nursing Students’ Perceptions of Factors Influencing their Learning Environment in a Clinical Skills Laboratory: A Qualitative Study. Nurse Educ Today 35(9): e1-e6.
-
Jamshidi N, Molazem Z, Sharif F, Torabizadeh C, Kalyani MN (2016) The Challenges of Nursing Students in the Clinical Learning Environment: A Qualitative Study. Scientific World Journal pp: 1-8.
-
Kamphinda S, Chilemba EB (2019) Clinical Supervision and Support: Perspectives of Undergraduate Nursing Students on their Clinical Learning Environment in Malawi. Curationis 42(1): e1-e10.
-
Chhetri B, Koirala P (2017) Current Status, Issues and Challenges in Nursing. Nursing Forum BBMed 1(1): 73- 78.
-
Shrestha P, Paudel K, Pokharel AS (2020) An Overview of Nursing Education in Nepal. Journal of Universal College of Medicine Sciences 8(1): 74-79.
-
Das N, Chaudhary GP, Yadav S, Yadav U, Yadav AK, et al. (2023) Perception of Nepalese Nursing Students toward E‑learning in Nepal. J Educ Health Promot 12: 1-6.
-
Rai KK, Tamang N, Rai S (2020) Growing Attraction of Nursing Education in Nepal-Issue of Quality And Quantity. Archives of Nursing and Care 3(3).
-
Sigdel R (2011) Nursing Education in Nepal: Historical Perspective History. Health Prospect 10: 89-90.
-
Gharti K, Poudel A, Koirala R, Tamrakar DL, Suvedi M, et al. (2019) Annual Report. In Tribhuvan University, Institute of Medicine, Pokhara Nursing Campus.
-
Angelin EA, Emiley SD, Amala R, Grace R (2018) Undergraduate Nursing Students’ Perception on Clinical Learning Environment. International Journal of Nursing Education and Research 6(2): 173-178.
-
DeJonckheere M, Vaughn LM (2019) Semistructured Interviewing in Primary Care Research: A Balance of Relationship and Rigour. Fam Med Community Health 7(2): 1-8.
-
Belisario JSM, Jamsek J, Huckvale K, Donoghue OJ, Morrison CP, et al. (2015) Comparison of Self- Administered Survey Questionnaire Responses Collected using Mobile Apps Versus Other Methods. Cochrane Database Syst Rev (7): MR000042.
-
Leeuw ED (2012) Self-Administered Questionnaires and Standardized Interviews. The Sage Handbook of Social Research Methods pp: 313-327.
-
Saunders C, Kulchitsky J (2021) Enhancing Self- Administered Questionnaire Response Quality Using Code of Conduct Reminders. International Journal of Market Research 63(6): 715-737.
-
Saarikoski M, Isoaho H, Warne T, Kilpi HL (2008) The Nurse Teacher in Clinical Practice: Developing the New Sub-Dimension to the Clinical Learning Environment and Supervision (CLES) scale. Int J Nurs Stud 45(8): 1233-1237.
-
Chan DSK (2003) Validation of the Clinical Learning Environment Inventory. West J Nurs Res 25(5): 519-532.
-
Li C (2013) Little’s Test of Missing Completely at Random. Stata Journal 13(4): 795-809.
-
Aye SH, Agezew BH, Iranfar A, Kovacs KE (2023) The International Comparison of the Educational Systems of Iran, Myanmar and Ethiopia. Central European Journal of Educational Research 5(1): 84-94.
-
Tawafak RM, Romli A, Malik SI, Shakir M, Alfarsi GM (2019) A Systematic Review of Personalized Learning: Comparison between E-Learning and Learning by Coursework Program in Oman. International Journal of Emerging Technologies in Learning 14(9): 93-104.
- Teaching Cognitive Behavioral Therapy to Graduate Psychiatric Mental Health Nurse Practitioner Students: Utilizing A Mixed Methods Course Evaluation
- The Role of Pharmacogenetic Testing in Clinical Practice: A Path toward more Effective, Personalized and Cost-effective Care
- Implementing Screening with the GAD-7 in an Outpatient Mental Health Setting: A Quality Improvement Project
- Social Media and Health Promotion
- Impact of Covid-19 Pandemic on the Academic Performance and Attitude of Nursing Students towards E-Learning
- A Study to Assess the Knowledge Regarding Ill Effects of Tobacco Consumption on Health among Adolescents in Selected Higher Secondary School in Nadiad City