Optical Properties of Carbon Doped by Nano Particle Titanium Dioxide to Enhance Solar Energy Absorption
The optical properties of carbon doped titanium oxide TiO2 were studied. The specimen prepared by utilizing spray pyrolysis method. The absorption coefficient, extinction coefficient, direct, indirect band gap, Urbach’s energy and high-frequency dielectric consistent with real and imaginary were investigated in the optical absorption spectral range of 200-1000 nm. The results showed the carbon is influenced TiO2 and has a semiconductor behavior; the energy gap was 3.15 eV of indirect transition and 3.2 eV for direct transition. The examination for the influence of TiO2 was an extension on the microstructure of carbon and it has an electrical behavior of the composite was distinguished. The modification of the substance structure of carbon by TiO2 doping permits photocatalytic movement of carbon towards the visible light and near infrared (NIR); this doped was gotten in a dry place at ambient temperature and its effect was expected from the physical properties of the energy gap, the advantages exhibited high absorption for spectral selective coating surfaces for operation by utilizing this coating on flat plate collector to give a high absorptivity from the solar energy respect to the incidence solar radiation.
Introduction
Photocatalytic activity of TiO2 has magnificent broadly utilized as catalysts in absorbance light; in the current years, scaling optical and electronic properties of nanomaterials [1]. TiO2 is promising material as a semiconductor has high photochemical safety for a minimal effort. When titanium dioxide nanoparticles scattered with fine sizes in several applications to dope material becomes promising, for example, pigments, adsorbents, and photocatalytic [2]. In these cases, when a molecule measure is diminished particularly for a few nanometer scales has huge surface-to- volume proportion and new optical properties can be fund through applications of photocatalytic [3]. Photocatalytic productive structures can yield genuine stride in most famously in dealing with clean energy request and being taking care of regular pollution. Only little are measured of this energy and assembled by current photocatalytic materials, which typically have photo transformation of sun oriented based. For quite a while, most asked about TiO2 in photocatalytic material and it influenced of light, the fact it has given the most capable photocatalytic activity, highest stability, minimum cost and most negligible danger. A collection of methodologies have been tried to update the photocatalytic directly with TiO2. Nano-organizing of photocatalytic motivation and represent a few particular conditions in doped metals to give great absorption of light [4, 5].
Therefore cobalt Co doping TiO2 with a metal and a nonmetal can accomplish the movement of extra particular photo dynamic forces. Cobalt gives a high photocatalysis in doping with these materials. It is wonderful respectable metals, for example, Ag and Au have one kind of electronic material and have reactant properties. For instance, platinum (Pt) atom arranged to dope TiO2 and examined noticeable in light action for the photo-degradation of chlorinated normal mixes. After then, another line in doping as a nano tube carbon-doped with TiO2 to be groups is composed to a raised temperature between (500–800 oC). By utilizing nanotubes carbon will be demonstrated as a reactant ability of the TiO2/C for water part under obvious light illumination [6]. Basic materials inside carbon nanotubes strengthen the absorption can be put as a property into tube tips, sidewalls, and principal zones of the unfilled spaces. Carbon nanotubes can give surface area and solid van der waals confining energy for sub-molecule spreads on all around depicted maintenance objectives [7]. A rutile TiO2 (110) was doped with chromium (Cr) and examined by utilizing non- contact atomic power microscopy (NC-AFM). It happens to constitute solid exploratory proof for refreshed surface oxygen opportunity change upon Cr doping of rutile titania [8].
The aim of this work is to explore carbon doping with TiO2 and finishing optical properties of carbon contain TiO2 to doping it. Optical properties are achieved with high absorbing for solar energy in selective surfaces. This study and results are corroborated doping carbon by TiO2, the direct and indirect transmission, absorption and XRD-ray examination is the fundamental investigation for assessment this doping for TiO2/C to achieve high retention of the solar energy for the flat plate collector.
Experimental Work
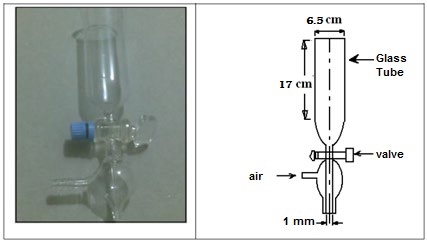
The TiO2 nanoparticle powder of (50 nm) size was brought from Easchem company/Changsha /Hunan/China). It was utilized as dopant carbon powder. It utilized to mix with carbon as a photocatalytic precipitated upon specimens, the wt. % of TiO2 was (10%) with (90%) of carbon was added to polyethylene glycol (PEG-400) by the ratio 1:2 to set up the colloidal. The colloidal alluringly blended for (5 h) by appealing stirrer to ensure the establishment of a TiO2/C composite photocatalyst blended as a colloidal and scattered them in PEG-400 with adds distilled water 4:1 to PEG400 in the lab at ambient temperature. After then, the colloidal placed in a apparatus assembly, it delivered by utilizing glass tube that using to spray the colloidal over the samples by spray pyrolysis to start the spray coating process, the equipment of spray to deposit specimens is clarifies in figure 1.
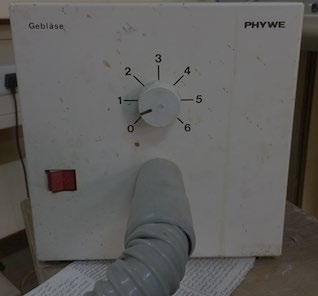
As continuous with above, the air blower device is utilizing in spray coating to accelerate the activity of spray process as clarifies in a figure 2.
The spray procedure has been done through the glass tube the colloidal pour from the hole in the top of the tube glass over the capillary tube. It has been showered samples through the glass tube to capillary tube; when the glass chamber covers the capillary tube. This glass chamber is taking a cone shape near the highest point of the valve that used to open and close the valve of the capillary tube. When colloidal downward to the base of the substrate, the glass chamber is done a vacuum to have an effect inside the glass chamber, to allow the air blends with colloidal beads at end of capillary tube and sprayed on the samples. The sample dimensions were (2.5x2.5x0.2 cm3) consist of aluminum and glass with 2 mm thick. then these samples placed under the atomizer and placed variation heater under the samples to enable them warming before beginning spray technique and gift all the water and PEG-400 will vaporize from the coating layer. The samples will be dried to get a good precipitation on the sample [9, 10].
Finally, the samples dried in the furnace at temperature 250 oC for 7 h to guarantee the foundation of the crystallization for the composite and leave it in the furnace to the next day when turning off.
Characterization of Samples
The optical absorbance (α) of the specimen was measured as a component of wavelength (λ) extended from (200-1000 nm) by utilizing computerized Shimadzu 1650PC UV-VISIBLE-SPECTROPHOTOMETER full-scale absorbance and by Shimadzu FTIR-8300 Fourier Transform Infrared SPECTROPHOTOMETER full-scale (200-2000) absorbance.
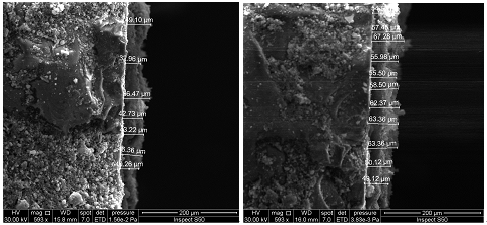
The thickness of the produced films was (40-67 μm) measured using SEM (SCANNING ELECTRONIC MICROSCOPE: INSPECT S50) as shown in figure 3, where the thickness was produced films of TiO2 doped carbon when precipitated on glass films.
Results and Discussion
Optical transmittance and absorbance were reported in order to study effect of doping TiO2 on carbon and show the parameter of optical properties under investigation to attain high absorptivity from the selective surfaces, when coated upon flat plate collector by this composite to absorb high solar energy, this composite works as a trap composite to sun ray incidence and doesn’t reflected from the surface.
The Fourier transform infrared spectrophotometer transmittance (FTIR) and absorbance spectrum in the region (200-1000 nm) for doped film sample are shown in figure 4, in this region the film has a finger print consist of between bonds of structure atoms. From figure (4) exhibits the absorption increased along increase the wavelength.
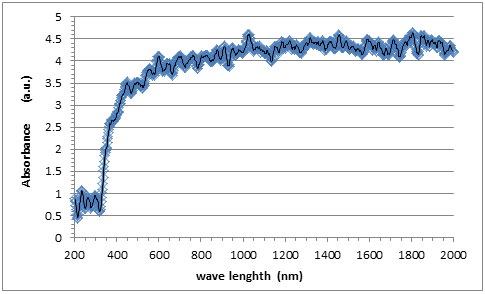
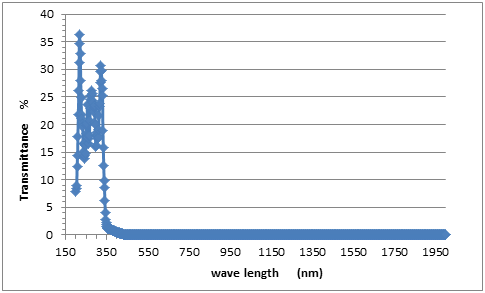
In figure 5 shows the transmittance is very low and decrease with increase the wavelength for the film. This is proof that composite when precipitate on the specimen will absorb the incidence solar radiation on the surface and showing the high absorbance. This is very important in selective surfaces when using as a coating on the flat plate collector.
The carbon doping by TiO2, this expanding and can be ascribed to the presence of more electronic changes from higher vibration levels of the ground state to higher sublevels of the main energize in single state.
The transmittances as a function of the incidence wavelength were performed by using a glass substrate in measurements for the film deposition on the aluminum substrate. This transmittance diagram shows that decreasing to zero with increase wavelength this proves that all incident wavelengths will absorb from the composite.
A thin film of the TiO2/C was described by X-ray diffraction as shown in Figure 6 for thin film of the TiO2 doped carbon. These patterns showed the poly crystalline nature of the deposited thin film regarding of TiO2 content in the composite. The X-ray diffraction hints for every single thin film were estimated at ambient temperature and found to indicate relatively comparable patterns.
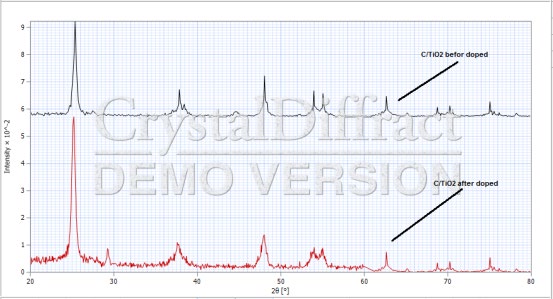
The X-ray diffraction is coinciding before and after doping and confirms that carbon is doped by TiO2 nano powder to attain high absorptivity for selective surfaces. Table 1 showed the diffraction peaks of the composite TiO2/C, it coincides before and after doping and the crystalline phase remains the same. The half-width line maximum of the XRD patterns is the main reason to calculate the crystalline size. This showed the nanostructured idea of the samples. All the results shown in table 1:
| No. | h | k | l | d-spacing | 2θ | Intensity | I/I max | M | N | Lp | FWHM |
|---|---|---|---|---|---|---|---|---|---|---|---|
| 1 | 0 | 1 | 1 | 3.516 | 25.307 | 55.663 | 100% | 8 | 2 | 9.704 | 0.050o |
| 3 | 0 | 0 | 4 | 2.379 | 37.788 | 11.521 | 20.7 | 2 | 16 | 4.094 | = |
| 5 | 0 | 1 | 5 | 1.892 | 48.044 | 16.422 | 29.50 | 4 | 4 | 2.390 | = |
| 6 | 0 | 1 | 5 | 1.700 | 53.881 | 10.645 | 19.12 | 8 | 26 | 1.841 | = |
| 7 | 1 | 2 | 1 | 1.666 | 55.069 | 10.336 | 18.62 | 16 | 6 | 1.752 | = |
| 8 | 1 | 2 | 3 | 1.493 | 62.113 | 1.706 | 3.1 | 16 | 14 | 1.336 | = |
| 9 | 0 | 2 | 4 | 1.481 | 62.688 | 8.277 | 14.87 | 8 | 20 | 1.310 | = |
| 10 | 1 | 1 | 6 | 1.64 | 68.751 | 3.665 | 6.58 | 8 | 38 | 1.075 | = |
| 11 | 2 | 2 | 0 | 1.338 | 70.299 | 4.151 | 7.5 % | 4 | 8 | 1.027 | = |
| 13 | 1 | 2 | 5 | 1.265 | 75.048 | 6.483 | 11.65 | 16 | 30 | 0.906 | = |
| 14 | 0 | 3 | 1 | 1.250 | 76.045 | 1.722 | 3.1 | 8 | 10 | 0.885 | = |
Table 1: The diffraction peaks of the TiO2/C composite. The crystallite size of the samples was calculated from full-width at hal
…………………… (1) Where (d) represents the crystallite size; (λ) represents the wavelength of incident X-ray; (β) is the FWHM of diffraction peak; (θ) the diffracted angle.
Optical Properties of TiO2 Doped Carbon
The optical absorption spectra of the composite TiO2/C thin films at ambient temperature has been studied to determine the optical energy gap, Eg, band tail width or Urbach energy, EU and the nature of the transitions involved.
Generally, the absorption coefficient (α) is related to photon energy (hν) by the following equation [11]:
$$ \alpha = \frac {\beta}{h v} \left(h v - E g\right) ^ {n} \dots \tag {2} $$
( ) ( ) $$ \left(\alpha h v\right) ^ {\frac {1}{n}} = \beta \left(h v - E g\right) $$ ……………………(3) Where (β) is a constant called the band tailing parameter, (Eg) is the optical energy gap and (n) is the power factor of the transition mode. It is depending upon the nature of the material, if it is crystalline or amorphous. If n=0.5 is indirect transition, and n=2 for direct transition [11]. The thermal conductivity of this composite were identified with their electronic properties, for example, band gap, ionization potential, electron affinity, and band width, which demonstrates the valence and conduction groups (energy levels) of the band gap for the composite as an insulator [12].
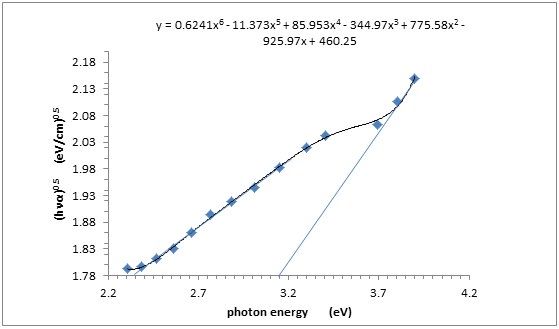
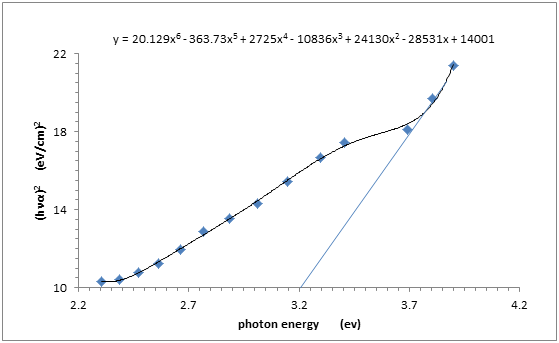
The energy gap could be ascribed to the development of plans in the doped films. The proof of TiO2/C was developed to response the band to band transition because of moving the band thickness of state toward the energy gap. This perception was not like the doping in ordinary semiconductors such that the band to band absorption strength does not influence on the arrangement of dopant state in the energy gap. From Figures 7 & 8, it observed the allowed indirect and direct transition for crystalline of TiO2/C composite patterns dopants [13].
Then table (2) demonstrates information about the direct and indirect allowed transition, recommending their electronic levels nature. The absorption information was gotten by utilizing particle absorption method from the above figures. The calculated values were a good agreement with the experimental values.
- Direct Band Gap
- For TiO2/C
- Indirect Band
- Gap TiO2/C
- Photon Energy for TiO2/C
- 3.2 (ev)
- 3.15 (ev)
- 2.35 (ev)
Table 2: Indicate the energy band gap according to the direct
Urbach Energy Determination
In most semiconductor materials has an absorption coefficient (α) relies upon the photon energy. Near to the optical band edge, the connection between (α) and (hν) is known as Urbach energy, which is given by this exponential condition in this equation:
$$ \alpha = \alpha_ {o} \exp \left(\frac {h v}{E u}\right). $$
……..….………….(4) $$ \ln \alpha = \ln \alpha_ {o} + \left(\frac {h v}{E u}\right) $$ .…………………….(5) Where (αo) is a constant, (hν) is the incident photon energy and (Eu) is the band tail width (Urbach energy) of the localized states in the optical energy gap. The joining of dopants into carbon frequently uncovers the growth of band following it in the band gap. The tail of the absorption edge is exponential and showing the confined states in the energy band gap (Eg). It measured and can be anticipated to the first estimation by plotting the absorption edge information as far as condition initially giving by Urbach tail. The absorption edge gives a measure of the energy band gap and the exponential reliance of the absorption coefficient [14, 15] as shown in Figure 9. The estimation of EU was gotten from the inverse of the incline of (lnα) with (hυ) and is given (EU= 987 meV) the dopant change for the width of the confined states in the optical band. EU esteems change conversely with the optical band gap.
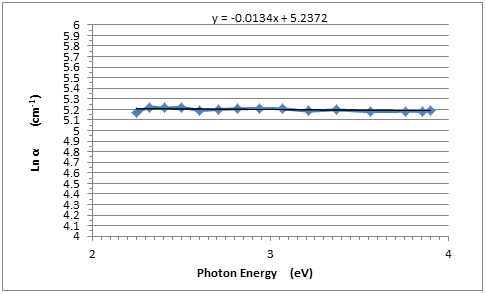
The expansion of EU proposes that the atomic structural disorder of TiO2/C films increment by doping. Along these lines, this expansion prompts a redistribution of level states of the atoms, from the band to the tail. Subsequently, the expansion of energy gap (Eg) and the reduction of band tail width (Eu) might be clarified as far as unsaturated bonds which prompt crystalline materials. It is referred to that unsaturated bonds are created because of an insufficient number of atoms deposited on the amorphous films [16]. These bonds are in charge of the development of a few deformities in thin films which thusly create confined states in the band gap of amorphous solids. From the above proves that the dopant of TiO2/C composite is done and the composite has disorder structure for the best redistribution of the structure.
Refractive Index
The refractive index (𝑛) is an important parameter for optical materials and applications. Thus, it is important to determine optical constants of the films. The refractive index of the films was determined from the following relation [17]:
$$ n = \left(\frac {1 + R}{1 - R}\right) + \sqrt {\frac {4 R}{1 - R ^ {2}} - K ^ {2}} $$ ………………………… (6) Where (𝑅) represent the reflectance and (𝑘) is the extinction coefficient (𝑘 = 𝛼𝜆/4𝜋) where (𝛼) is the absorption coefficient. The values of (n, k) are depending on the wavelength are shown in Figures 10 &11, respectively, it is important to determine dispersion parameters of the films. The refractive index is one of the fundamental properties for an optical material because it is closely related to the electronic polarization of ions and the local field inside materials. These figures were noticed that the refractive index increases with the wavelength increasing and the polarization of the composite is done from the doping, in the same way, the extinction factor also increases with increase the wavelength. This attributed to good annealing for the sample. The effect of the refractive index underneath the interband absorption edge related to the essential electronic excitation range.
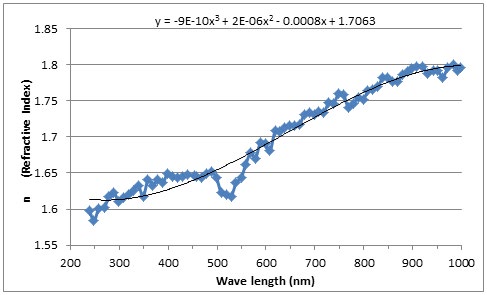
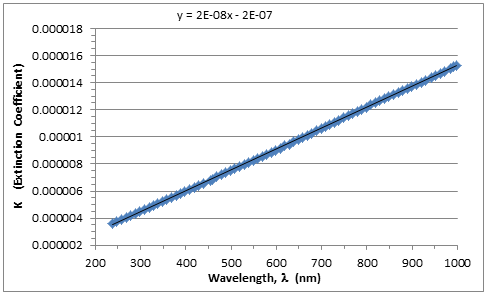
It was clarify that, the values (n and k) increased with increasing the doping concentration respectively. Mostly, the value of n increased by increasing the value of k, in the last is affected by the wavelength [18], this increasing is due to increasing the density of localized states near the mobility edges [19].
Dielectric Constant
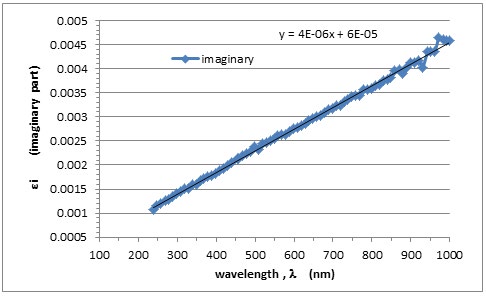
The dielectric constant is characterized as (ε) = 𝜀1 + 𝜀2; real (𝜀1) and imaginary (𝜀2) parts of dielectric constant are identified with the symbols 𝜀1 and 𝜀2. The 𝜀1 and 𝜀2 esteems were figured by utilizing the accompanying equations [20]:
2 1 2 k n = + å ………………………… (7)
= 2å 2nk ……….………… (8)
The 𝜀1 and 𝜀2 estimations dependence on wavelength, separately, appeared in Figures 12 & 13 for the doped sample. The 𝜀1 values are higher than 𝜀2 values and the parameters of the 𝜀1 and 𝜀2 esteems increment with expanding wavelength and this expansion explain the variety of 𝜀1 predominantly relies upon due to little estimations of while 𝜀2 chiefly relies upon k esteem which is identified with the variety of absorption coefficients [21].
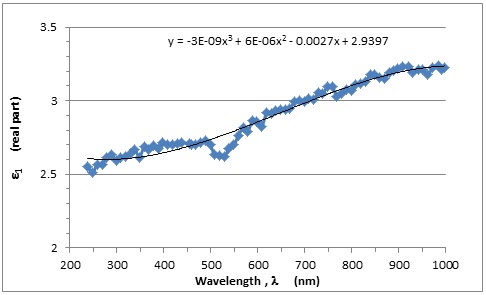
The study of dielectric constant of a material gives an outline form of atoms nature, ions and their bonding in the material.
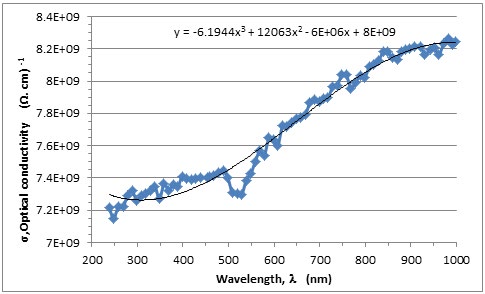
The optical conductivity (σ) was calculated using the following relation [22]:
4 nc α π = ó …………………. (9)
The variation of optical conductivity was observed in Figure 14, that the optical conductivity increased with doping concentration, then the optical conductivity dependent on the n (refractive index) and α (absorptivity).
It can be noticed that the optical conductivity increased with increases the wavelengths; regarding to high absorbance of the films. This attributed to a good spray method for coating of the composite over samples.
The skin depth (x) could be calculated using the following relation [23]:
$$ \mathbf {X} = \frac {\lambda}{2 \pi k} \dots \tag {10} $$
The variation of skin depth as a function of wavelength for all films is appeared by Figure 15.
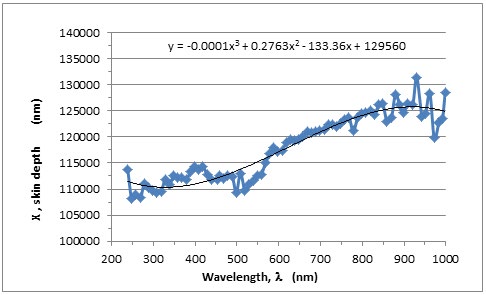
It is clear from figure (15) skin depth increased as the wavelength increases; this investigated by equation (10) because skin depth is proportional with the wavelength for the carbon doped. So skin depth is inversely proportional with extinction factor but the value of extinction factor is low comparison with the wavelength value.
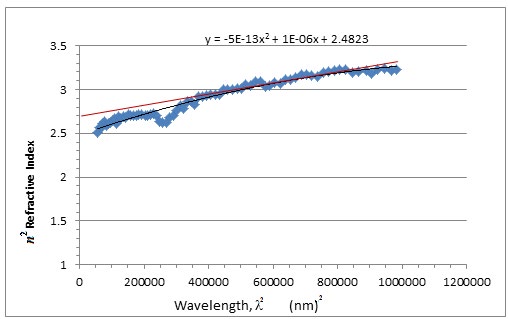
The analyses of the obtained data of refractive index can be used to obtain the high frequency dielectric constant through to describe the contribution of the free carriers and lattice vibration modes of the dispersion.
However, the value of the lattice for a high frequency dielectric constant value ε∞which estimated (ε∞= 2.7) can obtained from figure 16 [24]. The following equation shows the relation between optical dielectric constant ε, wavelength λ and refractive index n:
$$ \varepsilon = \varepsilon_ {\infty} - \left(\frac {e ^ {2}}{4 \pi c ^ {2} \varepsilon_ {0}}\right) \left(\frac {N}{m ^ {*}}\right). $$
2 ……………………. (11) Where (c) is the velocity of the light; the permittivity of free space (8.854 × 10⁻¹² F/m); (N) the free carrier concentration and the effective mass of the charge carriers. The nature of the dispersion of (n2) as a function of wavelength (λ2) for different substrate temperatures is shown in Figure 16.
It can be seen that the dependence of (n2) is linear relation at high wavelength. The values of the lattice high frequency dielectric constant, is determined from the intersection of the straight line with λ2 = 0. The values of was increased with increasing the substrate temperature of the film.
Conclusion
The material after doping will be a semiconducting material has properties to absorb incidence wavelength, this paper relied doping carbon by TiO2 nanomaterial to get thin film was prepared by using spray pyrolysis method. The doped sample was optically characterized by using UV-VIS technique and the results were systematically presented. The optical properties absorption coefficient was increasing with increases wavelength by doping TiO2/C but the transmission was decreased to a lower value. The optical band gap for direct and indirect has been calculated and found in the range (3.2 and 3.15) and this value exhibited a good value of energy gap compared with researchers. The extinction factor, skin depth and optical conductivity has been campted from the doping concentration wt. % respectively, the result of the Urbach’s tail was 987 meV inversely value with the photon energy. The optical dispersion parameters were characterized. Refractive index, dielectric constant for the real and the imaginary part of the optical spectrum have been determined, where they were increased with increases wavelength for the doping contents of TiO2/C. These properties have been gotten from the results to proof doping of TiO2/C, will be attained to manufacture a semiconductor and manipulation the poor absorption from the surface of selective material for the flat plat collector, then to robust the absorption from that surfaces and endowing the progress in research to find the spinal coating for the selective surfaces.
References
-
Tomkiiewicz M (2000) scaling properties in photocataly- sis. Catalysis Today 58 (2-3): 115-123.
-
Ramakrishna G, Ghosh HN (2003) Optical and Photo- chemical Properties of Sodium Dodecylbenzenesulfo- nate (DBS)-Capped TiO2 Nanoparticles Dispersed in Nonaqueous Solvents. Langmuir 19(3): 505-508.
-
Sahni S, Reddy SB, Murty BS (2007) Materials Science and Engineering 758(452-453).
-
Fujishima A, Zhang X, Tryk DA (2008) TiO2 photocatalysis and related surface phenomena. Surf Sci Rep 63(12): 515-582.
-
Hashimoto K, Irie H, Fujishima A (2005) TiO2 photocatalysis: a historical overview and future prospects. Jpn Jou Appl Phys 44(12): 8269-8285.
-
Choi Y, Umebayashi T, Yamamoto S, Tanaka S (2003) Fabrication of TiO2 photocatalysts by oxidative annealing of TiC. J Mater Sci Lett 22: 1209-1211.
-
Wu Z, Dong F, Zhao W, Wang H, Liu Y, et al. (2009) The fabrication and characterization of novel carbon doped TiO2 nanotubes, nanowires and nanorods with high visible light photocatalytic activity. Nanotechnology 20(23): 235701-235710.
-
Ralf B (2009) Evidence for Vacancy Creation by Chromium Doping of Rutile Titanium Dioxide (110). J Phys Chem C 113(8): 3277-3280.
-
Yousif E, Hassan O, Otaiwi A, Farina Y (2008) Studying the conductivity of Poly (vinylchloride) using 2-thioacetic acid benzothiazole complexes as additives by measuring forbidden energy gap. Iraqi Journal of polymers 12: 5-78.
-
Saad FO, Mohammed TAN, Wasan AAT, Rahimi MY, Darfizzi D, et al. (2015) Dispersion Characterization of conductive polymer. Int J Electrochem Sci 10: 1555 -1562.
-
Shahane GS, More BM, Rotti CB, Deshmukh LP (1997) Studies on chemically deposited CdS1– x Sex mixed thin films. Mater Chem and Phys 47(2-3) 263-267.
-
Ali AA (2017) A Comprehensive Study of Conductive Polymer Matrix Composites: A Review RJPBCS 8: 2043- 2049.
-
Alias AN, Zabidi ZM, Ali AMM, Harun MK, Yahya MZA (2013) Optical characterization and properties of polymeric materials for optoelectronic and photonic applications. International Journal of Applied Science and Technology 3(5): 11-38.
-
Tauc J (1974) Optical Properties of Amorphous Semicon- ductors. Plenum Press, New York, pp: 159-220.
-
Wasan AT, Mohammed AN, Rahi- mi MY, Emad Y, Bashar MA (2015) Dispersion Charac- terization of conductive polymer. International Journal of polymer science 10: 1555-1562.
-
Theye ML, Elwhab A, Alwany B (1973) Optical Properties of a-Ge, a-Si and a-III-V Compounds. Proceedings of the 5th International Conference on Amorphous and Liquid Semiconductors 1: 479-498.
-
Hamad TK, Yusop RM, Al Taa’y WA, Abdullah B, Yousif E (2015) Laser induced modification of the optical properties of nano-ZnO doped PVC films. International Journal of Polymer Science 2014: 5.
-
Muhammed HA, Sami SC, Nadir FH (2010) The effect of Iron chromate on the optical properties of PMMA films. Diyala Journal for Pure Science 6(2): 161-169.
-
El-Sayed SM (2003) Glass Formation and Local Arrangement of Chalcogenide of Ga40Se60 and Ga33Se60Te7. Materials Chemistry and Physics 78(1): 262-270.
-
Al Taa’Y W, AbdulNabi M, Yusop RM (2014) Effect of nano ZnO on the optical properties of poly(vinyl chlo- ride) films. International Journal of Polymer Science.
-
Ahmad AH, Awatif AM, Zeid N, Abdul Ma- jied (2007) Doppin effect on optical constants of poly- methylmethacrylate (PMMA). Engineering & Technology 25(4): 558-568.
-
Pankove JI (1975) Optical Processes in Semiconductors. Dover, New York, NY, USA.
-
Eloy JF (1984) Power Lasers, National School of Physics, JohnWiley & Sons, Grenoble, France.
-
Zemel JN, Jensen JD, Schoolar RB (1965) Electrical and Optical Properties of Epitaxial Films of PbS, PbSe, PbTe, and SnTe. Physical Review A 140: 330-335.
- Solution-Processed Chiral Perovskites for Biomedical Applications
- Nanotechnology in Health Chemistry and Medicine: Current Challenges and Future Directions
- Human Exposure to Micro- and Nanoplastics: Pathways, Toxicity, and Intervention Strategies
- Exosome Nanomedicine for Cancer Therapy
- Micro and Nanoplastics–Plastisphere, Biotoxicity, Impact on Human Health, and Mitigation Strategies
- Process Validation of Cefixime Powder for Suspension Dosage Form, 50 mL