Assessment of Radiofrequency Radiation from 2G and 3G Mobile Phone Handsets
There are about 8.9 billion mobile phone subscriptions globally, and most subscriptions in developing countries still use 2G and 3G mobile standards. The impact of electromagnetic radiation from these devices on humans is of major concern. There is a need to assess the level of radiofrequency radiation in the immediate environment of common mobile phones in real-life exposure scenarios. The electric field intensity (E) in approximately 60 common 2G and 3G mobile phones was assessed using a standardised handheld spectrum analyser and a broadband meter. The highest value of E at about 10 cm from the selected 3G and 2G mobile phones during spectral measurements was 0.20 V/m and 0.33 V/m, with an average value of 0.11 V/m and 0.17 V/m, respectively. The highest E-field values from the 3G and 2G phones during broadband measurements were 33.01 V/m and 76.52 V/m, respectively. The exposure due to a signal from the selected 3G and 2G phones is about 0.76 % and 0.35 % of the total radiofrequency radiation exposure around the phones during initiated calls on average. Based on the ICNIRP recommendations, the signals from selected mobile phones in this study do not pose a thermal health risk to humans.
Ayinmode BO¹*, Farai IP¹, Olawole OC²**, Ajibade KE², Akinmeji SO², Akinwumi SA² and Ariyo M³
¹Department of Physics, Faculty of Science, University of Ibadan, Ibadan, Oyo State, Nigeria ²Department of Physics, Covenant University, Ota, Ogun State, Nigeria ³Centre for Systems and Information Services Department, Covenant University, Ota, Ogun State, Nigeria Keywords: Mobile Phone; Radiofrequency; Electromagnetic Field; Radiation Exposure
Abbreviations
BTS: Base Transceiver’s Station; dBm: Decibels Per Milliwatt, CDMA: Code Division Multiple Access; RF: Radiofrequency; PMA: Planar Monopole Antenna; PIFA: Planar Inverted-F.
Introduction
The evolution of mobile phone telecommunication systems dates back to 1973, and since then, mobile phones have undergone tremendous innovative technological advancements [1]. The yearly transition of mobile phone technology in the world can be classified into generations, from the First Generation (1G) to the recent sixth Generation (6G) mobile technologies [2, 3, 4]. The advancements in each generation of mobile phones have transcended from analogue signal transmissions to digital voice and video transmissions, ultimately leading to the sophisticated digital high-speed transmission of voice, text, and video data on a large scale.
Mobile phones are portable, versatile, two-way radio systems that transmit to and receive signals from a Base Transceiver’s Station (BTS) within an area or cell covered by the BTS. A service provider’s BTS controls a mobile phone’s output power, keeping it at a moderate level to maintain a good signal quality. The highest output power of a mobile phone is typically 1 W and 2 W at 1800 MHz and 900 MHz, respectively, down to a level that may be as low as 1 mW [5].
The global proliferation of mobile phone devices took the electronic world by surprise. Mobile phone subscriptions increased from just 34 million subscriptions globally in 1993 to about 7.9 billion subscriptions by 2018 [6]. Smartphones operating on 3G networks and beyond are becoming necessary, as they can limit internet browsing and make video calls at exceptionally high speeds. The use of smartphones for video streaming is expected to account for around 75% of mobile data traffic by 2023 [1]. Global subscriptions associated with smartphones now account for 65% of all mobile phone subscriptions [6, 7]. The deployment of the long-awaited 5G network is expected to boost the use of mobile phone devices, especially in dense urban areas, by 2023 [8, 9].
In a study by Wall S, et al. [10] in 2019, a broadband and a frequency selective radiation meter were employed to measure the RF exposure from cell phones at different distances [10]. Fakhri, et al. [11] used a survey meter to measure both background and emitted electric field intensity (E) from different brands of mobile phones at a distance of 2 cm, 25 cm and 50 cm when the phones were in ringing vibration and silent modes [11]. In Nigeria, few studies have estimated the level of power density and E at distances between 0.05 m to 0.2 m from various brands of mobile phones while holding each brand of mobile phone during the transmitting or receiving call modes, mimicking real-life situations [12, 13, 14].
In addition to the global concerns about the negative impact of circulating counterfeit mobile phones [15, 16] there are also concerns about suspected detrimental health effects that may be associated with the electromagnetic radiation emissions from the numerous mobile phones and BTS masts worldwide [17, 18]. These fears are exacerbated by certain news articles and reports often published online about the potential harm of radio waves to humans. Some scientific bodies, institutes, and organisations, backed by the governments of certain countries, conduct tests on various brands of mobile phones to ensure compliance with radiofrequency (RF) radiation emission standards.
However, to the best of the authors’ knowledge, environmental impact assessments of RF radiation exposure in many African countries focus mainly on emissions from base station masts [17, 18, 19, 20]. There is a need to assess the level and contribution of RF exposure from mobile phones to overall RF exposure in real-world environments, using spectral and broadband radiofrequency radiation analysis. Therefore, this study aims to assess the level of E in the far-field environment of common models of mobile phones working on 2G and 3G signal bands in Nigeria, using both a broadband meter and a spectrum analyzer.
Materials and Methods
Although the dipole antenna is the fundamental structure from which many antennas in mobile communication systems are built [21, 22], antennas like the helix, planar monopole antenna (PMA), slot antenna and the planar inverted-F (PIFA) or microstrip antenna are used to achieve a reasonable antenna efficiency and bandwidth [23]. These antennas are positioned at strategic places on the phone’s PCB to optimise their structural dimension and, hence, the current path to increasing the aperture size of the antenna and its overall performance [24].
In addition, the highest energy in the near field region of the antennas of the examined mobile phones is four times the average energy at the aperture of the antenna [25]. While the far-field region of an antenna begins from a distance fd as:
2 2 d D f λ =
(1) where D typifies the largest dimension of the antenna, and λ is the wavelength of the emitted signal.
Studies have shown that the largest dimension D of a typical mobile phone antenna is within 1 and 8 cm [23, 26]. Also, the thickness of common modern mobile phones is between 0.5 and 1.5 cm. According to Rowell C, et al. [23], the largest dimension of the antenna of about 42 mobile phones is about 4.02 cm, on average. Hence, for a mobile phone antenna with D = 4.0 cm, the fd at 900 MHz is 0.97 cm, 1.94 cm at 1800 MHz, and 2.26 cm at 2100 MHz. This indicates that a caller’s head may be in the range of the near- field region of a mobile phone during an active call.
To assess the level of emitted RF radiation in the far field environment of mobile phones in active call mode, 60 common mobile phones working mainly on 2G and 3G were selected for this study. The models of these phones are presented in Tables 1a & 1b. These phones were collected with the consent of the owners, who had been using the phones for a while at the time of this study. The selected phones were fully charged, or at least 80 per cent of the battery state of charge, to ensure that their transmission power levels were within the normal range of a typical mobile phone during calls.
Type of Mobile Phone and 2G Network Type of Mobile Phone and 3G Network
Nokia 108 Prestigio PSP350
ZTE Z222 Tecno M3
Tecno P5 Samsung core prime
Nokia RM-1035 Nokia Lumia RM-978
Infinix X551 Alcatel One touch
Nokia 103 Blackberry BEC1
BLU Energy X-plus Samsung SM-A310F
BlackBerry 9810 Sony Ericsson Xperia TX
Samsung GT-E1205T Blackberry E145
Nokia 222 BlackBerry SQW 100-1
Nokia 113 King Zone S2
i-Tel IT 2090 Prestigio PSP350
Sony Ericsson K800i Samsung SM-G530H
Nokia Asha 202 Alcatel One touch Nokia RM-1035 Malata i-11 Table 1a: Selected mobile phones and communication networks.
Type of Mobile Phone and 2G Network Type of Mobile Phone and 3G Network
Tecno T340 Huawei G power
Vodafone Smatt II Huawei Ascend Y520
Samsung GT-S5301 Infinix note 3
Solo S355 Gionee P2
Nokia 2720a-2 Lenovo A369i
Nokia Lumia 520 Infinix smart
Nokia 2626 Infinix smart
Nokia 1280 Tecno Y2
Nokia 5130c-2 Lenovo A1010
Nokia 105 i-Tel 1508
Nokia 1209 Samsung GT-S7562
Nokia 1100 Lenovo A520
Tecno T605 Apple iphone-5
Tecno 608 Samsung GT-S5282
Tecno T6115 Samsung GT-S6810P
Table 1b: Selected mobile phones and communication networks.
A handheld spectrum analyser, SPECTRAN HF - 60105V4 by Aaronia AG, was employed in this study. The spectrum analyser has a 1 MHz to 9.4 GHz bandwidth and a resolution of 200 kHz to 50 MHz frequency band. An Omnilog-90200 tri- axial antenna, which was factory-calibrated to detect signals within the range of 700–2.5 GHz, was used in conjunction with a spectrum analyser during measurements.
The spectrum analyser, with its default measurement of received signal frequencies in decibels per milliwatt (dBm), is a testament to its precision. It can also be set to directly measure electric field intensity E in volts per meter (V/m) or convert the dBm unit automatically to E. In this study, peak values E from the spectrum analyser were recorded during each measurement in the mobile phones’ far-field region. The study used a TES-92 Electrosmog broadband meter in the frequency range (50 – 3500 MHz) made by Less EMF, NY, USA.
A spectrum analyser and a broadband were used to measure the values of E at approximately 10 cm from all the 2G and 3G mobile phones. This distance was carefully chosen so that measurements of E around the selected mobile phones will be taken in the far region of each mobile phone antenna. Measurements were taken when the mobile phones were actively creating and receiving calls, approximately 1.5 m above a tripod stand. The phones and the antenna of the RF meters were positioned at 1.5 m because this distance suggests the height of a position within the region of the head of a reference man, whose height is about 1.7 m [27]. The meters were used to scan RF radiation around the mobile phones at a fixed distance until the maximum radiation level was acquired. Background RF radiation is when no calls are made or received before each call is measured using the broadband meter.
The results of each background measurement were subtracted from the broadband measurements made during active calls in the same environment [10]. This was done to obtain the actual level of broadband RF radiation that is associated with each mobile phone. The measurement setup was made to depict an actual scenario of a normal phone call, such that the studied environment was disturbance- free (avoiding a sudden spike in the signal level) of active calls from other nearby mobile phones, high levels of Wi-Fi signals, human, and vehicular movements.
Results
Examples of the spectrum of uplink (mobile to base station transmission) signal frequencies obtained from the selected mobile phones operating at GSM (2G - 1800 MHz) mobile standard are presented in Figure 1. Presented in Figure 2 are the spectra of the 3G (2100 MHz) uplink signal frequencies from the selected 3G phones. It was observed in this study that all the selected phones operating at the GSM standard were transmitting at GSM 1800 uplink frequencies during measurements. The observed situation may occur since GSM 1800 can offer about double of GSM 900 speech channels for mobile phone users at lower transmission power, and it is, therefore, an ideal band for frequency reuse in congested areas.
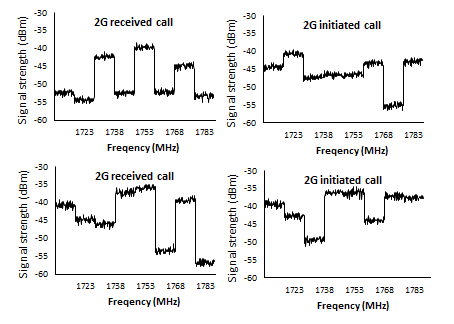
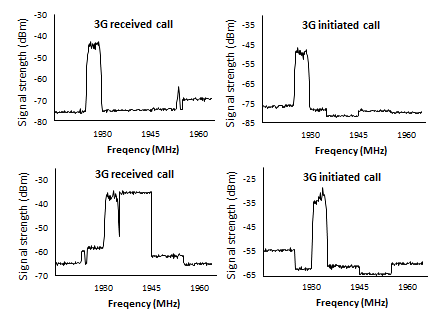
The obtained signal spectrum from all the selected 2G mobile phones in this study (as indicated in Figure 1) shows that the detected GSM 1800 uplink signals from these phones are a series of similar bands of signal frequencies at different power levels. The observed spectrum resembles a Code Division Multiple Access (CDMA) spread signal transmission technique. Unlike the observed GSM 1800 uplink signal spectrum, the spectrum of GSM 1800 downlink frequencies (emitted from BTS antennas) usually consists of signal spikes of dedicated frequency channels. The signal spectrum in Figure 2 shows a typical spectrum of the uplink signal channel obtained from the selected 3G phones. The 3G mobile phones work on a WCDMA spread spectrum technology, which, in the case of this study, consists of a noticeable 5 MHz frequency band within the 3G-uplink signal spectrum.
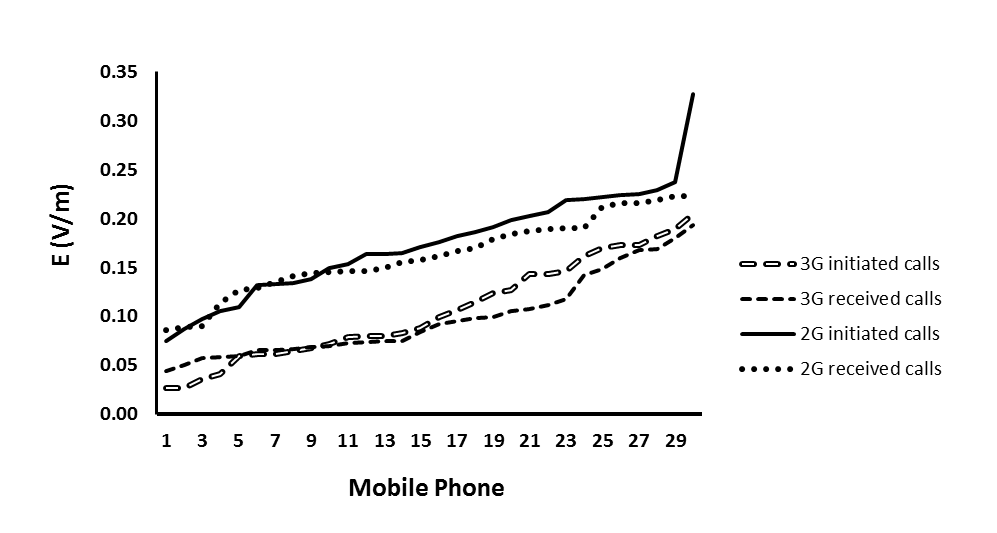
About 300 sessions of E measurement at a distance of about 10 cm from the 60 selected 3G and 2G mobile phones were made, using both the broadband meter and the spectrum analyser in this study. These measurements resulted in the acquisition of the values of background broadband E, broadband E due to initiated and received calls and spectral E due to initiated and received calls around the selected 3G and 2G mobile phones. The results of these measurements are illustrated in the graphs in Figures 3 to 5, respectively.
Discussion
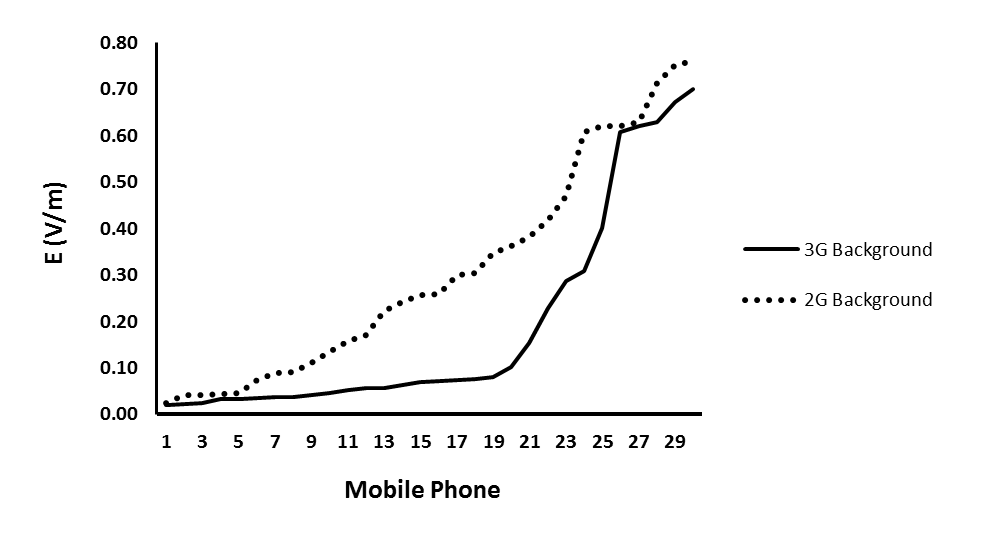
The summaries of the results of E measurements in this study (illustrated in Figures 3 to 5) are presented in Tables 2 & 3. The background E around the selected 2G and 3G mobile phones ranged from 0.03 – 0.76 V/m and 0.02 – 0.70 V/m, respectively. This shows that the background RF radiation exposures around both mobile phone standards are within the same range. It must be noted that mobile phones are constantly communicating with nearby base stations for the transfer of important information even when calls are not made from them, and this may contribute to the total environmental RF exposure.
| E (V/m) 3G mobile phones | |||||
|---|---|---|---|---|---|
| Broadband | Spectral | ||||
| Background | Received calls | Initiated calls | Received calls | Initiated calls | |
| Highest | 0.7 | 30.21 | 33.01 | 0.19 | 0.2 |
| Lowest | 0 | 2.92 | 3.6 | 0.04 | 0.03 |
| Average | 0.2 | 13.72 | 14.45 | 0.1 | 0.11 |
Table 1: Summary of the spectral and broadband electric field intensity (E) obtained from the 3G mobile phones.
| E (V/m) 2G mobile phones | |||||
|---|---|---|---|---|---|
| Broadband | Spectral | ||||
| Background | Received calls | Initiated calls | Received calls | Initiated calls | |
| Highest | 0.8 | 74.49 | 76.52 | 0.22 | 0.33 |
| Lowest | 0 | 6.88 | 19.7 | 0.09 | 0.08 |
| Average | 0.3 | 43.41 | 48.08 | 0.16 | 0.17 |
Table 2: Summary of the spectral and broadband electric field intensity (E) obtained from the 2G mobile phones.
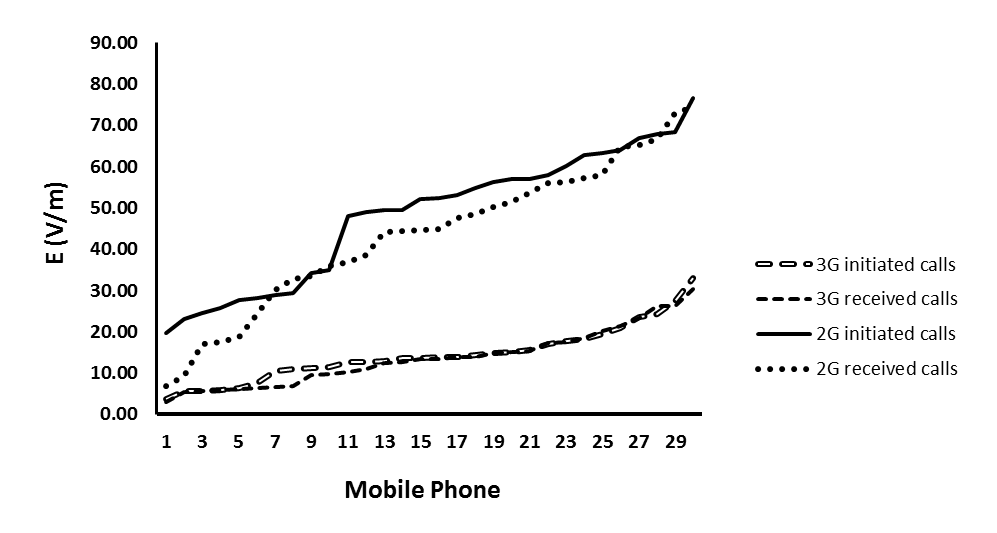
As obtained from broadband measurements, the highest E around the 3G phones during a call was 30.21 V/m and 33.01 V/m for received and initiated calls, respectively, while that of the 2G phones was 74.49 V/m and 76.52 V/m for received and initiated calls, respectively. From the spectral measurements, the highest E around the 3G mobile phones during a call was 0.19 V/m and 0.20 V/m for received and initiated calls, respectively, while it was 0.22 V/m and 0.33 V/m for received and initiated calls, respectively, for the 2G phones.
The result of this study shows that RF exposure around the selected 2G mobile phones is higher than that of the 3G phones, as illustrated in Figures 4 & 5. The average E obtained from broadband measurements is about 32 % and 30 % of that obtained from the 2G phones for received calls and initiated calls, respectively. The average E obtained from spectral measurements of the 3G phones is approximately 63% and 65% of that obtained from the 2G phones for received calls and initiated calls, respectively.
The highest value of average E obtained by the 3G phones during initiated calls from spectral measurements is approximately 0.76% of that of the broadband measurements. In comparison, it is approximately 0.35% for 2G phones. The above analysis shows that RF exposure from a communication frequency channel during a phone call is significantly lower than the exposure from the total radiation emission from the phone and its environment.
The level of RF radiation exposure when calls were initiated was slightly higher than when calls were received from the selected mobile phones, on average. This can also be observed in Figures 4 & 5. However, as shown in Figure 4, the level of broadband exposure resulting from initiated and received calls from 3G mobile phones is quite similar. This shows that the total radiation exposure from the selected brands of 3G mobile phones during initiated and received calls is nearly the same as that of their 2G counterparts. This situation may be due to the difference in the energy constitution of the signal spectrum obtained from them, which contributes to the total radiation exposure during broadband measurements and is more consistent during initiated and received calls in 3G mobile phones.
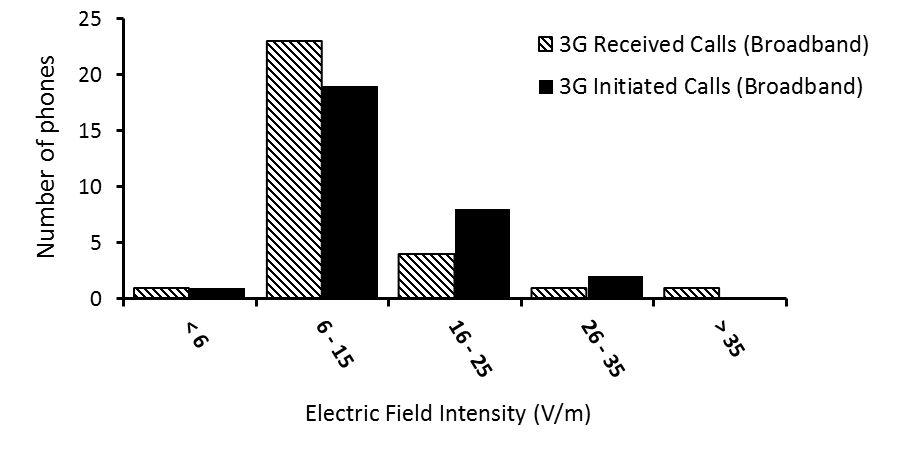
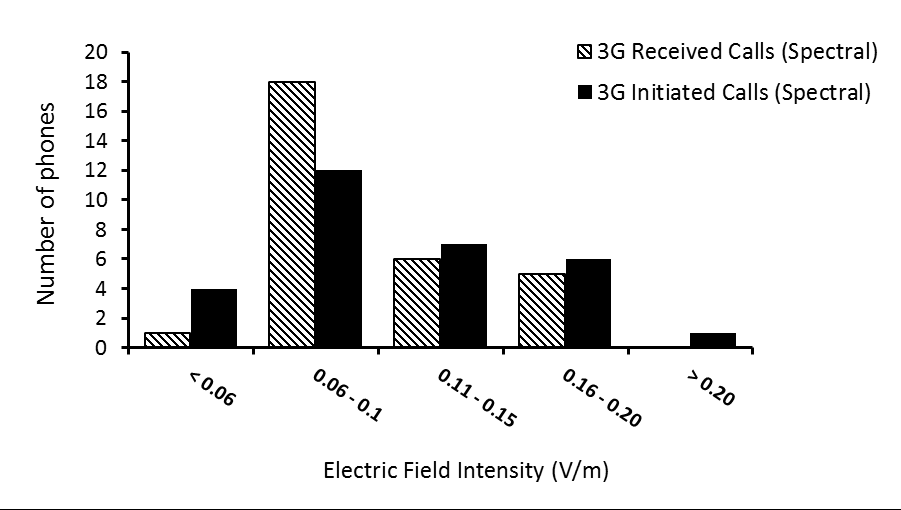
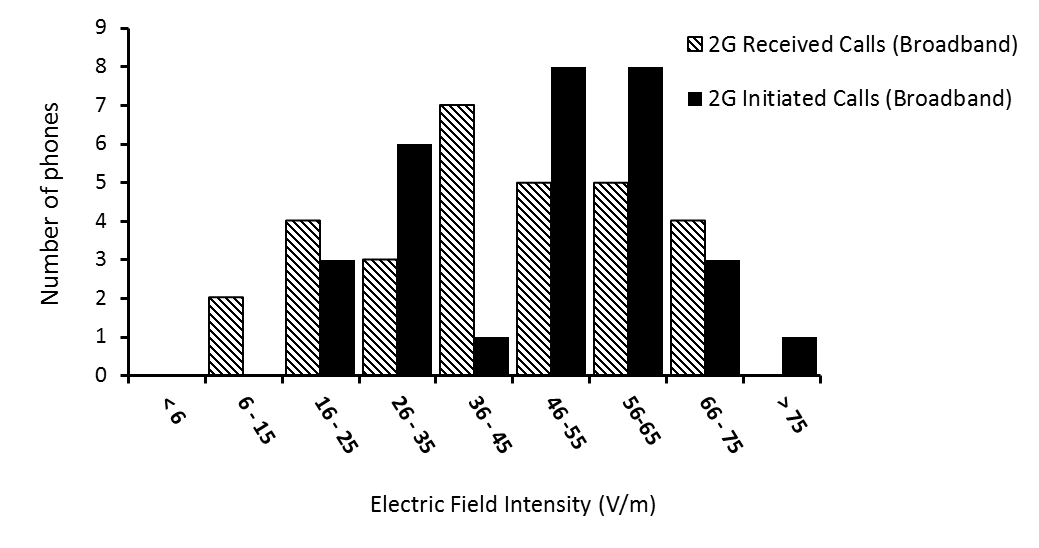
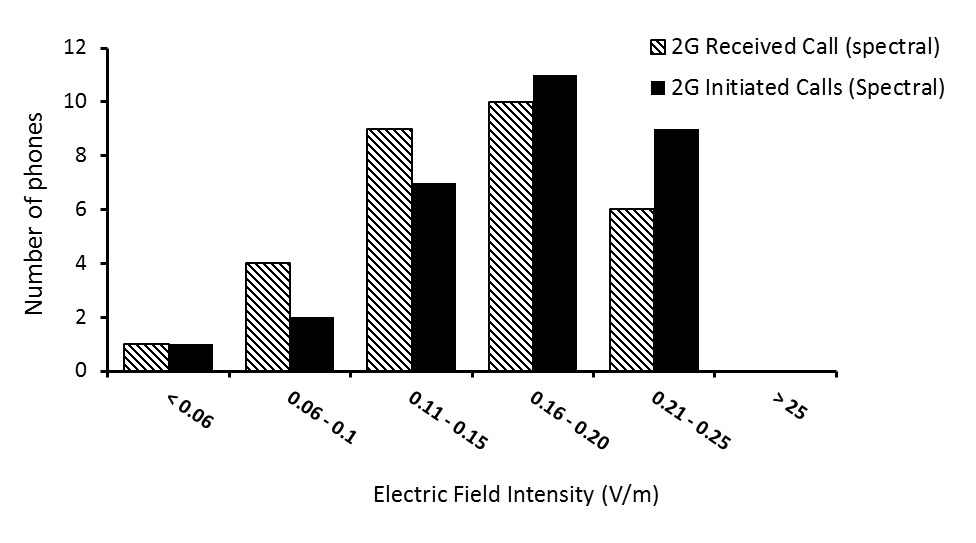
The distributions of the E around the studied mobile phones, obtained from both the broadband and spectral measurements, when initiated and received calls were made, are illustrated in the histograms in Figures 6 to 9. As illustrated in Figure 6, about 76% of the selected 3G phones were found to have E in the range of 16 – 25 V/m around them when calls were received from them during broadband measurements, while about 60% of them were in the range of 0.06 – 0.10 V/m during spectral measurements, as illustrated in Figure 7. Also, during broadband measurements, about 70% of the selected 2G phones had E in the range of 26 – 65 V/m around them when calls were initiated, as illustrated in Figure 8, while about 90% of them had E in the range of 0.11 – 0.25 V/m around them during spectral measurements, as illustrated in Figure 9.
Results of broadband measurements in some other studies show that a highest value of power density of 0.54 mW/m2, equivalent to an E of 45.1 V/m, was obtained at about 10 cm to a mobile phone [28]. Amuda DB, et al. [12] obtained a power density of 0.58 mW/m2, equivalent to an E of 46.8 20 V/m about 20 cm from a mobile phone [12]. Also, Isabona J, et al. [13], reported an E of 20 V/m at about 10 cm from a mobile phone [13]. Conversely, Man et.al., in their study in 2019, performed spectral analyses on some selected mobile phones and obtained a distance versus exposure relationship, which indicates that at 10 cm to one of the selected mobile phones in the study, an E of 0.6 V/m will be obtained [10]. The results of these studies are not far off from those obtained in the current study.
Conclusion
Measurements of the highest electric field intensity (E) at about 10 cm from 60 common mobile phones working on 2G and 3G mobile telecommunication bands in Nigeria were made using a broadband meter and a spectrum analyser. This was done to ascertain the level of RF exposure mobile phones contribute to their immediate environment and their users. The background E before each call was made or received was obtained using the broadband meter and was subtracted from the results of broadband measurements made during active calls in the same environment. The background E around the 60 selected 2G and 3G phones are from 0.03 – 0.76 V/m and 0.02 – 0.70 V/m, respectively.
The highest E associated with the uplink signals from the mobile phones during initiated and received calls were measured using a spectrum analyser. It was observed that all the selected 2G mobile phones in this study were transmitting at GSM 1800 uplink frequencies, and the obtained uplink signal spectra were comparable to the CDMA signal forms. The signal spectrum obtained from the 3G phones was a WCDMA spectrum with a bandwidth of about 5 MHz, emitted at different power levels.
The average value of E obtained from the 3G phones during broadband measurements was 13.70 V/m and 14.45 V/m for received and initiated calls, respectively, while that obtained during spectral measurements was 0.10 V/m and 0.11 V/m for received calls and initiated calls, respectively. For the selected 2G mobile phones, the average value of E obtained during broadband measurements was 43.41 V/m and 48.08 V/m for received and initiated calls, respectively, while that obtained during spectral measurements was 0.16 V/m and 0.17 V/m for received calls and initiated calls, respectively.
This study shows that RF exposure close to the selected 2G mobile phones is higher than that of the 3G phones. The results of both the broadband and spectral measurements in this study indicate that RF exposure due to an uplink signal from a mobile phone is just a small part of the exposure due to the total radiation emission from the phone to the environment. The result of measurements and distribution of the values of E obtained from the 3G and 2G mobile phones shows that the E obtained during initiated calls are slightly higher than received calls.
During spectral measurements, the highest E obtained at about 10 cm from the 3G and 2G mobile phones was 0.20 V/m and 0.33 V/m, respectively. These values are far less than the 61 V/m and 58 V/m limits recommended for 3G (2100 MHz) and GSM 1800 by the ICNIRP, respectively. Therefore, based on the ICNIRP recommendations for the highest level of electromagnetic field emissions from RF devices, selected mobile phones in this study do not pose a thermal health risk to humans [29].
Acknowledgement
The authors acknowledge the support of the Physics Department of University of Ibadan and its radiation and health research group for providing a suitable environment for the success of this study.
References
-
MWF (2018) 20 Years of Research. Mobile and Wireless Forum, Belgium.
-
Ashna KGSN (2016) Generations of Mobile Communication. Int J Adv Res Comput Sci Software Eng 6: 320-324.
-
Adewumi AS, Chizea FD, Ayantunji BG (2020) A Review of cellular networks: Applications, benefits and limitations. Network and Complex Systems 11: 21-33.
-
Al Sadi N, Shehab M, AlZoughool M (2025) Assessment of exposure to RF EMF among telecommunication tower workers in Kuwait. Discover Public Health 22(64).
-
Mladen M, Miroslav P, Aleksandar L, Dragan M, Žarko M (2015) Automatika. Journal for Control, Measurement, Electronics, Computing and Communications 56: 84-90.
-
Ericsson (2019) Ericsson Mobility Report: Q4 2018 Update. Ericsson, Stockholm, Sweden.
-
Ericsson (2020) Ericsson Mobility Report: Q4 update 2019. Ericsson, Stockholm, Sweden.
-
Ericsson (2017) Ericsson Mobility Report: November 2017. Ericsson, Stockholm, Sweden.
-
Cisco Systems Inc (2021) Cisco Visual Networking Index: Global Mobile Data Traffic Forecast Update 2021-2026.
-
Wall S, Wang Z, Kendig T, Dobraca D, Lipsett M (2019) Real-world cell phone radiofrequency electromagnetic field exposures. Environ Res 171: 581-592.
-
Fakhri Y, Majlessi M (2016) Comparison Nokia, Samsung and Sony mobile phones in the specific absorption rate of head induced to electric field. Int J Med Res Health Sci 5: 377-384.
-
Amuda DB, Oni OM, Ayanlola PS, Olayinka OI (2018) Measurement of Electromagnetic Radiation from 30 Mobile Phones among some Students of Ladoke Akintola University of Technology, Nigeria. Int J Adv Acad Res Sci Technol Eng 4: 24-30.
-
Isabona J, Srivastava VM (2017) Electromagnetic field radiation exposure assessment from mobile phones based on call-related factors. International Review on Modelling and Simulations 10(5): 335-362.
-
Olorunfemi E, Ojo J, Aboyeji OS, Akeju M, Okezie C (2016) Determination of Electromagnetic Radiation levels from Cell Phones and GSM Masts in Ile-Ife, Southwest Nigeria. Ife Journal of Science 18: 1041-1051.
-
Loureiro AJF, Gallegos D, Caldwell G (2014) Substandard Cell Phones: Impact on Network Quality and a New Method to Identify an Unlicensed IMEI in the Network. IEEE Communications Magazine 52(3): 90-96.
-
Butticè V, Caviggioli F, Franzoni C, Scellato G, Stryszowski P, et al. (2020) Counterfeiting in digital technologies: An Empirical Analysis of the Economic. Performance And Innovative Activities of Affected Companies Research Policy 49: 1-12.
-
Arekumo TG, Marere O (2024) Assessment of radio- frequency radiation exposure from selected mobile base stations in Yenagoa, Bayelsa State, Nigeria. Physical Science International Journal 28(2): 43-59.
-
Malvandi H, Fallahi M, Saghi MH, Hassanzadeh N (2024) Evaluation of electric field (E) exposure levels and its relationship with the sleep quality of residents around the BTS antennas in Sabzevar, Iran. Radiation Protection Dosimetry 200(15): 1405-1415.
-
Deatanyah P, Amoako JK, Amoatey E, Osei S, Azah CK, et al. (2020) Assessment Of Radiofrequency Radiation Within The Vicinity Of Some Gsm Base Stations In Ghana: A Follow-Up. Radiat Prot Dosim 192: 413-420.
-
Nahuku AMA, Tembo K, Ngwira F, Katengeza E, Nahuku DM (2020) Measurement And Analysis of Radiation Levels From Mobile Phone Base Station in Lilongwe Urban. Advances in Ecological and Environmental Research 5: 121-134.
-
Basu D (2001) Dictionary of Pure and Applied Physics. A Volume in the Comprehensive Dictionary of Physics CRC Press, Florida, pp: 400.
-
Bevelacqua PJ (2016) Smartphone cellular mobile phone antenna design, antenna theory.
-
Rowell C, Lam EY (2012) Mobile-phone antenna design. IEEE Antennas and Propagation Magazine 54: 14-34.
-
Kivekas O, Ollikainen J, Lehtiniemi, T, Vainikainen P (2004) Bandwidth, SAR, and Efficiency of Internal Mobile Phone Antennas. IEEE Transactions on Electromagnetic Compatibility 46: 71- 86.
-
Cember H, Johnson E (2009) Introduction to health physics. CABI, New York, 4.
-
Al-Mously SI, Yahya RI (2010) Temperature rise computation in the human head exposed to different mobile phone models. Al- Mustansiriya J Sci 21: 159 -178.
-
Kent M (2006) The Oxford Dictionary of Sports Science & Medicine. Oxford University Press, United Kingdom, 3.
-
Oluwafemi IB, Adeoye OJ (2020) Mobile phone radiofrequency radiation assessment based on call- related factors and physical condition from selected mobile phones. European Journal of Engineering Research and Science 5: 343-347.
-
MWF (2019) 2018 MWF Annual Report. Mobile & Wireless Forum, Belgium.
- Asymmetry Irreversible Heterogeneity Quantum Cosmology Grand Mathematical PHYSICS
- Early Universe: Hadronic Crystals Coherent Micro Gravitational Wave Emitters PHYSICS Part II
- The Solar System Constraint Maze: A Scientific Dead-End Revealing the Interuniversal Machine
- Early Universe Magneto-Gravitational Coupling Genesis Physics: Part I
- Falsifiability of the Classical Law of Gravitation and Unveiling the Time-temperature Entanglement of the Universe
- Origin of Ancient Civilisations The Southern Hemisphere’ Scenario