Yield Performance and Adaptability of Released Upland Rice Varieties in North Western and Western Tigray, North Ethiopia
The experiment was conducted at maitsebri agricultural research center, Maitsebri on station, Mezekire and Humera, aiming at identifying stable and adaptable upland rice varieties to rice growing environment through enhanced improved rice technologies. A randomized complete block design with three replications was used. Data on yield and major yield related traits were collected. Varieties had significant effect on yields which were 4433, 4109 and 3920 kg/ha for Maitsebri-2, N-16 and Maitsebri-1 respectively. The results revealed that highly significant variations were obtained for days to heading and maturity, plant height, panicle length, grain yield and biomass yield among the genotypes and their genotype by environment interaction. Yield stability and adaptability of yield performance were analyzed by combined analysis and AMMI model. From the current study the combined analysis of variance for grain yield revealed highly significant at (P<0.01) for genotypes, environments and their interactions. The significant interaction indicated that the genotypes respond differently across the different environments. The combined ANOVA and AMMI analysis for grain yield of eight upland rice genotypes at 4 environments showed that environments, genotype and G x E interaction revealed highly significant (P<0.01) variations. Considering all genotypes, Hidassie and F-3730 were found the earliest maturity. But since the new alternative varieties were evaluated against Maitsebri-2 (as standard check) and with there is no superior variety over Maitsebri-2 (4433) while since the combined data showed since there is significance difference in gene* environment and with Adet (3589 kg/ha) also gave reseaonable yield as compared Maitsebri-2 (2805 kg/ha) at humera site. So, variety Adet proceeds to demonstration, popularization and pre extension to contribute on food security of the farmers’ in Humera area.
Introduction
Rice (Oryza sativa L.) is the most important food crop for nearly half of the world’s population [1]. Worldwide, rice is cultivated on an area of 154 million hectors with an annual production of 700 million tonnes [2]. Rice is an important crop which supplies staple food for nearly 50% of the global population [3, 2]. Among the most cultivated cereals in the world, rice ranks as second to wheat [4]. Rice occupies a unique position in many nations because for its importance in traditional diets and the main source of income of many people in the whole world.
Rice is among the important cereal crops grown in different parts of Ethiopia as food crop. The country has immense potentials for growing the crop. It is reported that the potential rice production area in Ethiopia is estimated to be about 5.4 million hectares. According to National Rice research and document strategy (2009), the trend in the number of rice producing farmers, area allocated and production shows high increase rate especially since 2006.
Grain yield in rice is a complex character and it easily affected by environment, management and genotype [5]. Breeding and adoption of rice cultivars with enhanced yield potential and short growth duration is a common objective of the breeders. So, analysis of interaction of genotypes with locations and other agro-ecological conditions would help in getting information on adaptability and stability performance of genotypes. The method commonly used for analysis of G×E interaction is the Linear Regression model of Eberhart and Russell [6] in which the b values give information about adaptability and S2 di and R2 are used as measures of stability of performance. Other workers have suggested use of AMMI stability value (ASV) as measure of stability. The Additive Main and Multiplicative Interaction (AMMI) is a better model for analysis of G×E interaction in multi-location varietal trials [7]. It not only gives estimate of total G×E interaction effect of each genotype but also partitions it into interaction effects due to individual environments. Adaptation and yield stability studies help in identifying varieties that have either specific or general adaptation which can be exploited for varietal recommendation. The yield variation due to changing environment is commonly referred to as genotype × environment interaction (G × E). G × E usually complicates the process of selecting superior genotypes. Consequently, multi environment trials (METs) are widely used by plant breeders for evaluating the relative performance of genotypes over the target environments [8].
Low productivity, diseases occurrence and environmental fluctuations are rice production constraints in Ethiopia. Low productivity, mainly in the upland rice production system, is attributed to, among other things, stable and lack of high yielding varieties, terminal water deficit and low soil fertility [9].
Any crop improvement program depends on the utilization of germplasm stock available in different research organizations/institutes of the world. So, to meet the world's rice requirements will also depend upon the development of high yielding varieties having resistance against biotic and abiotic stresses using conventional and biotechnological approaches. Hence, the present study was undertaken to analyze G×E interaction and evaluate the adaptability and stability of yield performance of eight upland rice genotypes with the following specific objectives: Objective of the study
- To evaluate and select the best high yielding and earl maturing upland rice variety
- To recommend and demonstrate the best varieties under upland rice growing environments
Materials and methods
Plant material
This study comprised of eight (8) varieties i.e., Hidassie , Adet, Maisebri-1, N-16, Andasa, F-3730, Tana with the newly released Maitsebri-2 (as standard check) and those materials was planted in the field using randomized complete block design (RCBD) with three replications at Tselemti (onstation and Mezekire kebeles) and Humera district in 2016 & 2017 main season. Each experimental plot had an area of 7.5 m2 with 5m length separated by a distance of 1.5 m between blocks and 0.5m between plots within a block. A spacing of 25 cm between rows was maintained. A seeding rate of 70 kg/ha was used for all plots within each block. All plots were fertilized uniformly at the rate of 100 kg/ha Urea and 100 kg/ha DAP. All DAP and one third of Urea was applied at planting. The remaining two third urea were divided in to two and applied at mid tillering and panicle initiation (near flowering) stages of the crop. All other cultural practices were applied uniformly to all plots as per standard recommendations for the crop.
Result and Discussion
Analysis of Variance
Analysis of variance of multi-location trials is useful for estimating variance components related to different sources of variation, including genotypes, environments and genotype by environment interactions. In addition, it depicts the consistency/inconsistency of genotypes over environments, the extent of similarity/deviation of certain environment for others.
The combined analysis of variance of mean square values of all the morphological traits are presented in Table 1. All the genotypes except for number of fertile tillers per plant, showed highly significant variations for all the traits studied. The extent of variability for any character is very important for the improvement of crop through breeding. So, significant variation in all the traits studied indicated the presence of high genetic diversity among all the genotypes of rice. But significance difference among during gene by environment indicated yield and yield related performance of the genotypes were affected by the variability of the environments.
Days to Maturity
A statistically significant (p<0.05) difference was observed on the days to 90% maturity due to the genotypes variation. Eearlier flowering and matured genotypes would escape the severe water stress and had higher grain yields. Table 1 showed that the days to maturity were significantly different between genotypes. So, variety F-3730 is relatively early and recommend for moisture stress areas.
Grain Yield
Grain yield is an important agronomic trait [10]. The genotypes showed statistical difference in individual locations and across the testing sites at (p<0.05). Rice grain yield is a quantitative polygenic character and highly influenced by environment. Extent and significance of association of yield with yield components should be considered, while determining the selection criteria of germplasm on the basis of available genetic variation. The success of breeding program also depends upon the amount of genetic variability present in the population and extent to which the desirable traits are heritable. Different morphological traits play very important role for more rice production with new plant type characteristics associated with the plant yield [11, 12]. Phonological properties of rice also associated with the yield potential of the different rice varieties for the selection of the best varieties that further involved in rice breeding program.
So, as is depicted in table 3, days to 90% physiological maturity (DM), plant and panicle height (PH), grain yield (GY) and biomass yield (BY) were significantly (P< 0.05) influenced among the genotypes and their genotype by environment interaction and this indicated the genotypes were highly influenced by the environment and there is inconsistence of the genotypes across environment.
Mean Performance of Genotypes
The overall mean performance of the seven (7) genotypes entries along with the one standard check evaluated for grain yield and related agronomic traits evaluated at Maitsebri -onstation, Boreke and Humera were given in Table 1.
| SN | Gene | DM | PHt | PL | NFTpP | 1000Swt | GY kg/ha | BY kg/ha |
|---|---|---|---|---|---|---|---|---|
| 1 | Hidassie | 103.75 | 91.14 | 19.43 | 6.13 | 26.57 | 3269 | 7473 |
| 2 | Adet | 109.25 | 96.72 | 18.73 | 5.87 | 27.48 | 3803 | 8836 |
| 3 | Maits-1 | 105.58 | 86.25 | 19.27 | 4.98 | 25.96 | 3920 | 8407 |
| 4 | N-16 | 108.17 | 90.83 | 19.01 | 5.38 | 26.88 | 4109 | 9085 |
| 5 | Andassa | 105.58 | 92.26 | 18.97 | 4.85 | 27.09 | 3251 | 8103 |
| 6 | F-3730 | 103.33 | 85.9 | 18.8 | 5.6 | 26.59 | 3716 | 8231 |
| 7 | Tana | 105.92 | 91.15 | 18.93 | 5.52 | 26.72 | 3586 | 8360 |
| 8 | Maits-2 | 111.17 | 112.76 | 21.08 | 6.23 | 28.68 | 4433 | 10844 |
| Mean | 106.59 | 93.38 | 19.28 | 5.57 | 26.99 | 3761 | 8667 | |
| LSD | 1.961 | 5.114 | 1.047 | 1.157 | 1.439 | 418.8 | 975.6 | |
| CV | 2.3 | 6.7 | 6.7 | 25.5 | 6.5 | 13.6 | 13.8 | |
| F-test | Gene | ** | ** | ** | Ns | * | ** | ** |
| Envit | ** | ** | ** | ** | ** | ** | ** | |
| Gene*Env't | ** | ** | * | * | * | ** | ** |
Table 1: Combined yield and yield related response of 8 upland rice genotypes across 4 environments. Key: DM- days to 75% maturit
Table 1: Combined yield and yield related response of 8 upland rice genotypes across 4 environments. Key: DM- days to 75% maturity, PHt-plant height(cm), PL- panicle length(cm), NFTpP-No of fertile tiller per plant,1000Swt- thousand grains weight(g), GY kg/ha-Grain yield per ha in kilogram, BY kg/ha-biomass yield per ha The mean grain yield value of genotypes averaged over environments indicated that Maitsebri-2 had the highest (4433 kg ha 1) and Andassa lowest (3251 kg ha 1) grain yield respectively and to conclude the alternative varieties which were released nationally by different research centers were scored low yield as compared the newly released variety of Maitsebri-2(the standard check) at Maitsebri areas but as the individual location mean performance of the genotypes indicated in Table 2, Adet variety is superior yielder as compared the standard check, Maitsebri-2 and the other variety in Humera testing site since the combined data analysis also showed significant and possible to recommend separate variety recommendation across the testing site.
| Maitsebri onstation | Humera | Maitsebri Mezekire | |||
|---|---|---|---|---|---|
| SN | Gene | ||||
| 2016 | 2017 | 2017 | 2017 | ||
| 1 | Hidassie | 2975 | 3711 | 2558 | 3833 |
| 2 | Adet | 2842 | 3844 | 3589. | 4937 |
| 3 | Maits-1 | 3117 | 5372. | 3031 | 4160 |
| 4 | N-16 | 3042 | 4839 | 3180 | 5375 |
| 5 | Andassa | 3067 | 4622. | 2404 | 2910 |
| 6 | F-3730 | 2975 | 4617 | 3174. | 4097 |
| 7 | Tana | 3125 | 4411 | 2891 | 3917 |
| 8 | Maits-2 | 3650 | 5817 | 2805 | 5458 |
| Mean | 3099 | 4654 | 2954. | 4336 |
Table 2: Individual grain yield performance of 8 upland rice genotypes across 4 environments Key: GY kg/ha-Grain yield per ha in
Table 2: Individual grain yield performance of 8 upland rice genotypes across 4 environments Key: GY kg/ha-Grain yield per ha in kilogram. AMMI analysis of variance: AMMI analysis of variance for grain yield revealed that effects due to environments, genotypes and their interaction were significant (P<0.01) indicating that environments were divers and genotypes respond variably (Table 3). In the present study, the magnitude of GE interaction sum of squares was larger than that of genotypes, indicating substantial differences in genotypic response across test environments.
| SN | Source | Df | SS | MS | ||||||||||
|---|---|---|---|---|---|---|---|---|---|---|---|---|---|---|
| 1 | Total | 95 | 100570591 | 1058638 | ||||||||||
| 2 | Treatments | 31 | 83702667 | 2700086** | ||||||||||
| 3 | Genotypes | 7 | 13608366 | 1944052** | ||||||||||
| 4 | Environments | 3 | 53221893 | 17740631** | ||||||||||
| 5 | Block | 8 | 1125592 | 140699ns | ||||||||||
| 6 | Interactions | 21 | 16872409 | 803448** | ||||||||||
| 7 | IPCA1 | 9 | 9904426 | 1100492** | ||||||||||
| 8 | IPCA2 | 7 | 5788012 | 826859* | ||||||||||
| 9 | IPCA3 | 5 | 1179970 | 235994ns | ||||||||||
| 10 | Error | 56 | 15742332 | 281113 |
Table 3: AMMI Anova of upland rice genotypes. Key: **- Significance difference at 1% level of probability, ns- not Significance d
Table 3: AMMI Anova of upland rice genotypes. Key: **- Significance difference at 1% level of probability, ns- not Significance difference at 5% level of probability certain environment .The characterization of each promising lines (genotypes) to mean grain yield and contribution to GEI by mean of IPCA1 (Figure 1) indicates that genotypes G5, G7, and G6 were specifically adapted to high yielding environments (E1) with grain yield more than grand average yield (Figure 1), and with respect to their contribution to GEI (i.e. stability) the IPCA1 score, G5 was the most unstable genotype and also adapted to higher yielding environments, G6 was more stable in comparison to G7 and G3. However, G1 was low yield genotype and relatively stable. On the other hand, G1, G2 and G4 were adapted to low yielding environment but not stable (Figure 1). The best genotype needs to combine good grain yield and stable performance across a range of production environments. For example, a genotype G6 can be judged based on its stability over the environments, which combined low absolute IPCA-I score with good grain yield, was the overall winner with less variable yield across the environments explaining its suitability as one of the leading promising line for such trials.
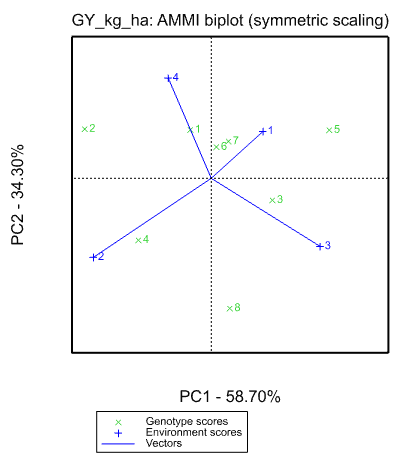
AMMI-2 biplot: When IPCA1 was plotted against IPCA2 (Figure 2), genotypes; G6 was found closer or at a lesser distance from the center of the biplot when compared with other genotypes and that would be considered as most stable genotype with regard to its lesser contribution to GEI. On the contrary, G8, G2, G5, and G4 exhibit longer vector from origin indicating the high contribution of these genotypes to GEI (i.e. unstable genotypes). The AMMI2 biplot also revealed that the environments were divers and exhibits longer vectors from origin especially E1 and E2, and that imply their higher contribution to environment sum of square. The longer vector of environments compared to genotypes explain the higher sum of square of environments as compared to Sum of squares of genotypes in the ANOVA table (Table 2). The best genotypes with respect to environments E1 were G6, G7 and G5. The greater the IPCA scores, either positive or negative, as it is a relative value, the more specifically adapted a genotype is to certain environments. The more IPCA scores approximate to zero, the more stable the genotype to over all environments sampled [13].
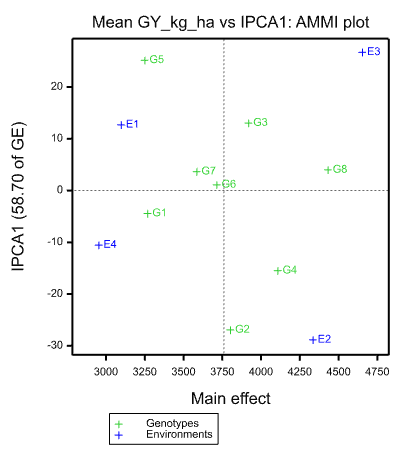
Figure 2: AMMI-2 biplot main effects of 8 upland rice genotypes based on mean grain yield. GGE-Biplot and stability analysis: GGE biplot best identifies G x E interaction pattern of multi environment data and clearly shows which variety performs best in which environments. In the present study, the first principal component axis (PC1) explained 63.84 % of total variation while PC2 explained 30.80%. Thus, the two axes together accounted for 94.64 % of the GGE variation for grain yield (Figures 1-4). Which-won-where pattern analysis: In the which-won- where concept of GGE biplot, genotype markers furthest from the biplot origin are connected with straight lines to form a polygon. The markers of test environments are separated into different sectors and the genotype at the vertex for each sector is the winner genotype at environments included in that sector. According to the biplot in Figure 1, the vertex genotypes were G1, G2, G6 and G8. These genotypes were the best or the poorest genotypes in some or all of the environments because they were farthest from the origin of the biplot. In this biplot, environments are also divided into different sectors. The first sector represents E1, E2 and E3; with genotype G8 as the best yielder genotype and the second sector represents E4; with genotype G2 as the most favourable genotype. The other vertex genotype, G6 which was located far away from all of test environments, implied that it did not yield well at any of the test environments (Figure 3).
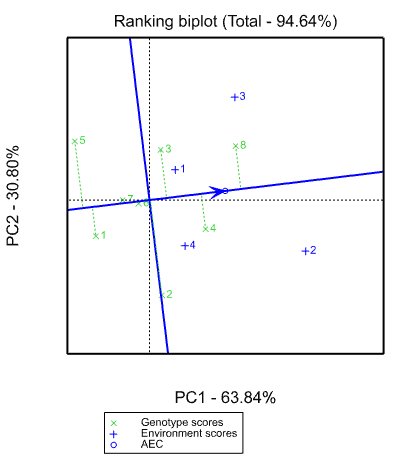
Figure 3: Which wins where or which is best for upland rice. Mean performance and stability of genotypes using ranking biplot: The Biplot analysis indicated that the AEC view of the GGE biplot. The average tester coordinate (ATC) separates genotypes with above average mean from below average means. Thus, genotypes with above average means were G3,G4 and G8, while G1, G5 and G7 were genotypes which had below average mean performance (Figure 2). The shorter the genotype vector is more stable it is than others. Thus, among tested genotypes G4,G8 and G6 were identified as high yielder and stable genotype while G1 and G5 were identified as low yielding with poor stability (long vector length) in figure 4. In agreement with this finding in their finding reported high yielder and stable genotype as well as low yielding and poorly stable genotypes.
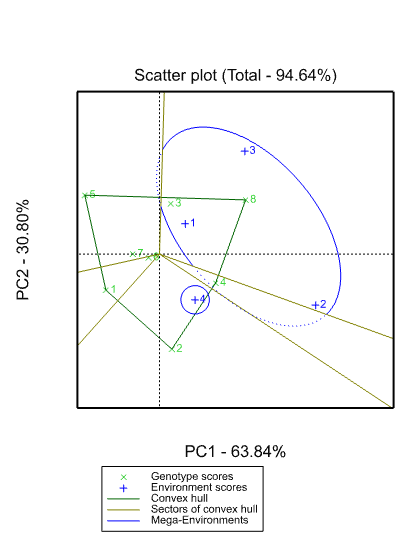
Figure 4: GGE ranking biplot based on mean grain yield and stability performance of tested genotypes. Stability using yield stability index (YSI): The yield stability index (YSI), is calculated by ranking the mean grain yield of genotypes across environments and rank of AMMI stability value (RASV). The YSI incorporates both mean yield (RYA) and stability in a single criterion as follows: YSI = Ranking of ASV + Ranking YA low value of this parameter shows stable genotypes with a high mean yield. By using these measures, suitable rice varieties can be identified for varying existing environmental conditions. Since as previous studies indicated stability per se performance should however not be the only selection parameter because the most stable genotypes would not necessarily give the best yield; hence, there is a need for approaches that incorporate both mean yield and stability in a single index and that is why various authors have introduced different selection criteria for simultaneous selection of yield and stability using yield stability index. The lowest AMMI stability value (ASV) takes the rank one, while the highest yield mean takes the rank one and then the ranks are summed in a single simultaneous selection index of yield and yield stability. The genotypes with lowest value of this parameter are desirable genotypes with high mean yield and stability. So, in the current study G8(Maitsebri-2),G6(F-3730) and G4(N-16) genotypes scored lower yield stability index value and this indicated most stable genotypes with good yield mean grain yield performance as indicated in Table 4.
| Genotype | Entry | Gmean | RankYield | IPCA-1 | IPCA-1 | ASV | Rank by ASV | YSI (Yield rank | Pedigree | ||
|---|---|---|---|---|---|---|---|---|---|---|---|
| +ASV rank) | |||||||||||
| G1 | 1 | 3269 | 7 | -4.44494 | 10.31633 | 12.80 | 3 | 10 | Hiddassie | ||
| G2 | 2 | 3803 | 4 | -26.9279 | 10.45591 | 47.25 | 8 | 12 | Adet | ||
| G3 | 3 | 3920 | 3 | 13.0246 | -4.66821 | 22.67 | 4 | 7 | Maits-1 | ||
| G4 | 4 | 4109 | 2 | -15.4969 | -13.1767 | 29.51 | 6 | 8 | N-16 | ||
| G5 | 5 | 3251 | 8 | 25.14278 | 10.26085 | 44.04 | 7 | 15 | Andassa | ||
| G6 | 6 | 3716 | 5 | 1.09789 | 6.64464 | 6.90 | 1 | 6 | F-3730 | ||
| G7 | 7 | 3586 | 6 | 3.63746 | 7.85616 | 10.01 | 2 | 8 | Tana | ||
| G8 | 8 | 4433 | 1 | 3.96699 | -27.689 | 28.51 | 5 | 6 | Maits-2 |
Table 4: Stability index of genotypes using ASV and grand mean ranking of rice varieties.
Conclusion and Recommendation
Variety development is one of the major research focuses of the national and regional rice research programme to address the increasing demand for improved varieties and to keep sustainable rice production in the country through selection and introduction. The presence of the genotype by environments interaction for grain yield was indicated by the differential ranking of genotypes over the various environments. From this study it can be concluded that the significant genotype by environment interaction (GEI) in grain yield among the genotypes revealed differential response of the genotypes across the testing environments. It is, therefore, difficult to identify one superior genotype for all the locations which was included in the trial since the genotypes vary in grain yield performance across the environment due to the presence of either genetic diversity or variation in environments. The present study consisted of seven (7) genotypes along with one popular standard check were evaluated at Maitsebri onstation, Mezekire and Humera in Ethiopia during the 2016 and 2017 cropping season with the objective of assessing the nature and magnitude of GEI and determine the response of different genotypes to varying environments to identify high yielding stable upland rice genotypes for upland ecosystem of Ethiopia. The combined analysis of variance revealed significant (p<0.01) for genotype and environment. It is indicated that the ranking of the genotypes were different and this need separate variety recommendation on the individual environments. From the current finding, Genotypes with above average means were G3, G6, G7 and G8, while G1,G5 and G7 were genotypes which had below average mean performance (Figure 2). Thus, relatively among tested genotypes G4(N-16), G6(F-3730) and G8
References
-
Sellamuthu R, Liu GF, Ranganathan CB, Serraj R (2011) Genetic analysis and validation of quantitative trait loci associated with reproductive-growth traits and grain yield under drought stress in a doubled haploid line population of rice (Oryza sativa L.). Field Crops Research 124: 46-58.
-
FAO (2011) The State of Food Insecurity in the World.
-
Garris AJ, Tai TH, Coburn J, Kresovich S, McCouch S (2005) Genetic structure and diversity in Oryza sativa L. Genetics 169(3): 1631-1638.
-
Abodolereza A, Racionzer P (2009) Food Outlook: Global Market Analysis, pp: 23-27.
-
Xing Y, Zhang Q (2010) Genetic and molecular bases of rice yield. Annu Rev Plant Biol 61: 421-442.
-
Eberhart SA, Russell WA (1966) Stability parameters for comparing varieties. Crop Science 6(1): 36-40.
-
Zoble RW, Wright MJ, Gauch HG (1988) Statistical analysis of a yield trial. Agron J 80(3): 388-393.
-
Delacy IH, Cooper M, Basford KE (1996) Relationships among analytical methods used to study genotype-by-environment interactions and evaluation of their impact on response to selection, "Genotype-by environment interaction", In: Kang MS, Gauch HG (Eds.), CRC Press, Boca Raton, FL, pp: 51- 84.
-
Ministry of Agriculture and Rural Development (MoARD) (2010) National Rice Research and Development Strategy of Ethiopia. Addis Ababa, Ethiopia, pp: 48.
-
Richards RA (2000) Selectable traits to increase crop photosynthesis and yield of grain crops. J Experimental Botany 51(1): 447-458.
-
Yang J, Zhu J, Williams RW (2007) Mapping the genetic architecture of complex traits in experimental populations. Bioinformatics 23(12): 1527-1536.
-
Yang XC, Hwa CM (2008) Genetic modification of plant architecture and variety improvement in rice. Heredity 101: 396-404.
-
Purchase JL (1997) Parametric analysis to describe GEI interaction and yield stability in winter wheat. PhD Dissertation. Department of Agronomy, Faculty of Agriculture, University of the Free State, Bloemfontein, South Africa. pp: 148.
- Enhancement of Vegetative Growth and Fruit Yield in Cucumber (Cucumis sativus L.) via Spiritual Blessing (Biofield) Energy Intervention
- Production of Açaí (Euterpe oleracea Mart.) under Different Agroforestry System Management Intensities in Amazonian Floodplain (Varzea) Forests
- Coffee and the Production Region: What is the Secret to the Expression "Quality"?
- Experiential Agripreneurship Training in Sub-Saharan Africa: Integrating a Business Incubator into Postgraduate Livestock Education at the University of Buea
- Advances in Agricultural High-Quality Development
- Linking Compost Residue to ABAGE in Plants - a Short Note