Response of Bread Wheat (Triticum aestivum L.) Varieties to Blended Fertilizer Rates on Quality Attributes and Economic Advantages
Bread wheat (Triticum aestivum L.) quality is an important component of the crop productivity as it improves both food security and income sources for farmers. However, its grain quality and economic yields are mainly constrained by poor soil fertility and lack of site specific fertilizer recommendation in the study area for specific variety. Therefore, a field experiment was conducted in Tiyo district of Arsi Zone, Ethiopia, on farmer's field in 2018 main cropping season in response of bread wheat varieties to blended fertilizer rates on quality attributes and its economic advantages. Factorial combination of two improved bread wheat varieties (Wane and Kingbird) and seven fertilizer treatments [Control, Recommended NP (150 kg ha-1 TSP (69%P2O5 ) + 158.7 kg ha-1 Urea (73 N)), 100 kg NPSB + recommended urea (46 kg N) , 150 kg NPSB + recommended urea, 200 kg NPSB + recommended urea, 250 kg NPSB + recommended urea, 300 kg NPSB + recommended urea.] were laid out in randomized complete block design with three replications. Results revealed that grain protein content and hectoliter weight were significantly affected by the main effect of varieties and fertilizer rates with highest grain quality obtained from Wane variety at 200 kg NPSB + 100 kg Urea ha-1 , and recommended NP fertilizer application. The partial budget analysis results revealed that the application of 200 kg NPSB ha1 + 100 kg Urea ha-1 on Wane and Kingbird varieties gave maximum marginal rates of return of 992.8% and 546.3% with highest net benefits respectively. Therefore, application of NPSB at the rate of 200 kg NPSB ha-1 + 100 kg Urea ha-1 in the production of Wane and Kingbird varieties produced better bread wheat quality and economic advantages for the experimental area of wheat production.
Introduction
Wheat (Triticum aestivum) is the most important and the second widely cultivated crop, after corn, which played a fundamental role in combating hunger and improving the global food security [1]. The grains of wheat provide about 20% of all calories and proteins to humans [2] and produce good flour for making bread, cakes, sweet yeast goods, cookies, and crackers as well as the use in blended mixes. In recent years, demand for wheat grains has significantly increased due to the global population growth, and thus wheat industry is facing a competitiveness crisis [1].
Wheat grows under a broad range of latitudes and altitudes; it is not only the most widely cultivated crop but also the most consumed food crop all over the world [3]. Wheat is one of the most important cereals cultivated in Ethiopia. Ethiopia is the largest producer of wheat in sub- Saharan Africa (SSA), over 1.8 million hectares annually [4]. It ranks fourth after maize, tef and sorghum both in area coverage and production [5]. Wheat production in the country is adversely affected by low soil fertility and suboptimal use of mineral fertilizers in addition to diseases, weeds, erratic rainfall distribution in lower altitude zones, and water-logging in the Vertisols areas Amanuel G & Stewart WM [6, 7] Reported that 50 to 60% of the increase in crop yields worldwide was due to application of chemical fertilizers. They also stated that during the 21st century, the essential plant nutrients would be one of the factors limiting crop yields, especially in developing countries; the main factors responsible for low yield are more or less plant population and inadequate crop nutrition. Nutritionally, bread wheat grain is high in carbohydrates: whole grain wheat flour contains roughly 70% carbohydrate, 11.5% protein (varying from 8-15%), 2% fat, 2% fibre, 1.5% ash, and 13% water [8].
Declining of soil fertility in agricultural soils exacerbated by improper land use, yield and water productivity in the rain fed systems in many Sub-Saharan Africa countries is decreasing or stagnating [9]. About 97% of agricultural land in Sub-Saharan Africa is under rain fed system Bai Z & Mosisa W [9, 10] described nutrient depletion as a major biophysical factor limiting small-scale production in Africa. Inappropriate cropping systems, mono cropping, nutrient mining, unbalanced nutrient application, removal of crop residues from the fields and inadequate re-supplies of nutrients have contributed to decline in crop yields [11]. Low soil fertility due to monoculture cereal production systems is recognized as one of the major causes for declining per capita food production. Declining soil fertility is also an important bottleneck for smallholder cereal growers in central western parts of Ethiopia [12]. Continuous monocultures of cereals also result in reduction of yields and soil nutrients [13, 14]. Declining yield and soil fertility as a result of continuous mono-cropping have also been reported for finger millet [15, 16].
Grain quality is expressed through a complex of indices including its physical properties, chemical composition and bio-chemical and technological characteristics, which are variety-specific [17]. Gluten proteins, consisting of gliadins and glutenins, play an important role in the bread-making quality of wheat flour as gliadins mainly contribute to dough viscosity and extensibility, while glutenins to dough strength and elasticity [18]. Wheat quality can be assessed using a variety of approaches that range from the physical measurement of the dough characteristics to chemical fractionation of the protein [19]. Protein content is a character determining the water absorbing ability, stability, resistance and elasticity of flour. The protein content in flour is the main quality criterion for wheat, especially for bread making [20]. Wheat grain protein content is frequently used as the main measurement of grain quality [21] and indicators for milling and baking [22]. Protein content in cereals is one of the most important quality parameters for marketing. Many studies have attempted to relate wheat proteins to breadmaking quality [23, 24, 25, 26, 27]. The positive effects may be attributed mainly to the N rate effect since the fertilizer N use efficiency can be enhanced by split N application under appropriate environmental conditions, which resulted in higher plant N uptake [28, 29]. Szentpetery [30] demonstrated that intensified wheat fertilization with N resulted in better milling and baking quality through increased hectoliter weight, grain protein content and bread volume.
Materials and Methods
Description of the Study Area
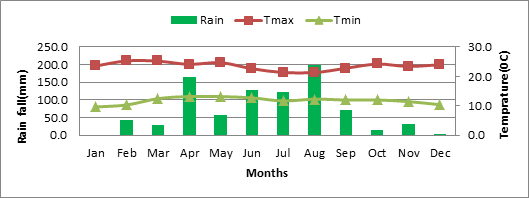
The experiment was conducted at Tiyo district around Kulumsa Agricultural Research Center (KARC) on farmer field located at about 167 km South East of Addis Ababa (Arsi Zone, Oromia-Ethiopia). Its geographical location is 8° 02’ N latitude and 39° 10’ E longitude, representing a medium altitude at 2200m above sea level with moderate rainfall of 848 mm per annum. Tiyo wereda was potential area for cereals and highland pulses, the area is dominated by continuous monoculture of cereals especially wheat which exhaust the same kind of nutrients season to season. It has a unimodal rainfall pattern with extended rainy season from March to September. However, the peak season is from July to August. The mean annual maximum and minimum temperature is 23.1°C and 9.9°C respectively. During the months of July to September, the rain fall is higher than the full potential evapotranspiration [31].
Experimental Materials
Planting materials: Wane and Kingbird bread wheat varieties were used as planting materials. The appropriate application of NPSB blended fertilizer rate in the experimental area, these varieties were selected based on their adaptability to agro-ecological zone of the area, productivity and resistant for disease (Table 1).
| No | Bread Wheat Varieties | Agro- ecology | Year of release | Altitude(m) | Rainfall | Maturity days | On station productivity |
|---|---|---|---|---|---|---|---|
| (mm) | (q ha-1) | ||||||
| 1 | Kingbird | Midland | 2015 | 2000-2200 | 800-1000 | 133 | 40 - 50 |
| 2 | Wane | Midland | 2016 | 2000-2300 | 750-1500 | 120 | 50 - 65 |
Table 1: Descriptions of the Bread wheat varieties to be used in the experiment.
Source: Kulumsa Agricultural Research Center (KARC), Wheat breeding program (2017). Table 1: Descriptions of the Bread wheat varieties to be used in the experiment.
Fertilizer Materials: TSP (69% P2O5) and Urea (73% N) for recommended rate of NP and Urea (46% N) were used as the supplementary fertilizers for making NPSB optimum amount for the crop productivity. The blended NPSB fertilizer rates (18.1% of N, 36.1% of P2O5, 6.7% of S and 0.71% of B) in 100 kg bags as shown in AACC [32]. Farmers and other bread wheat producers use Urea (100 kg) and DAP (150 kg) for recommended NP (73% N and 69% P2O5). But in this time DAP was out of the market. For this research it used TSP instead of DAP fertilizer. 150 kg of DAP have (69% P2O5 + 27% N) but 150 kg TSP have only 69% of P2O5. To compensate the remaining 27% of N and fulfill the 73% N, add the Urea fertilizer until the recommended fertilizer was balanced.
Treatments and Experimental Design
The experimental design used for this experiment was Randomized Complete Block Design (RCBD) with factorial arrangement of two varieties (Wane and Kingbird) and seven fertilizer rates with three replications which comprised a total of 14 treatment combinations (Table 2).
| Fertilizer rates | N | P O 2 5 | S | B |
|---|---|---|---|---|
| Control | 0.00 | 0.00 | 0.00 | 0.00 |
| 150 kg TSP + 158.7 kg Urea h-1 | 73.00 | 69.00 | 0.00 | 0.00 |
| 100 kg NPSB + 100 kg Urea ha-1 | 64.10 | 36.10 | 6.70 | 0.71 |
| 150 kg NPSB + 100 kg Urea ha-1 | 73.15 | 54.15 | 10.05 | 1.07 |
| 200 kg NPSB + 100 kg Urea ha-1 | 82.20 | 72.20 | 13.40 | 1.42 |
| 250 kg NPSB + 100 kg Urea ha-1 | 91.25 | 90.25 | 16.75 | 1.78 |
| 300 kg NPSB + 100 kg Urea ha-1 100.30 | 108.30 | 108.30 | 20.10 | 2.13 |
Table 2: Detail treatment of fertilizer rates used for the experiment and their nutrient contents.
N, Nitrogen; P2O5, di phosphorus pento Oxide; S, Sulfur; B, Boron; TSP, Triple Super Phosphate; and NPSB, Nitrogen Phosphorus Sulfur and Boron Table 2: Detail treatment of fertilizer rates used for the experiment and their nutrient contents.
Experimental Procedures and Management
The gross experimental area was 42.9m x 14m (600.6m2), Gross Plot size of 4m x 2.6m (10.4m2) and net plot size of 3 m x 2m (6m2). The spacing between rows, plots and blocks were 0.20m, 0.5m and 1 m, respectively. By excluding the two outer rows from both sides of a plot and a 0.25m row length on both ends of each plant, row of each plot to avoid border effects resulting in to a net plot size.
The land was ploughed two times including land clearing or removing unwanted materials from the field. Then, a field layout was made and each treatment was assigned randomly to the experimental units within a block. Seed of bread wheat varieties were sown at the recommended seed rate of 125 kg ha-1 in rows of 20 cm spacing and sown in row of 3-4cm depth by using mechanical row marker and the seed was drilled manually in the rows at June 29, 2018. NPSB blended fertilizer rates are applied at sawing time for all plots except control. Supplementary nitrogen fertilizer in the form of Urea was applied in the experiment splits two times to maintain the N requirement of the crop. The whole amount of blended (NPSB) fertilizer and 1/3 of recommended Urea were applied at sowing and the rest of 2/3 of Urea was applied at booting time by top-dressing. Weeding was done two times and Rexido fungicide was applied when the disease occurred. The crop was finally harvested on the basis of crop maturity stage of each variety from the net plot area and threshed manually.
Data Collection
Quality assessment: Wheat samples were uniformly divided through Boerner Divider and analyzed for quality characteristics such as hectoliter weight and protein content according to standard procedures as described in AACC [33].
Economic Analysis
The economic analysis was performed whenever significant difference was observed for mean grain yields with respect to the applied blended fertilizer rates as per the procedures of GenStat [34]. Accordingly, those factors with significant effect were considered for partial budget analysis, dominance and marginal analysis.
The net benefit (NB) was calculated as the difference between the gross field benefit and the total variable (TVC) using the formula: NB= GFB -TVC Where, GFB = Gross Field Benefit, TVC = Total Variable Cost Actual yield was adjusted downward by 10% to reflect the difference between the experimental yield and the yield farmers could expect from the same size field. Any treatment that has higher TVC but net benefits that are less than or equal to the preceding treatment (with lower TVC but higher net benefits) is dominated treatment (marked as “D”). The dominance analysis illustrates that to improve farmers’ income, it is important to pay attention to net benefits rather than yields, because higher yields do not necessarily mean high net benefits. The discarded and selected treatments using this technique were referred to as dominated and un dominated treatments, respectively. For each pair of ranked treatments, % marginal rate of return (MRR) was calculated using the formula:
Where, NBa = the immediate lower NB, NBb = the next higher NB, TVCa = the immediate lower TVC and TVCb = the next highest TCV.
The % MRR between any pair of undominated treatments was the return per unit of investment in fertilizer. To obtain an estimate of these returns, the % MRR was calculated as changes in NB (raised benefit) divided by changes in cost (raised cost). Thus, a MRR of 100% implied a return of one Birr on every Birr spent on the given variable input.
Then, gross yield benefit was obtained by multiplying the adjusted yield by the price of grain (12.5 birr kg-1) for Tiyo districts. The mean market price of wheat was obtained by assessing the market price during 2018 cropping season. Net benefit or net revenue was calculated, by subtracting labor cost (assuming 75 ETB per person) from gross yield. Total variable cost (TVC) equals to fertilizer cost Birr ha-1 plus fertilizer application and transport cost in Birr. Net revenue (NR) was obtained by subtracting TVC from total revenue (TR). The average open market price (9 birr kg-1) for wheat crop and the official prices of DAP (7.98 birr kg-1), Urea (10.66 birr kg-1), NPSB (11.40 birr kg-1) , Finally, marginal rate of return (MRR) in percentage was calculated as the change in net revenue (NR) divided by the change in total variable cost (TVC) multiplied by hundred. This enables’ to make farmer recommendations from marginal analysis.
Data Analysis
All data collected were subjected to analysis of variance (ANOVA) procedure using GenStat (17th Edition) software [34, 35]. The comparisons among treatments means with significant difference for measured characters was done by LSD test at 5% level of significance.
Results and Discussion
Quality Parameters
Grain protein content: Grain protein content of the experiment showed highly significant (P < 0.01) difference in the main effect of blended fertilizer rates and varieties. But the interaction between the two factors was non-significant (Table 3). Wane variety gave the highest grain protein content of 11.5% whereas variety Kingbird gave significantly lower grain protein content of 10.8%. The highest grain protein content (12.1%) was observed at recommended rate of NP. The lowest was at control (9.22%). Above 200 Kg ha-1 NPSB fertilizer treatments was statistically not significantly different from the recommended NP (Table 3). Gooding [36] reported the protein content in wheat grains ranged from 9.23% to 15.11%. There was a shortage of water in a cropping season after anthesis (Figure 1). Labuschagne & Bencze [37, 38], demonstrated that both N fertilization and post-anthesis water stress slightly increased grain protein concentration. Adequate nitrogen supply improves protein content of vegetative organs as well as storage tissues and manufactures protein from carbohydrates Tisdale [39]. Sadowska [40] findings that the grain quality and physical properties of the different wheat varieties examined were strongly influenced by the cultivars. The protein content in flour increases significantly with bread wheat as the result of the heat stress Bekalu & Labuschagne [41, 42]. SH Park [43] stated that both quantity and quality of proteins affected bread making properties such as mixing time, tolerance, dough handling properties, water absorption, oxidation requirements, loaf volume, and crumb grain.
| Grain Protein content (%) | Hectoliter Weight (kg hl-1) | |
|---|---|---|
| Wane | 11.46a | 73.03a |
| Kingbird | 10.75b | 70.97b |
| LSD (%) | 0.20 | 0.67 |
| Fertilizer rates (kg ha-1) | ||
| 0 kg F ha-1 | 9.22c | |
| 150 kg TSP + 158.7 kg Urea ha-1 | 12.08a | 71.22bc |
| 100 kg NPSB + 100 kg Urea ha-1 | 11.58b | 72.93ab |
| 150 kg NPSB + 100 kg Urea ha-1 | 11.82ab | 72.43ab |
| 200 kg NPSB + 100 kg Urea ha-1 | 11.98ab | 72.18abc |
| 250 kg NPSB + 100 kg Urea ha-1 | 11.85ab | 72.52a |
| 300 kg NPSB + 100 kg Urea ha-1 | 12.00ab | 71.78abc |
| LSD (5%) | 0.42 | |
| P Value | <.0001 | |
| CV (%) | 3.17 | 1.34 |
Table 3: ** Main effect of variety and blended fertilizer rates on grain protein content.
TSP, Triple Super Phosphate; NPSB, Nitrogen Phosphorus Sulfur and Boron; LSD, Least Significant Difference; CV, Critical Value. Means followed by the same letter(s) within a column are not significantly different from each other at 5% level of significance, ns: Not significant. Table 3: Main effect of variety and blended fertilizer rates on grain protein content.
Hectoliter weight: Hectoliter weight content of the experiment showed highly significant (P < 0.01) difference in the main effect of blended fertilizer rates and varieties. But the interaction between the two factors was non-significant (Table 4). Wane variety gave the highest hectoliter weight content of 73.03 kg hl-1 whereas variety Kingbird gave significantly lower hectoliter weight content of 70.97 kg hl-1. The highest hectoliter weight content (72.93 kg hl-1) was observed at recommended rate of NP. The lowest was at control (71.22 kg hl-1). Above 200 Kg ha-1 NPSB fertilizer treatments was statistically not significantly different from the recommended NP (Table 4). This could be related to difference in variety with respect to applied fertilizer. Atwell [44] reported that, HLW may range from about 57.9 kg hL–1 for poor wheat to 82.4 kg hL–1 for sound wheat. The result of the study affirmed that the value of HLW for both varieties from the highest value of Wane (74.5 kg hl-1) to the lowest value of Kingbird (70.0 kg hl-1) of the tested bread wheat varieties was as a medium range. Significantly higher HLW with the application of blended NPSB rate might be due to the role of balanced nutrients on quality of wheat such as flour yield [45, 46]. The amount of powder of wheat was important for millers just as grain yield is important to wheat producer. Gooding [36] reported slight increase in HLW in response to N application under more favorable growing conditions. Tahir [47] report showed that HLW of the varieties significantly influenced by genotype.
| Varieties | Hectoliter Weight (kg hl-1) |
|---|---|
| Wane | 73.03a |
| Kingbird | 70.97b |
| LSD (%) | 0.67 |
| Fertilizer rates (kg ha-1) | |
| 0 kg F ha-1 | 71.22bc |
| 150 kg TSP + 158.7 kg Urea h-1 | 72.93ab |
| 100 kg NPSB + 100 kg Urea ha-1 | 72.43ab |
| 150 kg NPSB + 100 kg Urea ha-1 | 72.18abc |
| 200 kg NPSB + 100 kg Urea ha-1 | 72.52a |
| 250 kg NPSB + 100 kg Urea ha-1 | 71.78abc |
| 300 kg NPSB + 100 kg Urea ha-1 | 71.82abc |
| LSD (5%) | 1.34 |
| P Value | <.0001 |
| CV (%) | 1.59 |
Table 4: ** Interaction effect of blended fertilizer rates on hectoliter weight of bread wheat varieties.
TSP, Triple Super Phosphate; NPSB, Nitrogen Phosphorus Sulfur and Boron; LSD, Least Significant Difference; CV, Critical Value; Means followed by the same letter(s) within a column are not significantly different from each other at 5% level of significance, ns: Not significant. Table 4: Interaction effect of blended fertilizer rates on hectoliter weight of bread wheat varieties.
Partial Budget Analysis
Partial budget analysis is important to identify experimental treatments with an optimum return to the farmer’s investment and to develop recommendation for the agronomic data. Experimental yields are often higher than the yields that farmers could expect using the same treatments; hence in economic calculations, yields of farmers are adjusted by
10% less than that of the research results AACC [32]. As indicated in Table 10, the partial budget analysis showed that highest net benefit of (50536) Birr ha-1 was obtained for variety Wane that received 300 kg NPSB ha-1. However, the lowest net benefits of (26496) Birr ha-1 were obtained from the unfertilized treatment with the variety Kingbird. In this study, Wane varieties gave economic benefit of (48540 birr ha-1) with marginal rate of return (992.8 %) at 200 kg NPSB ha-1 fertilizer rate with supplementary urea but economic benefit of (50536 birr ha-1 ) birr was obtained for the variety Wane at 300 kg NPSB ha-1 with about a (1996 birr ha-1) net benefit increment (Table 5). whereas, in case of Kingbird variety at 200 kg NPSB ha-1 fertilizer rate gave the maximum economic benefit (46551 ha-1) with marginal rate of return (546.3 %). According to AACC [32] suggestion, the minimum acceptable marginal rate of return should be more than 100 %. Therefore, Wane variety at 300 kg NPSB ha-1 and for Kingbird variety at 200 kg NPSB ha-1 were economical and recommended for production of bread wheat in the study area and other areas with similar agro ecological condition.
| Treatment | GY | SY | Income (ETB ha-1) | GFB | TVC | NB | MRR | ||
|---|---|---|---|---|---|---|---|---|---|
| Var | Fer | (kg ha-1) | (kg ha-1) | Yield | Straw | (ETB ha-1) | (ETB ha-1) | (ETB ha-1) | % |
| W | 0 | 2165 | 3137 | 28140 | 627 | 28768 | 0 | 28768 | - |
| W | 100 | 3425 | 5324 | 44524 | 1065 | 45589 | 3390 | 42409 | 538.3 |
| W | 150 | 3489 | 6416 | 45351 | 1283 | 46634 | 3600 | 42804 | 188.1 |
| W | NP | 3561 | 6020 | 46299 | 1204 | 47503 | 4266 | 43437 | 95.1 |
| W | 200 | 3966 | 7315 | 51557 | 1463 | 53020 | 4780 | 48540 | 992.8 |
| W | 250 | 4107 | 8285 | 53369 | 1657 | 55046 | 5130 | 49916 | 393.1 |
| W | 300 | 4236 | 9816 | 55072 | 1963 | 57036 | 6500 | 50536 | 45.3 |
| KB | 0 | 1991 | 3062 | 25884 | 612 | 26496 | 0 | 26496 | - |
| KB | 100 | 3252 | 4856 | 42279 | 971 | 43250 | 3390 | 40070 | 341.4 |
| KB | 150 | 3375 | 5317 | 43871 | 1063 | 44939 | 3600 | 41109 | 494.8 |
| KB | NP | 3647 | 6520 | 47405 | 1304 | 47709 | 4266 | 43743 | 395.5 |
| KB | 200 | 3737 | 7761 | 48579 | 1552 | 50131 | 4780 | 46551 | 546.3 |
| KB | 250 | 3499 | 7827 | 45481 | 1565 | 47046 | 5130 | 41916 | D |
| KB | 300 | 3682 | 8327 | 47861 | 1665 | 49527 | 6500 | 43027 | 81.1 |
Table 5: Summary of economic analysis of the effects of blended fertilizer (NPSB) rates on bread wheat varieties.
Where, W, Wane; KB, Kingbird; Var, variety; Fer, fertilizer; GY, grain yield; SY, straw yield; GFB, gross field benefit; TVC, total variable costs; NB, net benefit; MRR, marginal rate of return; ETB ha-1, Ethiopian Birr per hectare; D, dominated treatments. Table 5: Summary of economic analysis of the effects of blended fertilizer (NPSB) rates on bread wheat varieties.
Conclusion
Bread wheat qualities are depends on the total grain protein content. The amount of hectoliter weight of wheat is higher, the flour of yield also higher. The highest protein content and hectoliter weight of bread wheat were recorded from wane variety (11.46%, 73.03kg hl-1) and due to fertilizer treatments, recommended NP (12.08% , 72.93 kg hl-1 ) and 200 kg ha-1NPSB with supplementary urea (11.98%, 72.52 kg hl-1) respectively, were the best records from other treatment; along the maximum marginal rates of return of 992.8% even though a net benefit of 50,536 Birr ha-1 was obtained from the same variety at 300 kg NPSB ha-1 + 100 kg Urea ha-1 fertilizer application about a 1996 net benefit increment. Therefore, application of NPSB at the rate of 200 kg NPSB ha-1+100 kg Urea ha-1 in the production of Wane and Kingbird varieties was economically beneficial and has more quality recommended for around Kulumsa area and similar growing areas. Since the study was conducted in one location for one season, it should be repeated in more location and season for further recommendation in similar agro ecologies.
Acknowledgment
The authors are grateful to Mrs. Gadisa Alemu, Tafesse Solomon, Mengistu Chemeda and Anbese Debebe for their assistance in trials management and data collection, and also thank Kulumsa quality laboratory staff members. The research was funded by Ethiopian Institute of Agricultural Research.
References
-
Mutwali NIA, Mustafa AI, Gorafi YS, Mohamed Ahmed IA (2016) Effect of environment and genotypes on the physicochemical quality of the grains of newly developed wheat inbred lines. Food Sci Nutr 4(4): 508-520.
-
Shiferaw B, Smale M, Braun HJ, Duveiller E, Reynolds M, et al. (2013) Crops that feed the world 10. Past successes and future challenges to the role played by wheat in global food security. Food Secur 5: 291-317.
-
Mehraban A (2013) The Effect of Different levels of Manure and Micro-nutrients on Yield and Some Physiological Properties of Spring Wheat. Technical Journal of Engineering and Applied Sciences 3(22): 3102-3106.
-
Abeyo B, Braun H, Singh R, Ammar K, Payne T, et al. (2012) The performance of CIMMYT wheat germplasm in East Africa with special emphasis on Ethiopia. In: Quilligan E, et al. (Eds.), Book Abstracts of Wheat for Food security in Africa, conference AA, Ethiopia, pp: 22.
-
CSA (2018) Report on Area and Production of Major Crops (Private Peasant Holdings, Meher Season): Agricultural Sample Survey. Statistical bulletin 586, CSA, April 2018, Addis Ababa, Ethiopia, Vol 1.
-
Amanuel G, Kuhne RF, Tanner DG, Vlek PLG (2002) Recovery of 15- N labeled urea applied to wheat in the Ethiopian Highlands as affected by P fertilization. J Agron Crop Sci 189(1): 30-38.
-
Stewart WM, Dibb DW, Johnston AE, Smyth TJ (2005) The contribution of commercial fertilizer nutrients to food production. Agron J 97(1): 1-6.
-
Hoveland CS (1980) Crop Quality, Storage and Utilization. American Society of Agronomy and Crop Science Society of America, Madison, Wisconsin, USA.
-
Bai Z, Dent D, Olsson L, Schaepman M (2008) Proxy global assessment of land degradation. Soil use and management 24(3): 223-234.
-
Mosisa W, Wonde A, Berhanu T, Legesse W, Alpha D, et al. (2007) Performance of CIMMTY maize germplasm under low nitrogen soil conditions in the mid altitude subhumid agro ecology of Ethiopia. Afri J Sci Confer Proceed 18: 15-18.
-
Nyamangara J, Gotosa J, Mpofu SE (2001) Cattle manure effects on structural stability and water retention capacity of granitic sandy soil in Zimbabwe. Soil and Tillage Research 64(3-4): 157-162.
-
Tolera A, Feyisa D, Friesen DK (2009) Effects of Crop Rotation and N-P Fertilizer Rate on Grain Yield and Related Characteristics of Maize and Soil Fertility at Bako, Western Oromia, Ethiopia. East Afr J Sci 3(1): 70- 79.
-
Zerihun A, Sharma JJ, Nigussie D, Fred K (2013) The effect of integrated organic and inorganic fertilizer rates on performances of soybean and maize component crops of a soybean/maize mixture at Bako, Western Ethiopia. Afr J Agric Res 8: 3921-3929.
-
Kombiok JM, Buah SSJ, Segbedji JM (2008) Enhancing Soil Fertility for Cereal Crop Production through Biological Practices and the Integration of Organic and In-Organic Fertilizers in Northern Savanna Zone of Ghana. Soil Fertile.
-
Singh LB, Yadav R, Abraham T (2015) Studies on the effect of Zinc levels, and methods of boron application on growth, yield and protein content of Wheat (Triticum aestivum L.). Bulletin of Environment, Pharmacology and Life Sciences 4(2): 108-113.
-
Selassie YG (2015) The effect of N fertilizer rates on agronomic parameters, yield components and yields of maize grown on Alfisols of North-western Ethiopia. Environmental system research.
-
Ivanova A, Tsenov N (2010) Effect of some agronomy practices on main traits of grain yield in winter wheat varieties of different quality. Bulgarian Journal of Agricultural Science 16(5): 559-564.
-
Wieser H (2007) Chemistry of gluten proteins. Food Microbiol 24(2): 115-119.
-
Kharel Tulsi P, Clay David E, Clay Sharon A, Beck Dwayne, Reese C, et al. (2011) Nitrogen and Water Stress Affect Winter Wheat Yield and Dough Quality. Agronomy Journal 103(5): 1389-1396.
-
Triboi E, Triboi Blondel AM (2002) Productivity and grain or seed composition: a new approach to an old problem. Eur J Agron 16(3): 163-186.
-
Mohammed YA, Kelly J, Chim BK, Rutto E, Waldschmidt K, et al. (2013) Nitrogen Fertilizer Management for Improved Grain Quality and Yield in Winter Wheat in Oklahoma. Journal of Plant Nutrition 36(5): 749-761.
-
Ethiopian Soil Information System (EthioSIS) (2013) Towards improved fertilizer recommendations in Ethiopia-Nutrient indices for categorization of fertilizer blends from EthioSIS woreda soil inventory data. Adiss ababa, Ethiopia.
-
Hoseney RC, Rogers DE (1990) The formation and properties of wheat flour dough. Crit Rev Food Sci Nutr 29(2): 73-93.
-
Wooding AR, Kavale S, MacRitchie F, Stoddard FL (1999) Link between mixing requirements and dough strength. Cereal Chem 76(5): 800-806.
-
Khatkar BS, Fido RJ, Tatham AS, Schofield JD (2002a) Functional properties of wheat gliadins. I. Effects on mixing characteristics and bread making quality. J Cereal Sci 35(3): 299-306.
-
Tronsmo KM, Færgestad EM, Longva Å, Schofield JD, Magnus EM (2002) A study of how size distribution of gluten proteins, surface properties of gluten and dough mixing properties related to baking properties of wheat flours. J Cereal Sci 35(2): 201-214.
-
Cuniberti MB, Roth MR, MacRitchie F (2003) Protein composition-functionality relationships for a set of Argentinean wheats. Cereal Chem 80(2): 132-134.
-
Hamid A (1972) Efficiency of N uptake by wheat, as affected by time and rate of application, using N15- labelled ammonium sulphate and sodium nitrate. Plant Soil 37: 389-394.
-
Ercoli L, Masoni A, Pampana S, Mariotti M, Arduini I (2013) As durum wheat productivity is affected by nitrogen fertilisation management in Central Italy. Eur J Agron 44: 38-45.
-
Szentpetery Z, Jolankai M, Kleinheincs C, Szollosi G (2005) Effect of nitrogen top-dressing on winter wheat. Cereal Res Commun 33(2,3): 619-626.
-
Tadesse T, Haque I, Aduayi EA (1991) Soil, plant, fertilizer, animal manure and compost analysis manual. International Livestock Centre for Africa No. B13. Addis Ababa, Ethiopia.
-
AACC (American Association of Cereal Chemists) (2000) Approved Methods of the American Association of Cereal Chemists. AACC, St. Paul, MN.
-
CIMMYT (1988) From Agronomic Data to Farmer Recommendations: An Economics Training Manual. Completely revised edition. Mexico. Communication Soil Science and Plant Analysis, Communication Soil Science and Plant Analysis 32: 1405-1429.
-
GenStat (2014) GenStat Procedure Library Release. 17th (Edn.), VSN International Ltd. Gomez and Gomez H, Statistical analysis for agricultural research. John Willy and Sons Inc., pp: 120-155.
-
Fayera A (2014) Effects of different Rates of NPK and Blended Fertilizers on Nutrient Uptake and Use Efficiency of Teff [Eragrostis Tef (Zuccagni) Trotter] in Dedessa District, Southwestern Ethiopia. J Biol Agric Healthcare 4: 254-258.
-
Gooding MJ, Ellist RH, Shewry PR, Schofield JD (2003) Effects of restricted water availability and increased temperature on the grain filling, drying and quality of winter wheat. J Cereal Sci 37(3): 295-309.
-
Labuschagne MT, Meintjes G, Groenewald FPC (2006) The influence of different nitrogen treatments on the size distribution of protein fractions in hard and soft wheat. J Cereal Sci 43(3): 315-321.
-
Bencze S, Veisz O, Bedő Z (2004) Effects of high atmospheric CO2 and heat stress on phytomass, yield and grain quality of winter wheat. Cereal Research Communications 32: 75-82.
-
Tisdale SL, Nelson WL, Beaton JD, Havlin JL (1995) Soil fertility and fertilizers, 5th (Edn.), New Delhi: Prentice Hall of India, pp: 684.
-
Sadowska J, Baszczak W, Jelinski T, Fornal J, Borkowska H, et al. (2001) Fertilization and technological quality of wheat grain. Int AgroPhysics 15: 279-285.
-
Abebe B, Manchore M (2016) Effect of the rate of N fertilizer application on growth and yield of wheat (Triticum aestivum L.) at Chencha, Southern Ethiopia. International Journal of Plant, Animal and Environmental Sciences.
-
Labuschagne MT, Elago O, Koen E (2009) The influence of temperature extremes on some quality and starch characteristics in bread, biscuit and durum wheat. Journal of Cereal Science 49(2): 184-189.
-
Park SH, Bean SR, Chung K, Seib PA (2006) Levels of Protein and Protein Composition in Hard Winter Wheat Flours and the Relationship to Breadmaking1. AACC International, Inc. 83(4): 418-423.
-
Atwell WA (2001) Wheat Flour. Eagan Press Handbook Series, St. Paul, Minnesota, USA.
-
Austin RB (1999) Yield of winter wheat in the United Kingdom: recent advances and prospects. Crop Science 39(6): 1604-1610.
-
Foth HD, Ellis BG (1988) Soil Fertility. 7th (Edn.), John Wiley and Sons, Inc. New York, USA.
-
Tahir M, Tanveer A, Shah TH, Fiaz N, Wasaya A (2009) Yield response of wheat (Triticum aestivum L.) to boron application at different growth stages. Pak J Life Soc Sci 7(1): 39-42.
- Enhancement of Vegetative Growth and Fruit Yield in Cucumber (Cucumis sativus L.) via Spiritual Blessing (Biofield) Energy Intervention
- Production of Açaí (Euterpe oleracea Mart.) under Different Agroforestry System Management Intensities in Amazonian Floodplain (Varzea) Forests
- Coffee and the Production Region: What is the Secret to the Expression "Quality"?
- Experiential Agripreneurship Training in Sub-Saharan Africa: Integrating a Business Incubator into Postgraduate Livestock Education at the University of Buea
- Advances in Agricultural High-Quality Development
- Linking Compost Residue to ABAGE in Plants - a Short Note