The Main Natural Sources of Global Climate Variability Occurring Even Before the Industrial Era
Natural global climate variability and fluctuations are characteristic of the global climate and occur on both long- and shorttime scales as common phenomena. Therefore, natural influences on the global climate variability even before the industrial era may include changes in solar energy, naturally occurring water vapor and CO2 in the atmosphere, volcanic aerosol and GHG emissions, and cyclical oscillations in the oceans. However, natural variability and weather extremes, in particular local warming, influences people’s belief in climate change and their willingness to support potentially costly climate mitigation measures. Among natural sources of global climate variability, Volcanism has been a major driver of past climate variability by reflecting the incoming sunlight away from the Earth’s surface. According to different research finding, man-made climate variability in addition to natural global climate variability increase climate change from global to local level to be happen in below thirty years.
Introduction
Global climate variability is the term to describe variations in the mean state and other characteristics of climate on all spatial and temporal scales beyond that of individual weather events [1]. Some of the variability does not appear to be caused systematically and occurs at random times. Such variability is called random variability or noise. On the other hand, periodic variability occurs relatively regularly and in distinct modes of variability or climate patterns [2]. Climate variability includes all the variations in the climate that last longer than individual weather events, whereas the term climate change only refers to those variations that persist for a longer period, typically decades or more. In the time since the industrial revolution, the climate has increasingly been affected by human activities that are causing global warming and climate change.
Natural influences on the climate variability even before the industrial era may include changes in solar energy, naturally occurring water vapor and CO2 in the atmosphere, volcanic aerosol and GHG emissions, and cyclical oscillations in the oceans. These factors impact climate by affecting the amount of solar radiation reaching the earth’s surface, modulating how much heat is retained within the atmosphere, or changing oceanic and atmospheric temperature circulation. Over scales of centuries to tens of thousands of years, the Earth’s rotational wobble and orbit around the sun also affect the pattern of incoming solar radiation and affect climate on geologic time scales [3]. The Earth’s climate exhibits natural variability at all times, although the magnitudes differ widely over the range of time scales. Many of the peaks in magnitude can be attributed to identifiable forcing processes. The broader peaks relate to variability enhancements that include the effects of interactions within the climate system (internal forcing mechanisms). The natural variabilities in the range of seasonal to millennial (three months to thousands of years) are to be considered the most relevant; even if the diurnal temperature variability is an important factor in climate change.
Thus, climate variability is an observed inconsistency in the climate record in periods when the state of the climate system with no significant changes in the mean value. Thus, natural variability is a characteristic of the global climate and occurs on both long- and short time scales. Natural climate variability and fluctuations are characteristic of the global climate and occur on both long- and short-time scales as common phenomena. Generally, climate variability could be characterized as unpredictable long- or short-term natural inconsistency of the climate without change in the mean values of climatic variables. Natural variability and weather extremes, in particular local warming, influences people’s belief in climate change and their willingness to support potentially costly climate mitigation measures [4, 5, 6]. However, climate variability and extreme events involve a fundamentally chaotic component [7, 8].
As global temperatures continue to rise, a confluence of natural variability and the forced response of the climate system to greenhouse gases will increase the frequency of unprecedented events, such as the 2010 heatwave in Eastern Europe [9]. Although the forcing-driven component of increased extreme event frequency is to some extent predictable, the natural variability-driven component and thus the timing and location of these events are largely stochastic. Large ensemble climate modeling experiments have demonstrated the important role natural variability plays in the range of regional climate change predicted for the coming decades. Indeed, in many regions, the multi- decadal component of natural variability may be as large as the forced response to rising greenhouse gas concentrations over the next several decades [7, 8]. Natural variability influences local meteorological conditions on timescales from days to decades [10]. Thus, natural variability may mask the forced response in some countries while exacerbating the forced response in others, with differential consequences for public support for climate policy in each country. Because support for climate policies is likely to be affected by the local experiences of citizens, natural variability can be expected to significantly influence the timescale for action to mitigate climate change. With these in mind, the main aim of this review was to report works done with a wide-ranging overview of the main natural sources of global climate variability occurring even before the industrial era.
Methodology
This review paper was taken from different literature, books, websites, and scientific journals which are related to the global climate variabilities.
The Main Natural Sources of Global Climate Variability
The natural variability and the climate fluctuations of the climate system have always been part of the Earth’s history even before the industrial era. To understand climate change fully, the causes of climate change must be first identified. The earth’s climate is influenced and changed through the main natural causes like volcanic eruptions, ocean currents, the Earth’s orbital changes, solar variations, and internal variability.
Volcanic Eruptions on Global Climate Variability
The climatic impact of volcanic eruptions has long been a topic of intense interest and inquiry and considerable research effort. Early work on volcanism focused on documenting active volcanoes and past volcanic activities. Scientific efforts to explore the connection between volcanoes and climate began in the nineteenth century and were greatly aided by a systematic documentation of volcanic eruptions that began in the mid-twentieth century. Since then, the development and improvement of our knowledge of the volcano– climate connection have been no less spectacular than the eruptions themselves [11]. In particular, the advance in a volcano–climate research over the last two decades has essentially elucidated the primary physical processes linking climatic response to volcanic emissions and contributed to the effort to quantify natural climate variability and the role of volcanism in recent climate variations. This gives us the capability and confidence to predict the probable climatic response to a given level of volcanic activities. This remarkable advance is, in part, due to the heightened interest in climate change brought about by the concern of human-induced greenhouse warming and also aided by the advent of tools that greatly increased our capabilities to study all aspects of the volcano–climate system. Those tools include satellite and other modern observational platforms, a global volcano monitoring system, paleo volcanic data from a variety of proxy measurements (developed as part of paleoclimatic data), and sophisticated climate models able to simulate accurately the physical processes relating atmospheric properties to climate conditions. For a thorough understanding of the volcano– climate topic and past research achievement, the reader is referred to an excellent comprehensive and well-illustrated review by Robock A [12].
Volcanic emissions: Volcanic eruptions are a strong and visible manifestation of the internal dynamics of the solid Earth. A strong character is an emission into the atmosphere of large quantities of solid particles (ash) and gaseous substances in a short period. Ash clouds can block sunlight and darken the skies visibly, resulting in reduced solar heating (Figure 1). However, such effects are typically short- lived and geographically limited, as the ash settles by gravity out of the atmosphere quickly and locally [12]. The gaseous emissions consist primarily of water vapor, carbon dioxide, reduced sulfur compounds (mainly SO2), nitrogen [13] and halogen compounds [14]. They become constituents of the atmosphere and their atmospheric residence times are subject to the biogeochemical cycles of the elements (O, C, and S). The amounts of water vapor and carbon dioxide emitted by volcanoes are negligibly small, compared with the atmospheric reservoir size of these gases, and therefore their climate impact is insignificant [14]. Aerosols and climate: In the oxidizing atmosphere, SO2 from volcanic and other sources is converted to chemically stable sulfuric acid (H2SO4) or sulfate. The conversion is quite rapid. In the troposphere, SO2 is converted to H2SO4 in a matter of a few days, while the conversion in the stratosphere may take up to several weeks and months. Sulfuric acid is highly hygroscopic and consequently exists as H2SO4·H2O or sulfuric acid aerosols (Figure 1). These sulfuric acids or sulfate aerosols scatter efficiently the visible part of the solar spectrum; their presence increases the optical depth of the atmosphere and therefore the atmospheric albedo [14]. In addition, they also interact with both incoming and outgoing infrared radiation. Because the net effect of aerosols is the reduction of energy receipt near the surface. The most significant climatic impact of aerosols is the cooling at the surface and in the lower troposphere [15]. Volcanic impact on climate: Volcanism has been a major driver of past climate variability [16] and will continue to affect future climate alongside human influences. Explosive volcanic eruptions warm the stratosphere [17] and cool the troposphere causing changes in the hydrological cycle [18]. Available climatic and volcanic records indicate that significant climate variations before 1850 AD were primarily caused by fluctuations in solar irradiance and the frequency of large, stratospheric volcanic eruptions [19, 20]. Although a volcanic eruption can cause significant cooling only for a few years immediately following the eruption, sustained active volcanism over an extended period could cause a longer-term impact. In our cent modeling exercise, show that feedback mechanisms can propagate and extend the impact of a single eruption to over a decade for regions such as the Arctic [21].
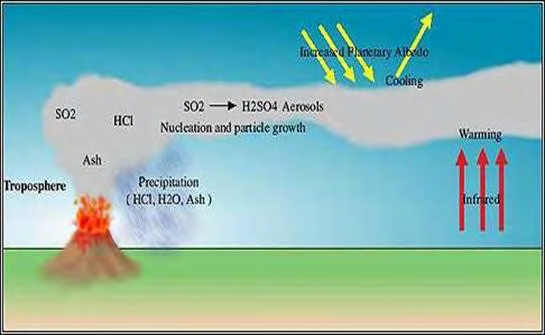
The main effect volcanoes have on the climate is short- term cooling. Volcanic eruptions pump out clouds of dust and ash, which block out some sunlight. Because the ash particles are relatively heavy, they fall to the ground within about three months, so their cooling effect is very short- lived. But volcanic debris also includes sulfur dioxide. This gas combines with water vapor and dust in the atmosphere to form sulfate aerosols, which reflect sunlight away from the Earth’s surface. These aerosols are lighter than ash particles and can remain in the atmosphere for a year or more. Their cooling effect outweighs the warming caused by volcanic greenhouse gases – the eruption of Mount Pinatubo in 1991 caused a 0.5 °C drop in global temperature. Volcanic eruptions spew out lava, carbon dioxide (CO2) ash, and particles. Although CO2 has a warming effect, average volcanic CO2 emissions are less than 1% of emissions from current human activities. Large volumes of gases and ash can influence climatic patterns for years by increasing planetary reflectivity causing atmospheric cooling.
During volcanism, materials from the earth’s core and mantle are brought to the surface because of the heat and pressure generated within. Volcanic eruptions and geysers release particles into the earth’s atmosphere which affects the climate. The most dangerous of these gases is the carbon dioxide gas which reacts with water vapor commonly found in the stratosphere to form a dense optically bright haze layer that reduces the atmosphere transmission of some of the sun’s incoming reception. Climatologists for a long time have noticed that there is a link between very explosive volcanic eruptions and short-term climate change. For instance, a year after the Tambora volcanic eruption in 1815, there came very cold years. As such, there has been very cold weather in regions across the planet.
Response and Role of the Ocean and Sea ice on Global Climate Variability
The biggest potential source of decadal climate variability in the ocean. Even an inert ocean would cause decadal climate variability by integrating weather noise, and ocean dynamics are expected to enhance this variability. For example, in the GFDL model, a warming episode like the early 20th-century warming occurred in a historical simulation due to ocean overturning variability [22]. Another example is based on the Max-Planck Institute Ocean model forced by century-long reanalysis ERA20C Shindell DT, et al. [23] with an experimental setup. Surface temperatures in the North Atlantic are closely associated with a downward ocean surface heat flux (latent plus sensible heat flux) on an inter-annual timescale and upward into the atmosphere heat flux on decadal to multi-decadal timescales. The ocean regulates and modulates climate variability, climate change, and transient climate sensitivity. It does so through its massive storage capacity of heat, freshwater, and carbon, and the transport of these properties by the ocean currents. Consequently, the ocean contributes to climate variability through its circulation pathways and strength, internal/ intrinsic variability, and interactions with the atmosphere, cryosphere, and land, all of which span a wide range of space and time scales. These processes lead the ocean to respond to natural and anthropogenic forcing’s that in turn feedback upon the atmosphere, cryosphere, land, and biosphere [24] (Figure 2).
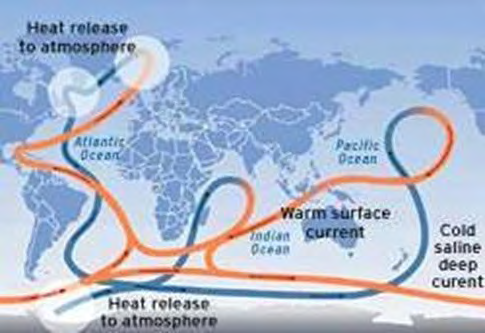
The oceans are a major component of the climate system. Ocean currents are located at the ocean surface and in deep water below 300 meters (984 feet). They can move water horizontally and vertically and occur on both local and global scales (Figure 2). The ocean has an interconnected current, or circulation, system powered by wind, tides, the Earth’s rotation (Coriolis effect), the sun (solar energy), and water density differences. The topography and shape of ocean basins and nearby landmasses also influence ocean currents. Deep ocean currents are density-driven and differ from surface currents in scale, speed, and energy. Water density is affected by the temperature, salinity (saltiness), and depth of the water. The colder and saltier the ocean water, the denser it is. The greater the density differences between different layers in the water column, the greater the mixing and circulation. Density differences in ocean water contribute to a global-scale circulation system, also called the global conveyor belt includes both surface and deep ocean currents that circulate the globe in a 1,000-year cycle. This circulation is the result of two simultaneous processes: warm surface currents carrying less dense water away from the Equator toward the poles, and cold deep ocean currents carrying denser water away from the poles toward the Equator (Figure 2). The ocean’s global circulation system plays a key role in distributing heat energy, regulating weather and climate, and cycling vital nutrients and gases. Sea ice responds to the ocean and atmospheric temperatures, with decreases in sea ice not only observed recently but also during the early 20th-century
high latitude warming [25]. For example, large changes in the sea ice conditions around Spitsbergen were reported in the 1920s and attributed to additional warm water being pushed north by the Gulf. For the recent period since 1953, signals of greenhouse gas, aerosol, and natural forcing-induced changes have been detected in the observations [26]. Notz D, et al. [27] have suggested that summer Arctic Sea ice is melting proportionally to cumulative carbon emissions, although other studies have proposed a role for internal variability in the recent decline [28]. Knowledge of pre1950s Arctic conditions could be substantially improved through the digitization of many decades’ worth of voyager records along with thousands of logbooks [29].
Earth’s Orbital Changes on Global Climate Variability
Global climate variability because of Earth’s axial tilt , the inclination of the Sun’s trajectory in the sky varies over the year. For an observer at a northern latitude, when the north pole is tilted toward the Sun the day lasts longer and the Sun appears higher in the sky. This results in warmer average temperatures, as additional solar radiation reaches the surface. When the north pole is tilted away from the Sun, the reverse is true and the weather is generally cooler. North of the Arctic Circle and south of the Antarctic Circle, an extreme case is reached in which there is no daylight at all for part of the year, and continuous daylight during the opposite time of year. This is called polar night and midnight sun, respectively. This variation in the weather results in the seasons (Figure 3).
In modern times, Earth’s perihelion occurs around January 3, and the aphelion around July 4. The changing Earth-Sun distance results in an increase of about 6.9% [30] in total solar energy reaching the Earth at perihelion relative to aphelion. Since the southern hemisphere is tilted toward the Sun at about the same time that the Earth reaches the closest approach to the Sun, the southern hemisphere receives slightly more energy from the Sun than does the northern over a year. However, this effect is much less significant than the total energy changes due to the axial tilt, and most of the excess energy is absorbed by the higher proportion of surface covered by water in the southern hemisphere [30].
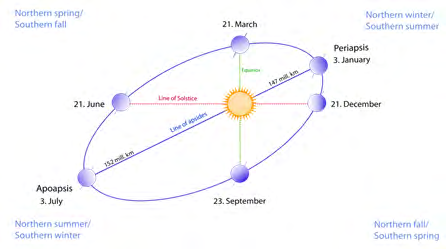
Because of the axial tilt of the Earth in its orbit, the maximal intensity of Sun rays hits the Earth 23.4 degrees north of the equator at the June Solstice (at the Tropic of Cancer), and 23.4 degrees south of the equator at the December Solstice (at the Tropic of Capricorn) (Figure 3).
Influence of Solar Variability on Global Climate
The sun is a very special star. Not only is it a boon to astronomers in that it allows us to start resolving spatial scales at which universal physical processes take place that action the astronomical objects but it is the only star that directly influences Earth and, thus, our lives [31].
Under normal circumstances, the sun is the only serious external source of energy to Earth. Any variability of the sun’s radiative output thus has the potential of affecting our climate and, hence, the habitability of Earth. The important question is how strong this influence is and how it compares with other mechanisms including the influence of man-made greenhouse gases. Although this has been debated for a long time, the debate is being held with increasing urgency due to the unusual global temperature rise we have seen over the twentieth century and particularly during the past 3–4 decades. It is generally agreed that the recent warming is mainly driven by the release of greenhouse gases, foremost among them carbon dioxide, into Earth’s atmosphere by the burning of fossil fuels [32]. Empirical evidence on solar variability and climatic variability: An important feature of the surface temperature record of the last 100 years is that the temperature rose sharply by about 0.4°C between 1910 and 1940. Most of the increases in greenhouse gases, however, occurred after 1940 and, therefore, cannot be the cause of the 0.4°C warming that occurred earlier in the twentieth century. Most of the warming early in this century, then, must have been due to natural causes of climatic change, and these natural causes must be understood to make an accurate assessment of the effect upon the climate of any human activities that may have been added to the natural changes. One possible natural cause of climatic change is variation in the brightness of the sun. There are many variations in solar activity that have been observed through the sun and beryllium isotopes. The sun provides the earth with heat energy, an integral part of our climate. Numerical climate models predict that if there is a change in solar output of only 1% per century, the earth’s average temperature will be altered by between 0.5 to 1.0 Celsius. Solar radiation has caused a phenomenon known as global warming (Figure 4).
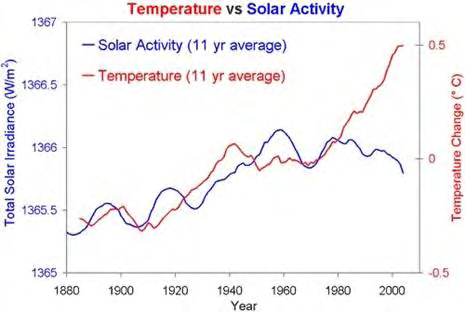
The Sun is the source of energy for the Earth’s climate system. Although the Sun’s energy output appears constant from an everyday point of view, small changes over an extended period can lead to climate changes. Some scientists suspect that a portion of the warming in the first half of the 20th century was due to an increase in the output of solar energy. As the sun is the fundamental source of energy that is instrumental in our climate system it would be reasonable to assume that changes in the sun’s energy output would cause the climate to change. Scientific studies demonstrate that solar variations have performed a role in past climate changes. For instance, a decrease in solar activity was thought to have triggered the Little Ice Age between approximately 1650 and 1850, when Greenland was largely cut off by ice from 1410 to the 1720s and glaciers advanced in the Alps. Current global warming however cannot be explained by solar variations. Since 1750, the average amount of energy coming from the Sun either remained constant or increased slightly. If global warming was caused by a more active sun, scientists would expect to see warmer temperatures in all layers of the atmosphere. They have only observed a cooling in the upper atmosphere, warming at the surface and in the lower parts of the atmosphere. This is due to greenhouse gasses capturing heat in the lower atmosphere (Figure 4). Also, climatemodels that include solar irradiance changes cannot reproduce last century’s observed temperature trend without including a rise in greenhouse gases [33].
El Nino, La Nina and Indian Ocean Dipole
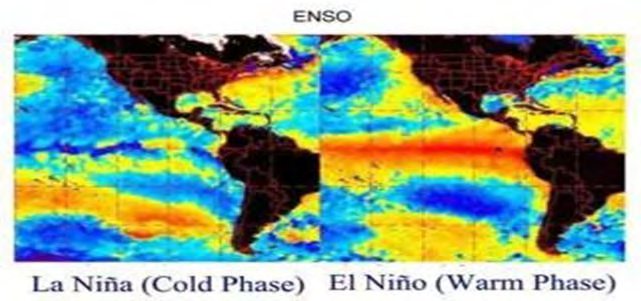
The El Niño Southern Oscillation is one of the most important drivers of year-to-year variability in global weather patterns. El Niño events, characterized by warmer than average sea-surface temperatures in the eastern Pacific and a weakening of the trade winds, are associated with higher global temperatures. Cooler global temperatures often accompany La Niña events, which are characterized by cooler than average sea-surface temperatures in the eastern Pacific and a strengthening of the trade winds (Figure 5).
ENSO is a quasi-periodic variation in sea surface temperature and other related variables, such as surface pressure and surface wind, lasting about three to five years and situated mainly over the tropical eastern Pacific Ocean. ENSO affects much of the tropics and subtropics but also influences the mid-latitudes of both hemispheres, including Canada. The warm phase of ENSO is known as El Niño (warm waters in the tropical eastern Pacific Ocean) and the cool phase as La Niña (cool waters in the tropical eastern Pacific Ocean). The warm phase tends to be associated with warmer winter air temperatures and drier conditions over much of Canada. The opposite is true during La Niña. Related to ENSO is the Indian Ocean Dipole (IOD), a variation in sea surface temperature centered in the Indian Ocean, with a typical timescale of about two years [33].
Arctic Oscillation (AO), and North Atlantic Oscillation
Which is associated with changing patterns of air pressure in the northern hemisphere. This phenomenon brings warmer weather to parts of Europe and North America, leaving the Arctic colder than usual. The other phase of the AO brings the opposite conditions, resulting in a warmer-than-usual Arctic and colder weather in the sub- polar regions. Because of this seesaw effect, the AO has little effect on global temperatures, but can significantly influence local and regional weather. Many natural factors affect the climate, including changes in the Sun’s output or the Earth’s orbit, large volcanic eruptions, and internal variability such as El Niño. Scientists measure these effects, but none can account for the observed trend since 1970. Scientists can only account for recent global warming by including the effects of human greenhouse gas emissions [33].
The oscillation between ice ages and warm interglacial periods over the past two million years on Earth is a testament to the effect on Earth’s climate of changes in the global average temperature on the order of 5°C [7]. In modern times, on century timescales, the globe has warmed by about 1°C since the beginning of the Industrial Era and additional warming is unavoidable in this century. The Paris Agreement under the United Nations Framework Convention on Climate Change3 has a stated goal of holding the increase in global average temperature to well below 2°C above pre-industrial levels and pursuing efforts to limit the temperature increase to 1.5°C. Given that historic warming has already moved us close to this goal, it is important to understand how and why the climate is changing. This review provides a summary of that understanding, based primarily on the evidence presented in multiple chapters of the Intergovernmental Panel on Climate Change (IPCC) Working Group 1 Fifth Assessment Report [1]. Pacific Decadal Oscillation and Interdecadal Pacific Oscillation The Pacific Decadal Oscillation (PDO) is a recurring pattern of sea surface temperature variability centered over the northern mid-latitude Pacific Ocean. The PDO has varied irregularly, with a characteristic timescale ranging from as short as a few years to as long as several decades. As with ENSO, the warm (positive) phase of the PDO tends to be associated with warmer winter air temperatures over much of Canada [34]. At times over the past century, this mode of variability has exerted a strong influence on continental surface air temperature and precipitation, from California to Alaska. The Interdecadal Pacific Oscillation (IPO) is related to the PDO, but with a much wider geographic range of influence [35].
Atlantic Multi-decadal Oscillation
The Atlantic Multi-Decadal Oscillation (AMO) is a recurring pattern of sea surface temperature of the North Atlantic Ocean (north of the equator and south of about 80° north latitude), with a characteristic timescale of 60 to 80 years. The AMO has been known to influence hurricane activity, as well as rainfall patterns and intensity, across the North Atlantic Ocean [33].
Astronomical Periodicity of the Natural Factor for Global Climate Variability
The Earth’s history has been studded with periods when the climate was markedly colder than in others. These cold times, the so-called Ice Ages, have, on the geological time scale, been relatively short-lasting covering only perhaps 5 to 10% of the Earth’s life. The most well-known are the Pre-
Cambrian Ice Ages, the late Ordovician Ice Age, the Permo- Carboniferous Ice Age, and our Present Ice Age. These past climates are reconstructed from analysis of proxy data taken from deep-sea cores, ice cores, and land records [36, 37]. Throughout the past million years, these data demonstrate that successive glaciation – deglaciation cycles have occurred with a dominant quasi-periodicity of 100 kyr (kyr: thousand years). The astronomical theory of paleoclimates aims to explain the recurrence of these cycles. The last one goes from the Eemian interglacial centered at roughly 125 kyr BP to the present-day Holocene interglacial which peaked around 6 kyr BP and includes the last glacial maximum (LGM) which occurred at 21 kyr BP. This LGM was documented in great detail by the Climate Long-Range Investigation Mapping and Prediction group CLIMAP Project Members, 1976, and 1981). In the Northern Hemisphere, the LGM world differed strikingly from the present in the huge land-based ice sheets, reaching approximately 2 to 3 km in thickness [38]. There was also a dramatic increase in the extent of pack-ice and marine-based ice sheets. In the Southern Hemisphere, the most striking contrast was the greater extent of sea ice. On land, grasslands, steppes, and deserts spread at the expense of forests. This change in vegetation, together with extensive areas of permanent ice and sandy outwash plains, caused an increase in global surface albedo over modern values. Sea level was lower by at least 115 m which represents roughly 50×106 km3 of ice more than now, and the global average surface air temperature was 5°C below present. Aerosol loading was higher than the present and CO2 levels were about 200 ppmv [38]. Recent data show however that the tropics were cooler than in the CLIMAP reconstruction [39, 40].
In the glacial world, climate shifts occurred also over periods as short as a few decades to millennia [41]. Sediments in the North Atlantic Ocean contain a series of layers named after their discoverer, Heinrich [50] and separated by 5 to 10 kyr. Rich in ice- rafted debris, they reflect repeated rapid advances and catastrophic collapses of ice sheets surrounding the North Atlantic, mainly the Laurentide one. Deep-ice cores drilled at the summit of the Greenland ice sheet reveal simultaneous irregular but well- defined large– amplitude changes in air temperature. These, now referred to as Dans guard-Oeschge events, last between 500 and 2000 years [42]. Both marine and terrestrial records from the Northern Hemisphere show similar changes. Rapid warming completed usually within a few decades is followed by gradual cooling over a few hundred years and by a cold phase lasting a few centuries to a millennium. Moreover, [43] observed that each of the six Heinrich events identified from 60 to 15 kyr BP occurs at the end of a long cooling phase and appears to be simultaneous with the coldest Greenland stadial events. The complex interplay between the Dansgaard- Oeschger and the Heinrich events is still under study [44, 45].
It is probably related to the freshwater flux coming from the ice melting, but the cause of the ice sheet collapse associated with Heinrich events remains still a matter of active debate.
During the deglaciation, between the LGM and the onset of the Holocene about 10 kyr BP, climate underwent another series of abrupt events of global impacts. Between 18 and 15 kyr BP, intense calving occurred in the Northern Hemisphere ice sheets resulting, in the North Atlantic, in massive iceberg discharges and melting. This event, called Heinrich 1, is concomitant with cold sea-surface temperatures from the northern North Atlantic to the eastern tropical Pacific and with warm western tropical and southern Atlantic. After this event, the Northern Hemisphere entered the B¨olling period at about 14.6 kyr BP which appears as intense and abrupt warming in most Northern Hemisphere records. Approximately at the same time, Antarctica entered the Antarctic Cold a 1000year plateau in the deglacial warming trend seen in oxygen isotope records and ending when the Younger Dryas (YD) began in the Northern Hemisphere. The B¨olling was also characterized by an important sea-level rise, the meltwater pulse MWP-1A [46], which lasted from 14.6 to 13.8 kyr BP and corresponds to a 15-m sea-level rise in 500 years. The warm B¨olling-Aller¨od interstadial complex was punctuated by short cold events, including the Older Dryas, and ended at the onset of the YD, 12.7 kyr ago. This cold period is seen in Greenland (where it was 15oC colder than today), in Europe, in North America, in the North Atlantic, and in southern American tropical areas. It ended at ∼ 11.5 kyr BP with an abrupt return to warm conditions also punctuated by a meltwater pulse, MWP-1B. One of the most cited mechanisms for explaining this chain of events is a possible disruption of the thermohaline circulation due to freshwater input originating from the northern ice sheets. Although it is an attractive idea to explain many features of the deglaciation, including the seesaw by Stocker TF [47], some fundamental questions remain to be solved Crucifix M, et al. [48] and a Southern Ocean origin is even suggested. This kind of millennium-scale climatic variability of the last glacial period and the deglaciation does not probably occur in direct response to thein solation forcing as originally hypothesized by Crucifix M, et al. [49] and Heinrich H [50]. However, several feedbacks are operating at many different time scales which, therefore, leave the problem open to knowing to which extent the astronomical theory is playing also a role at these time scales.
Summary and Conclusion
According to IPCC, global climate variability is the term to describe variations in the mean state and other characteristics of the climate. The Earth’s climate exhibits natural variability at all times, although the magnitudes differ widely over the range of time scales. Many of the peaks in magnitude can be attributed to identifiable forcing processes. The broader peaks relate to variability enhancements that include the effects of interactions within the climate system. The natural variabilities in the range of seasonal to millennial are to be considered the most relevant; even if the diurnal temperature variability is an important factor in climate variability.
The natural sources of climate variability and the climate fluctuations of the climate system have always been part of the Earth’s history even before the industrial era. To understand the natural climate variability fully, the causes of climate variability must be first identified. The earth’s climate is influenced and changed through the main natural global climate variability causes like volcanic eruptions, ocean currents, the Earth’s orbital changes, solar variations, and internal variability.
References
-
Intergovernmental Panel on Climate Change (2013) Climate Change 2013-The Physical Science Basis. Cambridge University Press, United Kingdom, pp: 1535.
-
Vega AJ, Rohli RV (2018) Relationships of Climate Variability and Change to Development.
-
Leggett JA (2018) Evolving Assessments of Human and Natural Contributions to Climate Change. Congressional Research Service, pp: 1-22.
-
Howe PD, Markowitz EM, Lee TM, Ko CY, Leiserowitz A (2012) Global Perceptions of local Temperature Change. Nature Climate Change 3: 352-356.
-
Deryugina T (2013) How do People Update? The Effects of Local Weather Fluctuations on Beliefs about Global Warming. Climatic Change 118: 397-416.
-
Egan PJ, Mullin M (2012) Turning Personal Experience into Political Attitudes: The Effect of Local Weather on Americans’ Perceptions about Global Warming. J Pol 74(3): 796-809.
-
Christiansen B, Schmith T, Thejll PA (2009) A Surrogate Ensemble Study of Climate Reconstruction Methods: Stochasticity and Robustness. J Climate 22(4): 951-976.
-
Deser C, Knutti R, Solomon S, Phillips AS (2012) Communication of the Role of Natural Variability in Future North American Climate. Nature Clim Change 2: 775-779.
-
Barrio Pedro D, Fischer E, Lautenbacher J, Trigo RM, García Herrera R (2011) The Hot Summer of 2010: Redrawing the Temperature Record Map of Europe. Science 332(6026): 220-224.
-
Ahmed M (2013) Continental-Scale Temperature Variability During the Past Two Millennia. Nature Geosci 6: 339-346.
-
Jansen E, Overpeck J, Briffa KR, Duplessy JC, Joos F, et al. (2007) Paleoclimate. In: Solomon S, et al. (Eds.), Climate Change 2007: The Physical Science Basis. Fourth Assessment Report of the Intergovernmental Panel on Climate Change. Cambridge University Press, United Kingdom, pp: 8.
-
Robock A (1981) The Mount St. Helens Volcanic Eruption of 18 May 1980: Minimal Climatic Effect. Science 212(4501): 1383-1384.
-
Mather TA, Allen AG, Davison BM, Pyle DM, Oppenheimer C, et al. (2004) Nitric acid from volcanoes. Earth Planet Sci Lett 218(1-2): 17-30.
-
Glasow VR, Bobrowski N, Kern C (2009) The Effects of Volcanic Eruptions on Atmospheric Chemistry. Chem Geol 263(1-4): 131-142.
-
Bluth GJS, Dorion SD, Schnitzler SC, Kreger AJ, Walter LS (1992) Gobal Tracking of the SO2 Clouds from the June 1991 Mount Pinatubo Eruptions. Geophys Res Lett 19: 151-154.
-
Schurer AP, Tett SFB, Hegerl GC (2014) Small Influence of Solar Variability on Climate Over the Past Millennium. Nat Geo Sci 7: 104-108.
-
Parker DE, Brownscombe JL (1983) Stratospheric Warming following the El Chichón Volcanic Eruption. Nature 301: 406-408.
-
Iles CE, Hegerl GC (2015) Systematic Change in Global Patterns of Stream flow Following Volcanic Eruptions. Nat Geo Sci 8: 838-842.
-
Liu F, Chai J, Wang B, Liu J, Zhang X, et al. (2016) Global Monsoon Precipitation Response to Large Volcanic Eruptions. Sci Rep 6: 24331.
-
Crowley TJ (2000) Causes of Climate Change over the Past 1000 Years. Science 289(5477): 270-277.
-
Shindell DT, Schmidt GA, Miller RL, Mann ME (2003) Volcanic and Solar Forcing of Climate Change During the Preindustrial Era. J Clim 16: 4094-4107.
-
Delworth TL, Nutson TRK (2000) Simulation of Early 20th Century Global Warming. Science 287: 2246-2250.
-
Paul P, Hans H, Dick PD, Paul B, Adrian JS, et al. (2016) ERA-20C: An Atmospheric Reanalysis of the Twentieth Century. J Clim 29(11): 4083-4097.
-
WCRP (2018) Climate and Ocean - Variability, Predictability and Change: Science Plan and Implementation Strategy. WCRP Publication No: 14/2018, pp: 1-45.
-
Walsh JE, Fetterer F, Stewart JS, Chapman WL (2017) A Database for Depicting Arctic Sea Ice Variations Back to1850. Geogr Rev 107(1): 89-107.
-
Mueller BL, Gillett NP, Monahan AH, Zwiers FW (2018) Attribution of Arctic Sea Ice Decline from 1953 to 2012 to Influences from Natural, Greenhouse Gas, and Anthropogenic Aerosol Forcing. J Clim 31(19): 7771- 7787.
-
Notz D, Stroeve J (2016) Observed Arctic Sea-Ice Loss Directly Follows Anthropogenic CO2 Emission. Science 354(6313): 747-750.
-
Day JJ, Hargreaves JC, Annan JD, Abe Ouchi A (2012) Sources of Multi-Decadal Variability in Arctic Sea Ice Extent Environ. Res Lett 7 034011.
-
García‐Herrera R, Pedro DB, Gallego D, Mellado Cano J, Wheeler DC, et al. (2018) Understanding Weather and Climate of the Last 300 Years from Ships ’Logbooks. Wiley Interdiscip Rev Clim Change 9(6): e544.
-
Williams, Jack (2005) Earth’s Tilt Creates Seasons. USA Today, Retrieved March 17, 2007.
-
Solanki SK, Krivova NA, Haigh JD (2013) Solar Irradiance Variability and Climate. Annual Review of Astronomy and Astrophysics 51: 311-351.
-
Solomon S, Qin D, Manning M, Chen Z, Marquis M, et al. (2007) Climate Change 2007- The Physical Science Basis. Fourth Assessment Report of the Intergovernmental Panel on Climate Change, Cambridge University Press, UK.
-
Bush E, Gillett N, Watson E, Fyfe J, Vogel F, et al. (2019) Understanding Observed Global Climate Change. In: Bush and E, et al. (Eds.), Canada’s Changing Climate Report. Canada, Ottawa, Ontario, pp: 24-72.
-
Shabbar A, Yu B (2012) Intraseasonal Canadian Winter Temperature Responses to Interannual and Interdecadal Pacific SST Modulations. Atmosphere-Ocean 50(1): 109- 121.
-
Salinger MJ, Renwick JA, Mullan AB (2001) Interdecadal Pacific Oscillation and South Pacific Climate. International Journal of Climatology 21(14): 1705-1721.
-
Bradley RS (1999) Paleoclimatology-Reconstructing Climates of the Quaternary. 2nd(Edn.), International Geophysics Series, Academic Press, USA, 64: 613.
-
Alverson KD, Bradley RS, Pedersen TF (2003) Paleoclimates, Global Change and the Future. 1st(Edn.), Global Change -The IGBP Series, Springer Berlin, Heidelberg, pp: 221.
-
Petit JR, Jouzel J, Raynaud D, Barkov NI, Barnola JM, et al. (1999) Climate and Atmospheric History of the Past 420,000 Years from Vostok Ice Core, Antarctica. Nature 399(6735): 429-436.
-
Hostetler SW, Mix AC (1999) Reassessment of Ice-Age Cooling of the Tropical Ocean and Atmosphere. Nature 399: 673-676.
-
Schneider RR, Bard E, Mix AC (2000) Last Ice Age Global Ocean and Land Surface Temperatures: The EPILOG Initiative. Global Change Newsletter 8(2): 19-21.
-
Bard E (2002) Climate Shock: Abrupt Changes over Millennial Time Scales. Physics Today 55(12): 32.
-
Dansgaard W, Johnsen SJ, Clausen HB, Dahl Jensen D, Gundestrup NS, et al. (1993) Evidence for General Instability of Past Climate from a 250-kyr Ice-Core Record. Nature 364: 218- 220.
-
Bond G, Broecker W, Johnsen S, McManus J, Labeyrie L, et al. (1993) Correlations between Climate Records from North Atlantic sediments and Greenland Ice. Nature 365: 143-147.
-
Ganopolski A, Rahmstorf S (2001) Rapid Changes of Glacial Climate Simulated in a Coupled Climate Model. Nature 409: 153-158.
-
Goosse H, Renssen H, Selten FM, Haarsma RJ, Opsteegh JD (2002) Potential Causes of Abrupt Climate Eevents: A Numerical Study with a Three-Dimensional Climate Model. Geophysical 29(18): 7-1-7-4.
-
Lohmann G, Schulz M (2000) Paleoceanography and Paleoclimatology-Reconciling Bølling Warmth with Peak Deglacial Meltwater Discharge. Paleoceanography 15(5): 537-540.
-
Stocker TF (1998) The Seesaw Effects. Science 282(5386): 61-62.
-
Crucifix M, Tulkens PH, Berger A (2001) Modeling Abrupt Climate Change During the Last Glaciation. In: Seidov D, et al. (Eds.), The Oceans and Rapid Climate Change: Past, Present, and Future. Geophysical Monograph, American Geophysical Union, 126: 117-134.
-
Heinrich H (1988) Origin and Consequences of Cyclic Ice Rafting in the Northeast Atlantic Ocean during the Past 130,000 Years. Quaternary Research 29(2): 142-152.
-
McIntyre A, Molfino B (1996) Forcing of Atlantic Equatorial and Subpolar Millennial Cycles by Precession. Science 274(5294): 1867-1870.
- Enhancement of Vegetative Growth and Fruit Yield in Cucumber (Cucumis sativus L.) via Spiritual Blessing (Biofield) Energy Intervention
- Production of Açaí (Euterpe oleracea Mart.) under Different Agroforestry System Management Intensities in Amazonian Floodplain (Varzea) Forests
- Coffee and the Production Region: What is the Secret to the Expression "Quality"?
- Experiential Agripreneurship Training in Sub-Saharan Africa: Integrating a Business Incubator into Postgraduate Livestock Education at the University of Buea
- Advances in Agricultural High-Quality Development
- Linking Compost Residue to ABAGE in Plants - a Short Note