Morpho-Physiological and Biochemical Responses of Tomato, Lettuce, Mexican Mint, and Industrial Hemp to Different Temperature Regimes
Temperature stress is a major abiotic factor significantly impacting crop growth, development and productivity. In this study, we investigated the effects of different growth temperatures (10°C, 22°C, and 35°C) on the morphological, physiological and biochemical responses of five important crop species: green lettuce, hemp, mint, red lettuce and tomato. The results revealed that plant height and stem girth of tomato plants were not significantly (p > 0.05) altered under 22°C and 35°C, but were reduced by ca. 61.9% and 65.7% respectively under 10°C compared to 22°C. Green lettuce plants grown under 22°C had significantly (p < 0.001) higher total chlorophyll content of ca. 35.9% than those under 10°C. Mint plants exposed to extreme temperatures of 35°C and 10°C showed significant (p < 0.001) reductions of up to 19.7%, 60.2%, and 45.8% in chlorophyll fluorescence indices Fv/Fm, Fv/Fo, and total chlorophyll content, respectively, compared to those grown under 22°C. Malonaldehyde content (MDA) in mint and tomato plants increased by ca. 686.7% and 476.4%, respectively, under 10°C compared to 22°C, while in red lettuce, MDA content was reduced by ca. 136% under 10°C compared to 35°C. Notably, flavonoid accumulation was significantly higher in hemp plants compared to other species. The results suggest that crop species exhibit diverse responses to temperature stress, extending beyond morphological, physiological and biochemical adaptations. This diversity shows the differential adaptive strategies employed by various plant species in response to temperature stress conditions. The findings of this study can be explored by various crop improvement programs to enhance the tolerance of these crops to temperature extremes, thereby contributing to food security amidst the threats posed by climate change.
Abbreviations
MDA: Malondialdehyde; TCA: Trichloroacetic Acid; H2O2: Hydrogen Peroxide Levels.
Introduction
Plants are integral components of ecosystems and plays an important role in the face of climate change. Climate is a fundamental factor that affect all aspects of plant life including growth, development, reproduction, and survival [1, 2]. Climate change is a major challenge for plant species worldwide which is characterized by rising temperatures and unpredictable weather patterns [3, 4, 5]. This shows the urgency of understanding how different plant species respond to fluctuating environmental factors such as rainfall, humidity, wind and temperatures [6]. The impact of temperature on plant species is particularly significant, as it directly influences all processes vital for growth and development across various stages of their life cycle from germination to maturity [5, 7].
Moreover, there are differences among plant species in their responses to variations in temperature and their adaptive capacity to different temperature thresholds may determine their resilience to the ever-ending changes in climate [5, 6, 7, 8, 9]. Studying how different plant species respond to different temperature conditions can provide valuable insights into their adaptive strategies and potential impacts on ecosystems [10]. In addressing the pressing issue of rising global temperatures, understanding the thermo-tolerance mechanisms of essential crops becomes paramount for ensuring food security and agricultural sustainability [11, 12, 13]. Tomato (Solanum lycopersicum), lettuce (Lactuca sativa), Mexican mint (Plectranthus amboinicus), and industrial hemp (Cannabis sativa) are key crops with significant roles in both nutritional and industry applications.
However, their sensitivity to extreme temperature regimes poses significant challenges to their cultivation in the face of climate change [14].
These plants exhibit distinct physiological responses to elevated temperatures, making them compelling subjects for research on climate adaptation. For instance, tomato plants are highly sensitive to heat stress during flowering and fruit set stages, impacting yield and fruit quality [15, 16]. Lettuce, typically a cool-season crop, is prone to bolting and altered taste of increased bitterness under high temperatures in the 32 - 37°C range causing reduction in market value [17, 18, 19]. While little or no comprehensive research exists on the temperature responses of Mexican mint and industrial hemp, thermal stress can significantly alter the production of essential Mexican mint oil as well as the cannabinoid content and fiber quality of industrial hemp [20, 21].
Despite considerable research demonstrating aspects of heat stress response in these crops, little is known about their specific thermos-tolerance mechanisms and the interactive effects of temperature on growth, development, and biochemical processes. Furthermore, with climate change projections indicate a steady increase in global temperatures, there is an urgent need to identify resilient crop varieties and management strategies to mitigate temperature effects on global agricultural productivity [22, 23, 24, 25]. This study aimed to investigate the thermal resilience of tomato, lettuce, Mexican mint, and industrial hemp under varying temperature conditions. By subjecting these crops to controlled environments mimicking future climate scenarios, we aimed to uncover the physiological and biochemical mechanisms underpinning their responses to these conditions.
Materials and Methods
Plant Materials, Experimental Treatments and Design, and Growth Conditions
The study was performed at the Faculty of Agriculture, Nova Scotia, Bible Hill between January and March 2024. Tomato (Solanum lycopersicum) cultivar ‘Scotia’, green lettuce, and red lettuce (Lactuca sativa) cultivars ‘Green Romaine’ and ‘Red Romaine’ seeds were purchased from Halifax Seeds (Halifax, Canada).
Hemp (Cannabis sativa) cultivar ‘Vega’ seeds were obtained from Fibre Source Processing Inc., Canada. Mexican Mint (Plectranthus amboinicus) cuttings were obtained from the greenhouse at Dalhousie University. Seeds and cuttings of the various plant species were planted in 11-inch pots filled with Pro-Mix® BX (Premier Tech Horticulture, Québec, Canada). These plant species were raised in the greenhouse conditions at 22°C/18°C (day/night) temperatures and about 70% relative humidity with a 16 h photoperiod. Supplemental lighting was provided by a 600 W HS2000 high-pressure sodium lamp with NAH600.579 ballast (P.L. Light Systems, Beamsville, Canada). The plants were later transferred into the growth chambers with 150 μmol m-2 s-1 light intensity at 12 h photoperiod, and 70% relative humidity. The temperature regimes were 35°C, 22°C, and 10°C. The plants were arranged in a completely randomized design with four replications. The experimental treatments 35°C, 22°C, and 10°C were not adequately replicated in space and time. However, there were 4 pots for each plant species which were randomly placed in each treatment condition. Thus, pseudo-replication was adopted by re-arranging the experimental pots on weekly basis to offset any unpredictable occurrence due to variations in environment a method described by Schank, et al. [26] and adopted by Abbey, et al. [27] and Nutsukpo, et al. [28].
Plant Growth and Photosynthetic Activities
Plant growth parameters were measured at 21 days after imposing the treatments. A ruler was used to measure plant height from the collar of the stem to the tip of the highest leaf and the diameter of the main stem was measured at the collar with a digital Vernier calliper (Mastercraft, ON, Canada). The leaves were counted and recorded per plant for each treatment. Leaf area was measured by LI-3100 leaf area meter (LI-COR Inc. Lincoln, Nebraska, USA). Leaf greenness was used to estimate chlorophyll content on four fully expanded leaves per plant using a SPAD 502-plus chlorophyll meter (Spectrum Technologies, Inc., USA). Chlorophyll fluorescence indices i.e., maximum quantum efficiency (Fv/ Fm) and potential photosynthetic capacity (Fv/Fo) were assessed on the same leaves with a Chlorophyll fluorometer (Optical Science, USA). Net photosynthetic rate, transpiration rate, intracellular carbon dioxide concentration, and stomatal conductance were assessed from the same four leaves using LCi portable photosynthesis system (ADC BioScientific Ltd, UK) using the manufacturers protocol.
Phytochemical Analysis
At final harvest (21 days after imposing the treatments), green and healthy leaves of each plants were sampled and immediately frozen in liquid nitrogen. The frozen samples were ground into fine powder and stored in a -80°C freezer for further biochemical analysis.
Lipid Peroxidation and H2O2 Production Determination: Lipid peroxidation was determined based on malondialdehyde (MDA) concentration according to the method described by Hodges DM, et al. [29] with slight modifications. Briefly, a 0.2 g ground leaf samples were homogenized in 1.7 mL of 0.1% (w/v) trichloroacetic acid (TCA). The homogenate was centrifuged at 16,000 g for 10 min at 4◦C. A 500 μL of the supernatant was added to an equal amount of 0.5% thiobarbituric acid (TBA) in 20% TCA. The mixture was incubated at 95◦C for 30 min, cooled on ice, and centrifuged at 12,000 g for 5 min. The absorbance of the supernatant was read at 532 nm and a non-specific absorption at 600 nm. The concentration of MDA was calculated from the extinction coefficient 155 m/M cm using the equation C = [Abs (535 - 600) ÷155,000] x106. MDA concentration was expressed as nmol MDA g-1 fresh weight (FW). Hydrogen peroxide levels (H2O2) were determined according to the method described by Alexieva V, et al. [30]. A 0.1 g of the ground leaf samples were homogenized in 1.7 mL 0.1% (w/v) TCA. The mixture was centrifuged at 16,000 g for 10 min at 4◦C. A 200 μL of the supernatant was mixed with 200 μL of 100 mM potassium phosphate buffer (pH 7.0) and 800 μL of 1 M potassium iodide. The reaction was developed for 1 h in the dark, and the absorbance was read at 390 nm against a blank that consisted of 0.1% TCA in the absence of leaf extract. The level of H2O2 was determined from a pre-determined H2O2 standard curve.
Total Sugar Estimation: Total sugar was determined using the phenol-sulphuric acid procedure described by Dubois M, et al. [31]. In brief, a 0.2 g of ground leaf tissue was mixed with 1.7 mL of 90% ethanol and incubated in a water bath at 60°C for 60 min. The volume of the mixture was re-adjusted to 10 mL with 90% ethanol and centrifuged at 12000 × g for 3 min. 1 mL of the supernatant was thoroughly mixed with 1 mL of 5% phenol in a thick-walled glass test tube and 5 mL of concentrated sulphuric acid was added. The reaction mixture was vortexed for 20 s, incubated in the dark for 15 min before cooling to room temperature of about 22oC. The absorbance was read at 490 nm against a blank using UV-vis spectrophotometer. Total sugar content was estimated using a sugar standard curve and expressed as µg of glucose g-1 fresh weight.
Total Protein Estimation and Peroxidase Enzyme Activity: Leaf tissue total protein content was determined by mixing 0.2 g of sample with 1.7 mL ice-cold extraction buffer (i.e., 50 mM potassium phosphate buffer (pH 7.0), 1% polyvinylpyrrolidone, and 0.1 mM EDTA) and centrifuged at 12000 × g for 20 mins at 4oC. The supernatant, a crude enzyme extract, was transferred into a new vial and 1 mL of Bradford’s reagent was added. The absorbance of the mixture was read at 595 nm after 5 mins using UV-vis spectrophotometer (Jenway, Staffordshire, UK) and the protein content was calculated from a bovine serum albumin standard curve ranging from 200 to 900 µg mL-1 [32]. Peroxidase (POD, EC 1.11.1.7) activity was determined using Pyrogallol as substrate according to Chance, et al. [33] with little modification. The reaction mixture consisted of 100 mM potassium-phosphate buffer (pH 6.0), 5% pyrogallol, 0.5 % H2O2 and 100 μL of crude enzyme extract. Following reaction mixture incubation at 25°C for 5 min, 1 mL of 2.5 N H2SO4 was added to stop the reaction and the absorbance was read at 420 nm against a blank (ddH2O). One unit of POD forms 1 mg of purpurogallin from pyrogallol in 20 s at pH 6.0 at 20°C.
Chlorophyll a, b and Carotenoid Content: Leaf tissue chlorophylls a and b, and carotenoids were determined as described by Linchtenthaler [34]. A 0.2 g of ground samples were transferred into a sterile 2 mL microfuge tube and 5 mL of 80% acetone was added. The mixture was vortexed for 1 min and centrifuged at 12,000 × g for 15 min. A 200 µL of the supernatant was transferred into a microplate and the absorbance (A) was measured at 646.8 and 663.2 nm with a UV-vis spectrophotometer (Jenway, Staffordshire, UK) against 80% acetone as blank. The chlorophylls were expressed as µg g-1 FW. For the carotenoid, the absorbance was measured at 470 nm and the total carotenoid content was expressed as µg g-1 FW.
Total Phenolics Estimation: Total phenolics content (TPC) was determined by the Folin–Ciocalteu assay as described by Ainsworth & Gillespie [35] with slight modification. A 0.2 g of the ground sample per treatment was homogenized in 1.7 mL in ice-cold 95% methanol and incubated in the dark at room temperature for 48 h. The mixture was centrifuged at 15,000 × g for 15 min and 100 µL of supernatant was transferred into a new microfuge tube. 200 µL of 10% Folin-Ciocalteau reagent was added and vortexed for 5 min. 800 µL of 700 mM sodium carbonate was added, vortexed for 1 min and incubated at room temperature for 2 h. The absorbance of the resultant mixture was measured at 765 nm. Total phenolic content was estimated using gallic acid equivalents standard curve and was expressed as mg gallic acid equivalents per g fresh weight (i.e., mg GAE/g FW).
Total Flavonoid Estimation: Total flavonoid content was determined as described by Chang Chia-Chi et al. [36] with some modifications. A 0.2 g of the ground sample was homogenized with 1.7 mL of 95% methanol. The mixture was centrifuged at 15,000 × g for 15 min and 500 µL of the supernatant was transferred into a new tube. To each tube, 1.5 mL of 95% methanol, 0.1 mL of 10% aluminum chloride, 0.1 mL of 1 M potassium acetate, and 2.8 mL of distilled water were added. The mixture was vortexed and incubated for 30 mins at room temperature and the absorbance was measured at 415 nm against a blank. Flavonoids content was estimated using a quercetin standard curve and expressed as µg quercetin equivalents per g fresh weight (µg quercetin/g FW).
DPPH Estimation: The 2,2-diphenyl-1-picrylhydrazyl (DPPH) radical scavenging capacity was determined using the method described by Dudonné S, et al. [37] with slight modification. A 0.2 g of ground leaf tissue was homogenized with 1.7 mL of pure methanol and centrifuged at 12000 × g for 10 min. A 100 µL of the supernatant was mixed with 2.9 mL of 60 µM fresh DPPH methanolic solution and the resultant mixture was incubated in the dark at room temperature. After 30 min, the absorbance was measured at 515 nm against a methanol blank using UV-vis spectrophotometer. Radical scavenging activity was determined as Inhibition (%) = [(AB – AS)/ AB] × 100%; where AB is blank absorbance and AS is sample absorbance.
Statistical Analysis
All data obtained were subjected to two-way analysis of variance (ANOVA) using Minitab version 21 (Minitab, Inc., State College, Pennsylvania, USA). Tukey’s honestly post- test was used to separate treatment means when the ANOVA indicated p ≤ 0.05. A Kruskal-Wallis test was carried out for photosynthetic rate and H2O2 content, and Mann-Whitney test was used to establish significance between the crop species and the different temperature at p ≤ 0.05. Prism was used to plot graphs.
Results
Morphological Response
The morphological parameters of the different crop species were significantly (p < 0.001) affected by their interaction with the different growth temperatures (Table 1, Figure 1). The height, stem girth and leaf area of green lettuce were substantially reduced at 35°C and 10°C. The height was reduced by ca. 27.5% and 54.6%; stem girth by ca. 49.4% and 60.4%; and leaf area by ca. 45.0%.
| Crop | Temp (°C) | Plant Height (cm) | Stem Girth (mm) | Leaf Number | Leaf Area (cm2) | SPAD |
|---|---|---|---|---|---|---|
| Green Lettuce | 35 | 13.83 d | 5.50 bcd | 8.28 cdef | 41.98 c | 44.75 abcde |
| Hemp | 35 | 42.70 a | 3.20 ef | 15.29 b | 25.58 d | 58.46 a |
| Mint | 35 | 3.82 fg | 3.21 ef | 29.59 a | 1.66 i | 52.62 abc |
| Red Lettuce | 35 | 15.34 cd | 3.80 cde | 6.96 ef | 25.60 d | 25.30 h |
| Tomato | 35 | 20.56 b | 5.54 bc | 8.30 cde | 10.32 f | 41.80 cde |
| Green Lettuce | 22 | 19.06 bc | 10.87 a | 7.56 def | 76.34 a | 44.30 bcde |
| Hemp | 22 | 46.42 a | 3.29 e | 11.92 bc | 54.91 b | 45.93 abcd |
| Mint | 22 | 5.41 f | 3.72 cde | 11.92 bc | 5.16 d | 44.56 bcde |
| Red Lettuce | 22 | 19.14 bc | 6.47 ab | 6.96 ef | 82.99 a | 25.01 h |
| Tomato | 22 | 20.67 b | 4.36 bcde | 6.74 ef | 38.59 c | 38.21 def |
| Green Lettuce | 10 | 8.66 e | 4.30 bcde | 4.31 g | 13.64 e | 37.20 defg |
| Hemp | 10 | 19.64 b | 2.31 fg | 7.87 def | 17.23 e | 34.02 efgh |
| Mint | 10 | 2.67 g | 4.23 bcde | 10.44 bcd | 2.98 h | 27.74 gh |
| Red Lettuce | 10 | 8.60 e | 3.52 de | 5.48 fg | 13.59 ef | 28.88 fgh |
| Tomato | 10 | 7.87 e | 1.90 g | 4.47 g | 2.65 h | 54.39 ab |
| Sources of variation | p-value | |||||
| Crop | <0.001 | <0.001 | <0.001 | <0.001 | <0.001 | |
| Temp | <0.001 | <0.001 | <0.001 | <0.001 | <0.001 | |
| Crop × Temp | <0.001 | <0.001 | <0.001 | <0.001 | <0.001 |
Table 1: Morphological response of different crop species under varying temperatures.
Values are the means of four replicates and different letters indicate significant (p < 0.05) differences according to Tukey’s post hoc test.
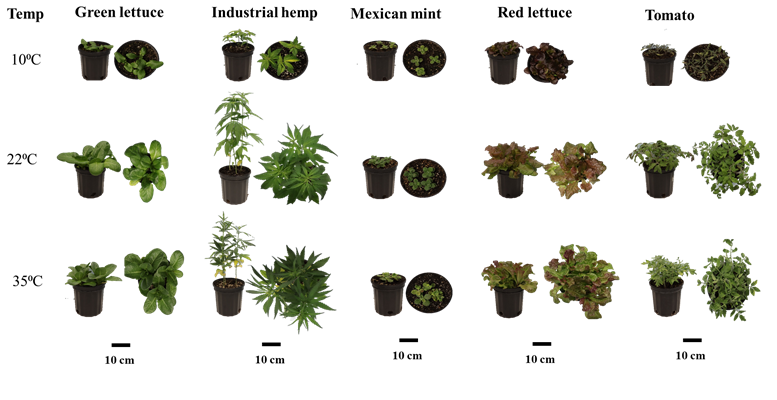
The leaf number of green lettuce was not significantly (p > 0.05) affected when grown under 35°C but was highly reduced under 10°C. However, the SPAD of green lettuce was not significantly affected under the different temperatures. Similarly, the height, stem girth, leaf number and SPAD of hemp were significantly (p > 0.05) not affected by 35°C and 22°C but were reduced drastically under 10°C. The leaf area of hemp was significantly reduced by ca. 53.4% and 68.6% when grown under 35°C and 10°C compared to those under 22°C (Table 1). Also, the height and SPAD of mint were not significantly (p > 0.05) affected by 35°C and 22°C, but reduced by ca. 50.6% and 37.7% respectively, compared to those under 22°C (Table 1).
Although the stem girth of mint was not affected by the different temperatures, the leaf number was significantly (p < 0.001) lower under 22°C and 10°C, while leaf area was reduced when grown under 35°C and 10°C. Moreover, the height of red lettuce was significantly (p < 0.001) reduced by up to ca. 55.1% under 10°C, but was not influenced when grown under both 22°C and 35°C (Table 1). The stem girth and leaf area of red lettuce were significantly (p < 0.001) higher (ca. up to 83.8% and 510.7% respectively) under 22°C than those under 35°C and 10°C, while both leaf number and SPAD were not significantly (p > 0.05) influenced by the different temperatures (Table 1). Furthermore, the height, stem girth and leaf number of tomato were not significantly (p < 0.001) altered under both 22°C and 35°C, but were reduced considerably by ca. up to 61.9%, 65.7%, and 46.1% respectively under 10°C (Table 1). However, the leaf area of tomato was reduced substantially under 35°C and 10°C, while the SPAD was significantly (p < 0.001) increased by ca. 42.3% under 10°C compared to those grown under both 22°C and 35°C (Table 1).
Physiological Response
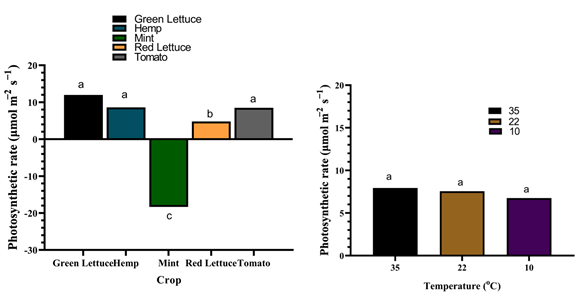
All the physiological parameters of the different crop species were significantly (p < 0.001) affected by their interaction with the different growth temperatures (Table 2), except for the photosynthetic rate (Figure 2). Although the chlorophyll fluorescence indices (Fv/Fm and Fv/Fo), sub-stomatal CO2 (Ci), transpiration rate (E) and stomatal conductance (gs) of green lettuce were not considerably altered by the different temperatures, the total chlorophyll content was significantly (p < 0.001) increased by ca. 35.9% in plants grown under 22°C compared to those under
10°C (Table 2). Likewise, the Ci, E and gs of hemp plants were not significantly (p > 0.05) affected by the different temperatures, while Fv/Fm, Fv/Fo, and total chlorophyll content were significantly (p < 0.001) reduced by ca. 6.1%, 22.9% and 42.1% respectively, compared to those grown under 22°C (Table 2). Nevertheless, the Fv/Fm and Fv/Fo content of hemp plants under 35°C were not significantly (p > 0.05) different from those grown under 22°C.
Moreover, Fv/Fm, Fv/Fo, and total chlorophyll content of mint were significantly (p < 0.001) reduced by ca. up to 19.7%, 60.2% and 45.8% respectively, under 35°C and 10°C compared to those grown under 22°C (Table 2).
Crop Temp Fv/Fm Fv/Fo Ci E gs Total Chlorophyll
Green Lettuce 35 0.810 abcd 4.28 abcd 374.89 bc 5.82 abc 0.29 abcde 389.92 cd Hemp 35 0.803 abcde 4.10 abcde 426.27 bc 5.54 abc 0.33 abcd 505.95 b Mint 35 0.776 def 3.49 de 1391.50 ab 1.86 efgh 0.06 fgh 71.92 i Red Lettuce 35 0.803 abcde 4.17 abcd 390.56 bc 5.21 abcd 0.22 abcdef 173.51 g Tomato 35 0.787 de 3.71 cde 365.85 c 3.46 cdfe 0.15 cdef 361.75 cde Green Lettuce 22 0.805 abcde 4.15 abcd 513.41 bc 4.68 abcde 0.25 abcde 425.92 bc Hemp 22 0.814 abcd 4.39 abc 562.51 abc 8.63 a 0.60 ab 699.06 a Mint 22 0.824 abc 4.70 ab 274.82 c 0.82 gh 0.03 gh 132.70 h Red Lettuce 22 0.825 ab 4.73 a 507.67 bc 1.79 efgh 0.07 efgh 182.30 g Tomato 22 0.795 cde 3.90 cde 379.43 bc 3.48 cdef 0.17 bcdef 378.98 cd Green Lettuce 10 0.809 abcde 4.25 abcd 456.18 bc 4.04 bcdef 0.42 abc 313.47 def (°C) (µmol mol−1) (mol m−2 s−1) (mol m−2 s−1) (mg/g FW)
| Hemp | 10 | 0.764 ef | 3.26 e | 496.25 bc | 7.62 ab | 0.83 a | 405.01 bcd |
|---|---|---|---|---|---|---|---|
| Mint | 10 | 0.662 f | 1.87 f | 3202.13 a | 0.23 h | 0.02 h | 80.32 i |
| Red Lettuce | 10 | 0.826 a | 4.78 a | 478.28 bc | 1.96 defg | 0.16 bcde | 288.71 ef |
| Tomato | 10 | 0.798 bcde | 3.97 bcde | 274.89 c | 1.49 fgh | 0.10 defg | 257.46 f |
| Sources of variation | p-value | ||||||
| Crop | <0.001 | <0.001 | 0.001 | <0.001 | <0.001 | <0.001 | |
| Temp | <0.001 | <0.001 | 0.224 | <0.001 | 0.321 | <0.001 | |
| Crop × Temp | <0.001 | <0.001 | <0.001 | 0.003 | 0.005 | <0.001 |
Table 2: Physiological response of different crop species under varying temperatures. Ci: sub-stomatal CO2; E; transpiration rate
Table 2: Physiological response of different crop species under varying temperatures. Ci: sub-stomatal CO2; E; transpiration rate; gs; stomatal conductance. Values are the means of four replicates and different letters indicate significant (p < 0.05) differences according to Tukey’s post hoc test. Although the Ci of mint was increased under 35 °C and 10°C, the E and gs were not significantly (p > 0.05) altered by different temperatures. Similarly, Fv/Fm, Fv/Fo, Ci, E, and gs of red lettuce were not significantly (p > 0.05) affected by the different temperatures, while total chlorophyll content was considerably increased by ca. 66.4% and 58.4% under 10°C compared to those grown under 35°C and 22°C respectively. Additionally, all the physiological parameters of tomato were not significantly (p > 0.05) altered by the different temperatures, except for total chlorophyll content which was substantially reduced by ca. 32.1% under 10°C compared to those grown under both 22°C and 35°C. Besides, the photosynthetic rate was significantly (p < 0.001) reduced in mint plants compared to the other crop species, while the different growth temperatures exhibited no effect on the photosynthetic rate of the different crop species (Figure 2).
ROS Accumulation and Lipid Peroxidation
H2O2 content was determined to assess the oxidative stress in the crop species under different growth temperatures (Table S1). The results showed that H2O2 content was significantly (p < 0.001) reduced in green lettuce and mint compared to the other crop species, while the different growth temperatures had no substantial effect on the H2O2 content of the different crop species (Table S1). The extent of membrane lipid peroxidation damage via malonaldehyde (MDA) accumulation revealed a significant interaction between the crop species and the different temperatures (Figure 3). The MDA content of green lettuce was significantly (p < 0.001) increased by ca. 93.0% and 112.6% in under 10°C and 35°C respectively, compared to those under 22°C. Contrarily, the MDA content of hemp was considerably higher under 22°C compared to those under 10°C and 35°C.
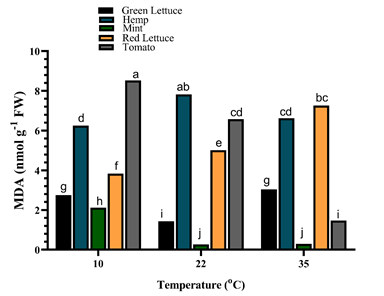
In mint plants, the MDA content was significantly (p < 0.001) increased by ca. 686.7% in those exposed to 10°C compared to plants under both 22°C and 35°C whose MDA contents were not different from each other. Moreover, the MDA content of red lettuce was significantly (p < 0.001) lower under 10°C, but increased drastically by ca. 30.7% and 89.3% upon exposure to 22°C and 35°C, respectively. Similarly, the MDA content of tomato plants was significantly (p < 0.001) increased by ca. 476.4% under 10°C, but reduced considerably when grown under 35°C (Figure 3).
Osmolyte Accumulation
Total protein and sugar contents of the different crop species were significantly (p < 0.001) affected by their interaction with the various growth temperatures (Figure 4).
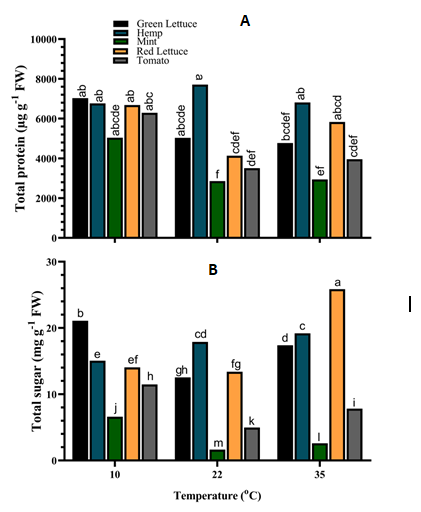
The results revealed that the total protein content of both green lettuce and hemp was not significantly (p > 0.05) altered under the different temperatures, although the total protein content was higher under 10°C for green lettuce and 22°C for hemp (Figure 4A). Similarly, the total protein content of mint tissues was significantly (p < 0.001) increased by up to ca. 76.4% under 10°C compared to those grown under 22°C and 35°C (Figure 4A). Also, red lettuce tissues accumulated considerably high levels of total protein under 10°C and 35°C compared to those under 22°C (Figure 4A). In tomato tissues, total protein content was significantly (p < 0.001) increased by ca. up to 79.3% under 10°C compared to those grown under 22°C and 35°C. Moreover, the total sugar content of green lettuce tissues was significantly increased by ca. 68.3% and 21.3% under both 10°C and 35°C respectively, compared to those grown under 22°C (Figure 4B). The total sugar content of hemp tissues was increased under 22°C and 35°C while that of mint was significantly reduced at the same temperatures (Figure 4B). However, total sugar content increased by ca. 301.0% in mint plants under 10°C (Figure 4B). The total sugar content was not significantly (p > 0.05) altered in red lettuce tissues under both 10°C and 22°C but was increased substantially by ca. 93.1% under 35°C. Similarly, the total sugar content of tomato tissues was significantly (p < 0.001) increased by ca. 130.5% and 57.0% under 10°C and 35°C respectively, compared to those grown under 22°C (Figure 4B).
Antioxidants Compound Accumulation
Carotenoid, flavonoid and phenolic contents were significantly (p < 0.001) affected by the interaction between the crop species and the various growth temperatures (Figure 5). The carotenoid content of green lettuce and tomato was not significantly (p > 0.05) altered under the different temperatures (Figure 5A).
The carotenoid content of hemp tissue was increased by ca. 63.3% under 22°C compared to those grown under 10°C and 35°C (Figure 5A). Similarly, the carotenoid content of mint increased under both 10°C and 22°C, while that of red lettuce only increased by ca. 48.6% when grown under 10°C (Figure 5A).
Also, the flavonoid content of green lettuce was increased under 35°C while that of tomato remained unaltered under the different temperatures (Figure 5B). The flavonoid content of hemp was significantly (p < 0.001) increased by ca.
34.4% and 15.2% under 22°C and 35°C respectively, compared to those grown under 10°C, while that of mint and red lettuce was increased under both 10°C and 35°C (Figure 5B). Furthermore, the phenolic content of green lettuce and mint was significantly (p < 0.001) increased by ca. 23.8% and 118.9% respectively, when grown under 10°C compared to those under 22°C (Figure 5C).
However, the phenolic content of mint under 35°C was higher than those under 22°C, while that of green lettuce remained unaltered under 35°C compared to those under 22°C (Figure 5C).
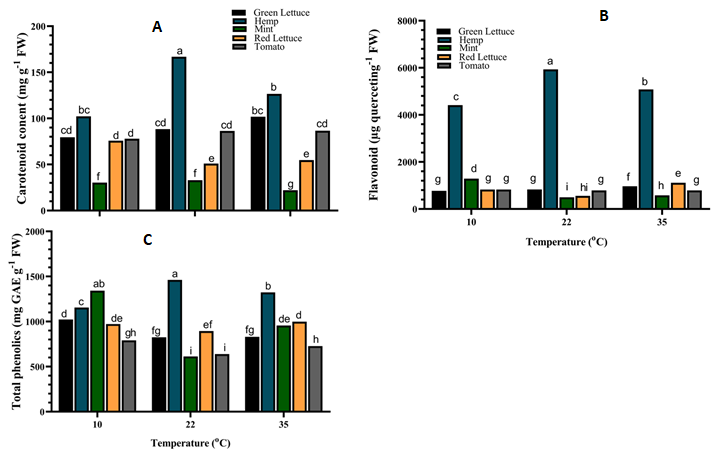
Figure 5: Antioxidant compound contents of different crop species under varying temperatures. (A) Carotenoid (B) Flavonoid (C) Phenolic. Values are the means of four replicates and different letters indicate significant (p < 0.05) differences according to Tukey’s post hoc test. Likewise, the phenolic content of hemp was increased by ca. 26.5% and 14.5% under both 22°C and 35°C respectively, while that of red lettuce and tomato were increased at both 10°C and 35°C (Figure 5C).
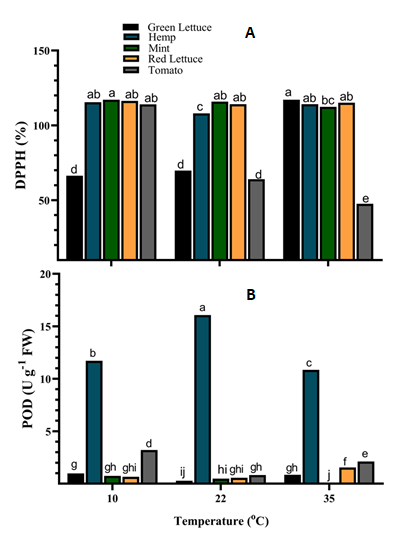
ROS Scavenging and Antioxidant Enzyme Activity
The ROS scavenging (DPPH) and POD enzyme activities of leaf tissue extracts of the different crop species showed a significant (p < 0.001) interaction with the various growth temperatures (Figure 6). The DPPH scavenging activity of green lettuce tissue was significantly higher (ca. 67.8%) under 35°C, while that of hemp was significantly higher (ca. 6.9% and 5.6%) under both 10°C and 35°C respectively when compared to those under 22°C (Figure 6A). Similarly, the DPPH scavenging activity of mint tissues was slightly higher under both 10°C and 22°C, whereas that of red lettuce remained unaltered under the different growth temperatures. In tomato tissues, the DPPH scavenging activity was significantly higher (ca. 139.7%) in plants grown under 10°C followed by those under 22°C (ca. 34.7%) compared to those under 35°C (Figure 6A). POD activity was significantly (p < 0.001) higher in the tissues of green lettuce (ca. 250.1% and 204.2%) and tomato (ca. 289.8% and 155.6%) under both 10°C and 35°C respectively compared to those under 22°C (Figure 6B). However, the POD activity was higher in hemp tissues under 22°C and 10°C compared to those under 35°C (Figure 6B). The POD activity of mint tissues was slightly higher under 10°C and 22°C but reduced significantly (p < 0.001) by ca. 74.9% in tissues of plants grown under 35°C. Besides, POD activity was significantly higher in red lettuce tissues grown under 35°C, but that of those under 10°C and 22°C were not significantly (p > 0.05) different from each other (Figure 6B).
Discussion
The present study investigated the effects of different growth temperatures (10°C, 22°C, and 35°C) on the morphological, physiological, biochemical and antioxidant responses of five important crop species: green lettuce, hemp, mint, red lettuce and tomato. The results demonstrate that these crop species exhibit diverse responses to temperature variations among these species, which haves significant implications on their growth, development and stress adaptation.
Temperature plays a significant rolely influences plant growth and development morphology [38]. For tomatoes, the ideal temperature range is 21–27°C during the day and 16–18°C at night [39, 40, 41].
Temperatures of 10°C and 35°C fall outside this range, with 10°C being 5°C below their lower tolerance limit and 35°C exceeding their upper limit by 3°C. Such deviations disrupt physiological processes and metabolic activities, negatively impacting growth. Lettuce thrives in cooler conditions with the maximum optimal temperature of 22°C, making it more vulnerable to higher temperatures like 35°C [17]. Industrial hemp exhibits optimal germination between 19–30°C but lacks detailed reports on its specific growth temperature preferences [42]. Mexican mint originates from tropical environments; while no scientific studies are available on its ideal temperature range, it likely tolerates warmer conditions better than cooler ones.
The study revealed that with notable effects observed at extreme temperatures of (10°C and 35°C) significantly compared to the moderate temperature of 22°C. For instance, all the crop species exhibited substantial reductions in plant height, stem girth, and leaf area across all crop species, under 10°C temperature. Specifically, similarly, the leaf area in of hemp and mint was significantly reduced at 35°C.
These findings indicates that the extreme temperatures negatively impact the growth and development [43, 44] of these crop species. This is likely due to the disruption of physiological processes and metabolic activities [45, 46]. On the other hand, under moderate temperatures, the crop species showed increased stem girth and leaf area suggesting a favourable response to the conditions.
The physiological parameters such as chlorophyll fluorescence indices (Fv/Fm and Fv/Fo), sub-stomatal CO2 (Ci), transpiration rate (E), and stomatal conductance (gs), were also affected by the different growth temperatures. The total chlorophyll content was significantly increased in green lettuce and red lettuce under 22°C, while it was reduced in hemp, mint, and tomato at the extreme temperatures.
These changes in chlorophyll content may be attributed to the altered photosynthetic efficiency and the plants’ ability to adapt to the stress conditions [47, 48]. However, the photosynthetic rate was not significantly affected by the different growth temperatures in any of the crop species suggesting that temperature acclimation is a homeostatic response to maintain photosynthesis under these growth conditions [49].
The accumulation of reactive oxygen species (ROS) and lipid peroxidation, as indicated by H2O2 and malonaldehyde (MDA) content, respectively, were also influenced by the growth temperatures. The H2O2 content was significantly reduced in green lettuce and mint compared to the other crop species, suggesting a better ability to scavenge ROS [50, 51] in order to maintain cellular homeostasis and protect themselves from oxidative damage [52, 53]. The MDA content, a marker of membrane lipid peroxidation, was significantly increased in green lettuce, mint, red lettuce, and tomato under 10°C and 35°C.
Conversely, hemp exhibited notably higher MDA content at 22°C compared to temperatures of 10°C and 35°C indicating the occurrence of oxidative stress and membrane damage [54]. These findings are consistent with previous studies that have reported increased lipid peroxidation in plants exposed to temperature stress [55, 56, 57].
The accumulation of osmolytes, such as total proteins and sugars was also affected by the growth temperatures. The total protein content was significantly increased in mint, red lettuce, and tomato under 10°C, while the total sugar content was increased in green lettuce, red lettuce, and tomato under 10°C and 35°C. The accumulation of these osmolytes is a common adaptive response to environmental stresses, as they help maintain cellular homeostasis and protect cellular structures [58, 59]. This adaptive mechanism is in consistent with several studies including [60, 61, 62].
The antioxidant compounds, including carotenoids, flavonoids, and phenolics, were also influenced by the growth temperatures. The carotenoid content was increased in hemp, mint, and red lettuce under 22°C, while the flavonoid content was increased in hemp, mint, and red lettuce under 10°C and 35°C. The increase in flavonoids under high temperature corroborates in sweet basil [63]. The phenolic content was significantly increased in green lettuce, mint, hemp, red lettuce, and tomato under 10°C and 35°C. This aligns with findings from studies by Pistelli L, et al. [64], which demonstrated that exposure to heat stress at 38°C notably augmented the antioxidant capacity in Melissa officinalis L. Furthermore, the observed elevation in phenolic and flavonoid contents in mint, hemp, and red lettuce under 10°C parallels findings reported by Alhaithloul HAS, et al. [65] in tomato plants subjected to cold stress. These antioxidant compounds play a crucial role in scavenging ROS and protecting plants from oxidative damage under stress conditions [66, 67].
The ROS scavenging activity, as measured by DPPH assay, and the activity of the antioxidant enzyme peroxidase (POD) were also affected by the growth temperatures. The DPPH scavenging activity was significantly higher in green lettuce, hemp, and tomato under 35°C and 10°C, while the POD activity was increased in green lettuce, tomato, and red lettuce under 10°C and 35°C. Such increasing DPPH radical scavenging capacity in response to heat stress has been reported in peppermint [68], sweetpotato [69] and wheat [70]. These findings suggest that the crop species employ various antioxidant mechanisms to mitigate the effects of temperature stress [71]. On the contrary, in Premna serratifolia L. increase in temperature caused a reduction DPPH scavenging capacity [72]. This is evident that various plant species exhibit varying responses to different temperature regimes.
The study reveals critical insights into the impact of extreme temperatures on crop species, highlighting significant challenges to food security and industrial raw material production. At 10°C, all plant species experienced severe disruptions in growth and development, demonstrating their vulnerability to low temperatures. Conversely, at 35°C, the crops exhibited pronounced stress responses. Lettuce showed significant yield and quality reduction, with higher temperatures which may cause a bitter taste [17]. For tomatoes, poor vegetative growth was observed at 35°C which may consequently impose severe negative impacts on flower and fruit set, leading to high rates of flower and fruit abortion [40, 41, 73]. Additionally, industrial hemp and Mexican mint experienced reduced stem girth and compromised growth potential, threatening the availability of raw materials for industrial use.
The emerging challenge of climate change demands a transformative approach in plant breeding where breeding should focus not only maximizing yield but also improving specific quality traits, including phytochemical content. However, there is now a critical need to prioritize climate resilience while minimizing both quantity and quality losses. This involves developing temperature-tolerant crop varieties that can withstand extreme conditions. Key breeding considerations should include developing crops resistant to temperature extremes, preserving bioactive compounds under temperature stress conditions [74]. This study emphasizes the importance of reorienting breeding strategies towards climate adaptability to ensure food security and sustainable agricultural production in an increasingly unpredictable environmental landscape.
Conclusion
The present study shows the diverse responses of important crop species to temperature variations, demonstrating that growth temperatures significantly affected the morphological, physiological, biochemical and antioxidant responses of green lettuce, hemp, mint, red lettuce, and tomato. The extreme temperatures of 10°C and 35°C induced oxidative stress, as evidenced by increased lipid peroxidation and altered antioxidant responses.
The extreme temperatures negatively impact the growth and development of these crops, emphasizing the need for strategies to mitigate the effects of climate change on agriculture. The crop species employed various adaptive strategies, such as the accumulation of osmolytes and antioxidant compounds, to cope with the temperature stress. These findings provide valuable insights into the temperature stress responses of these important crop species and can contribute to the development of strategies for improving their tolerance to temperature extremes.
Author Contributions
Conceptualization, L.A.; formal analysis, R.O., E.B.N, and A.P.K.; funding acquisition, L.A.; investigation, L.A., P.A.O., H.P., A.B., J.R., H.M., K.J., S.S., C.S., S.L., A.P.K. and E.B.N.; methodology, L.A. and P.A.O.; project administration, L.A.; resources, L.A.; supervision, L.A. and P.A.O.; validation, R.O., S.O.N. and L.A.; writing original draft, E.B.N., R.O., P.A.O., S.O.N., S.C. and L.A.; review and editing, L.A. S.O.N. and R.O. All authors have read and agreed to the published version of the manuscript.
Funding
This work was financially supported by Natural Science and Engineering Research Council of Canada Collaborative Research and Development (NSERC CRD) #CRDPJ/532183-2018 and Mitacs. Grant #FR106466.
Institutional Review Board Statement
Not applicable.
Informed Consent Statement
Not applicable.
Data Availability Statement
The data presented in this study are available on request from the corresponding author. The data are not publicly available due to privacy.
Acknowledgments
The lead author wishes to thank Dr. Tudor Borza for his technical support during the experimental set-up. Conflicts of Interest: The authors declare no conflict of interest.
References
-
Chaudhry S, Sidhu GPS (2022) Climate change regulated abiotic stress mechanisms in plants: a comprehensive review. Plant Cell Reports 41: 1-31.
-
Rivero RM, Mittler R, Blumwald E, Zandalinas SI (2022) Developing climate-resilient crops: improving plant tolerance to stress combination. Plant Journal 109(2): 373-389.
-
Grossiord C, Buckley TN, Cernusak LA, Novick KA, Poulter B, et al. (2020) Plant responses to rising vapor pressure deficit. New Phytol 226(6): 1550-1566.
-
Mashwani Z (2020) Environment, Climate Change and Biodiversity. Environment, Climate, Plant and Vegetation Growth, pp: 473-501.
-
Zhu T, Lima CF, De Smet I (2021) The heat is on: How crop growth, development, and yield respond to high temperature. Journal of Experimental Botany 72(21): 7359-7373.
-
Novaes LR, Calixto ES, de Oliveira ML, Alves-de-Lima L, de Almeida O, et al. (2020) Environmental variables drive phenological events of anemocoric plants and enhance diaspore dispersal potential: A new wind-based approach Science of the Total Environment. Sci Total Environ 730: 139039.
-
Bhattacharya A (2022) Effect of Low-Temperature Stress on Germination, Growth, and Phenology of Plants: A Review. Physiological Processes in Plants Under Low Temperature Stress, pp: 1-106.
-
Anderson JT, Song BH (2020) Plant adaptation to climate change—Where are we. J Syst Evol 58(5): 533-545.
-
Lancaster LT, Humphreys AM (2020) Global variation in the thermal tolerances of plants. Proc Natl Acad Sci, USA, 117(24): 13580-13587.
-
Thurman LL, et al. (2020) Persist in place or shift in space? Evaluating the adaptive capacity of species to climate change. Front Ecol Environ 18(9): 520-528.
-
Patriyawaty NR, Rachaputi RCN, George D (2018) Physiological mechanisms underpinning tolerance to high temperature stress during reproductive phase in mungbean (Vigna radiata (L.) Wilczek). Environ Exp Bot 150: 188-197.
-
Janni M, Maestri E, Gulli M, Marmiroli M, Marmiroli N (2023) Plant responses to climate change, how global warming may impact on food security: a critical review. Front Plant Sci 14.
-
Muhammad M, Waheed A, Wahab A, Majeed M, Nazim M, et al. (2024) Soil salinity and drought tolerance: An evaluation of plant growth, productivity, microbial diversity, and amelioration strategies. Plant Stress 11.
-
Hatfield JL, Prueger JH (2015) Temperature extremes: Effect on plant growth and development. Weather Clim Extrem 10: 4-10.
-
Alsamir M, Mahmood T, Trethowan R, Ahmad N (2021) An overview of heat stress in tomato (Solanum lycopersicum L.). Saudi J Biol Sci 28(3): 1654-1663.
-
Mesa T, Polo J, Arabia A, Caselles V, Munné-Bosch S (2022) Differential physiological response to heat and cold stress of tomato plants and its implication on fruit quality. J Plant Physiol 268: 153581.
-
Elias E (2015) Southwest Regional Climate Hub and California Subsidiary Hub Assessment of Climate Change Vulnerability and Adaptation and Mitigation Strategies, pp: 1-76.
-
Lafta A, Sandoya G, Mou B (2021) Genetic variation and genotype by environment interaction for heat tolerance in crisphead lettuce. HortScience 56(2).
-
Chen L, Xu M, Liu C, Hao J, Fan S, et al. (2022) LsMYB15 Regulates Bolting in Leaf Lettuce (Lactuca sativa L.) Under High-Temperature Stress. Front Plant Sci 13: 921021.
-
Noguchi A, Amaki W (2016) Effects of light quality on the growth and essential oil production in Mexican mint. Acta Hortic 1134.
-
Hammami N, Privé JP, Joly DL, Moreau G (2021) Associations between cannabinoids and growth stages of twelve industrial hemp cultivars grown outdoors in Atlantic Canada. Ind Crops Prod 172.
-
Kopec P (2024) Climate Change-The Rise of Climate- Resilient Crops. Plants 13(4): 490.
-
Lee Z, Lim JA, Harikrishna JA, Islam T, Abd Rahim MH, et al. (2024) Regulation of Plant Responses to Temperature Stress: A Key Factor in Food Security and for Mitigating Effects of Climate Change 19: 141-159.
-
Calvin K (2023) IPCC, 2023: Climate Change 2023: Synthesis Report. Contribution of Working Groups I, II and III to the Sixth Assessment Report of the Intergovernmental Panel on Climate Change. IN: Core Writing Team, Lee H, Romero J (Eds.), IPCC, Geneva, Switzerland.
-
Benitez-Alfonso Y (2023) Enhancing climate change resilience in agricultural crops. Current Biology 33(23): R1246-R1261.
-
Schank JC, Koehnle TJ (2009) Pseudoreplication is a Pseudoproblem. J Comp Psychol 123(4): 421-433.
-
Lord Abbey, Rao SA (2017) Differential response of plant species to greenhouse microclimate created by design technology and ambient conditions. Canadian Journal of Plant Science 98(2):300-308.
-
Eb N, Ofoe R, AP K, Abbey L (2024) Plant Growth, Yield, and Biochemical Composition of Solanum macrocarpon and Corchorus olitorius under Varying Temperatures. Open Access Journal of Agricultural 9(1): 1-11.
-
Hodges DM, DeLong JM, Forney CF, Prange RK (1999) Improving the thiobarbituric acid-reactive-substances assay for estimating lipid peroxidation in plant tissues containing anthocyanin and other interfering compounds. Planta 207(4): 604-611.
-
Alexieva V, Sergiev I, Mapelli S, Karanov E (2001) The effect of drought and ultraviolet radiation on growth and stress markers in pea and wheat. Plant Cell Environ 24(12): 1337-1344.
-
Dubois M, Gilles KA, Hamilton JK, Rebers PA, Smith F (1956) Colorimetric Method for Determination of Sugars and Related Substances. Analytical Chemistry 28(3): 350-356.
-
Bradford MM (1976) A rapid and sensitive method for the quantitation of microgram quantities of protein utilizing the principle of protein-dye binding. Anal Biochem 72: 248-254.
-
Chance B, Maehly AC (1955) Assay of catalases and peroxidases. Methods Enzymol 1.
-
Linchtenthaler HK (2023) Chlorophylls and carotenoids: Pigments of photosynthetic biomembranes. Methods in Enzymology 148: 350-382.
-
Ainsworth EA, Gillespie KM (2007) Estimation of total phenolic content and other oxidation substrates in plant tissues using Folin-Ciocalteu reagent. Nat Protoc 2(4): 875-877.
-
Chia-Chi C, Ming-Hua Y, Hwei-Mei W, Jiing-Chuan C (2002) Estimation of Total Flavonoid Content in Propolis by Two Complementary Colorimetric Methods. J Food Drug Anal 10(3): 178-182.
-
Dudonné S, Vitrac X, Coutiére P, Woillez M, Mérillon JM (2009) Comparative study of antioxidant properties and total phenolic content of 30 plant extracts of industrial interest using DPPH, ABTS, FRAP, SOD, and ORAC assays. J Agric Food Chem 57(5): 1768-1774.
-
Luo H, Xu H, Chu C, He F, Fang S (2020) High Temperature can Change Root System Architecture and Intensify Root Interactions of Plant Seedlings. Front Plant Sci 11.
-
Hazra P, Samsul Ansary H, Sikder D, Peter KV (2007) Global Science Books Breeding Tomato (Lycopersicon esculentum Mill.) Resistant to High Temperature Stress. International Journal of Plant Breeding.
-
Adams SR, Cockshull KE, Cave CRJ (2001) Effect of temperature on the growth and development of tomato fruits. Ann Bot 88(5): 869-877.
-
Van Der Ploeg A, Heuvelink E (2005) Influence of sub- optimal temperature on tomato growth and yield: A review. Headley Brothers Ltd pp: 652-659.
-
Geneve RL, Janes EW, Kester ST, Hildebrand DF, Davis D (2022) Temperature Limits for Seed Germination in Industrial Hemp (Cannabis sativa L.). Crops 2(4): 415- 427.
-
Krishnan P, Ramakrishnan B, Reddy KR, Reddy VR (2011) High-Temperature Effects on Rice Growth, Yield, and Grain Quality. Advances in Agronomy 111: 87-206.
-
Raza A, Charagh S, Abbas S, Hassan MU, Saeed F, et al. (2023) Assessment of proline function in higher plants under extreme temperatures. Plant Biology 25(3): 379- 395.
-
Yadav S, Modi P, Dave A, Vijapura A, Patel D, et al. (2020) Effect of Abiotic Stress on Crops. Sustainable Crop Production.
-
Moore CE, Meacham-Hensold K, Lemonnier P, Slattery RA, Benjamin C, et al. (2021) The effect of increasing temperature on crop photosynthesis: From enzymes to ecosystems. J Exp Bot 72(8): 2822-2844.
-
Zahra N, Bilal Hafeez M , Ghaffar A, Kausar A, Al Zeidi M, et al. (2023) Plant photosynthesis under heat stress: Effects and management. Environmental and Experimental Botany 206: 105178.
-
Jumrani K, Bhatia VS, Kataria S, Rastogi A (2023) The interactive effect of high temperature and water deficit stress on nitrogen fixation, photosynthesis, chlorophyll fluorescence, seed yield and quality in soybean (Glycine max). Plant Physiology Reports 29: 125-140.
-
Hikosaka K, Ishikawa K, Borjigidai A, Muller O, Onoda Y (2006) Temperature acclimation of photosynthesis: Mechanisms involved in the changes in temperature dependence of photosynthetic rate. Journal of Experimental Botany 57(2): 291-302.
-
Ihtisham M, Hasanuzzaman M, El-Sappah AH, Zaman F, Khan N, et al. (2023) Primary plant nutrients modulate the reactive oxygen species metabolism and mitigate the impact of cold stress in overseeded perennial ryegrass. Front Plant Sci 14.
-
Wang Y, Jiang Q, Wang X, Xi Z (2023) Brassinosteroid Stimulates Hydrogen Peroxide Biosynthesis and Reduces the Effect of Cold Stress. J Plant Growth Regul 42(6): 3757-3769.
-
Das K, A Roychoudhury (2014) Reactive oxygen species (ROS) and response of antioxidants as ROS-scavengers during environmental stress in plants. Front Environ Sci 2: 53.
-
Huang H, Ullah F, Zhou DX, Yi M, Zhao Y (2019) Mechanisms of ROS regulation of plant development and stress responses. Front Plant Sci 10: 800.
-
Zhou H, Ashworth K, Dodd IC (2023) Exogenous monoterpenes mitigate H2O2-induced lipid damage but do not attenuate photosynthetic decline during water deficit in tomato J Exp Bot 74(17): 5327–5340.
-
Hong E, Xia X, Ji W, Li T, Xu X, et al. (2023) Effects of High Temperature Stress on the Physiological and Biochemical Characteristics of Paeonia ostii. Int J Mol Sci 24(13): 11180.
-
Bilal S, Khan T, Asaf S, Khan NA, Jan SS, et al. (2023) Silicon-Induced Morphological, Biochemical and Molecular Regulation in Phoenix dactylifera L. under Low-Temperature Stress. Int J Mol Sci 24(7): 6036.
-
Pandey A, Masthigowda MH, Kumar R, Pandey GC, Awaji SM, et al. (2023) Physio-biochemical characterization of wheat genotypes under temperature stress. Physiology and Molecular Biology of Plants 29: 131-143.
-
Salam U, Ullah S, Tang ZH, Elateeq AA, Khan Y, et al. (2023) Plant Metabolomics: An Overview of the Role of Primary and Secondary Metabolites against Different Environmental Stress Factors. 13(3): 706.
-
Cunha ETD, Pedrolo AM, Arisi ACM (2023) Effects of sublethal stress application on the survival of bacterial inoculants: a systematic review. Arch Microbiol 205(5): 190.
-
Sihag P, Kumar U, Sagwal V, Kapoor P, Singh Y, et al. (2023) Effect of terminal heat stress on osmolyte accumulation and gene expression during grain filling in bread wheat (Triticum aestivum L.)Plant Genome 17(1): e20307.
-
Elkelish A, Qari SH, Mazrou YSA, Abdelaal KAA, Hafez YM, et al. (2020) Exogenous ascorbic acid induced chilling tolerance in tomato plants through modulating metabolism, osmolytes, antioxidants, and transcriptional regulation of catalase and heat shock proteins. Plants 9(4): 431.
-
Hasanuzzaman M, Nahar K, Alam MM, Roychowdhury R, Fujita M (2013) Physiological, biochemical, and molecular mechanisms of heat stress tolerance in plants. Int J Mol Sci 4(5): 9643-9684.
-
Al-Huqail A, El-Dakak RM, Sanad MNME, Badr RH, Ibrahim MM, et al. (2020) Corrigendum to Effects of climate temperature and water stress on plant growth and accumulation of antioxidant compounds in Sweet Basil (Ocimum basilicum L.) leafy vegetable. Scientifica 1: 9362517.
-
Pistelli L, Tonelli M, Pellegrini E, Cotrozzi L, Pucciariello C, et al. (2019) Accumulation of rosmarinic acid and behaviour of ROS processing systems in Melissa officinalis L. under heat stress. Ind Crops Prod 138: 111469.
-
Alhaithloul HAS, Galal FH, Seufi AEM (2021) Effect of extreme temperature changes on phenolic, flavonoid contents and antioxidant activity of tomato seedlings (Solanum lycopersicum L.). PeerJ 9: e11193.
-
Kaur A, Kaur M, Tak Y (2024) Insights into Biotic Stress Management by Plants Using Phenolic Compounds. Plant Phenolics in Biotic Stress Management pp: 75-93.
-
Hasanuzzaman M, Bhuyan MHMB, Zulfiqar F, Raza A, Mohsin SM, et al. (2020) Reactive oxygen species and antioxidant defense in plants under abiotic stress: Revisiting the crucial role of a universal defense regulator. Antioxidants 9(8): 681.
-
Gholamnia A, Arani AM, Sodaeizadeh H, Esfahani ST, Ghasemi S, et al. (2022) Expression profiling of rosmarinic acid biosynthetic genes and some physiological responses from Mentha piperita L. under salinity and heat stress. Physiology and Molecular Biology of Plants 28(3): 545-557.
-
Kim SE, Lee CJ, Park SU, Lim YH, Park WS, et al. (2021) Overexpression of the golden snp-carrying orange gene enhances carotenoid accumulation and heat stress tolerance in sweetpotato plants. Antioxidants 10(1): 51.
-
Younis AA, Khattab H, Emam MM (2020) Impacts of silicon and silicon nanoparticles on leaf ultrastructure and tapip1 and tanip2 gene expressions in heat stressed wheat seedlings. Biol Plant 64: 343-352.
-
Hassan MU, Chattha MU, Khan I, Chattha MB, Barbanti L, et al. (2021) Heat stress in cultivated plants: nature, impact, mechanisms, and mitigation strategies—a review. Plant Biosystems 155(2): 211-234.
-
Chua IYP, King PJH, Ong KH, Sarbini SR, Yiu PH, et al. (2015) Influence of light intensity and temperature on antioxidant activity in Premna serratifolia L. J Soil Sci Plant Nutr 15: 3.
-
Hazra P, Samsul HA, Sikder D, Peter KV (2007) Breeding tomato (Lycopersicon esculentum Mill) resistant to high temperature stress. International Journal of Plant Breeding 1: 31-40.
-
Ghate U, Kulkarni H (2023) Spices, Unpacked Diet, Bio Actives and Immunity: Indian Health & Pandemic. European Journal of Science, Innovation and Technology 3(3): 1-20.
- Enhancement of Vegetative Growth and Fruit Yield in Cucumber (Cucumis sativus L.) via Spiritual Blessing (Biofield) Energy Intervention
- Production of Açaí (Euterpe oleracea Mart.) under Different Agroforestry System Management Intensities in Amazonian Floodplain (Varzea) Forests
- Coffee and the Production Region: What is the Secret to the Expression "Quality"?
- Experiential Agripreneurship Training in Sub-Saharan Africa: Integrating a Business Incubator into Postgraduate Livestock Education at the University of Buea
- Advances in Agricultural High-Quality Development
- Linking Compost Residue to ABAGE in Plants - a Short Note