Effect of Activin A, Follistatin and Fibrillin-3 Hormones on Pregnancy Rate in IVF Programs
Objectives: The aims of this study were to measure the levels of Activin-A, Follistatin, and Fibrillin-3 hormones at different phases of the menstrual cycle in a controlled ovarian stimulation program and to elucidate the correlation between the levels of these hormones and the pregnancy rate (PR) following intra cytoplasmic sperm injection (ICSI) cycle. Patients, Materials and Methods: Two hundred women undergoing ICSI treatment were chosen randomly. Controlled ovarian stimulation was done with two different protocols, measurements of Activin-A, Follistatin and Fibrillin-3 were performed in different phases of the menstrual cycle in serum and in follicular fluid. Results: There was a significant correlation between Activin-A hormone level in the late luteal phases of the ICSI cycle and the PR with a predictive cut-off value of 18.675 pg/ml (0.735,0.833) for women on short GnRH-antagonist (GnRHant) protocol and 22.530 pg/ml (0.483,0.900) for women using the long GnRH-agonist (GnRH-a) protocol in the late luteal phase. There was a significant difference in early-phase Follistatin hormone level between pregnant and nonpregnant women in the long protocol, as well as a significant difference of the mid-phase hormone level in the short protocol (P
Introduction
Assisted reproduction is a complicated process involving multiple stages like ovarian stimulation, ovum pick up, then fertilization of these oocytes, embryo cleavage and implantation. The ultimate goal of all these procedures is to get a viable intrauterine pregnancy as a step to get a healthy baby [1]. However, the mechanisms that control the cyclic recruitment, selection and dominance of ovarian follicles are not fully understood but there is strong evidence that intra-ovarian factors play a key role in modulating the sensitivity of follicular cells to gonadotropins and other systemic factors. There are numerous locally produced factors implicated in this process such as insulin-like growth factors [2] and various members of the transforming growth factor beta (TGF-B) superfamily including Inhibins, Activins, and Follistatin [3]. The maturing follicle has both somatic cell components (cumulus and mural granulosa cells) and the germ cell component, the oocyte [4]. It is separated by a basement membrane from other structures in the ovary. There is a coordination of development between the somatic cells and the oocyte during follicular developments [3]. This regulation and coordination involves endocrine, as well as autocrine and paracrine signaling within the specialized micro-environment of the ovarian follicle [5]. Therefore the follicular fluid (FF) acts as a medium by which signaling mediators are transported in and out of the follicle, also within the follicle between various cell types [6]. It is a reasonable thinking that some biochemical characteristics of the FF may play an important role for determining oocyte quality and the subsequent capability to achieve fertilization and pregnancy [7]. Activin A and Follistatin are glycoprotein hormones of the TGF-B family. They are found in the gonads and several other tissue, regulate pituitary gonadotropin secretion [8]. Activin increases FSH secretion while Follistatin which is an Activin-binding protein, neutralizes Activin bioactivity, thus inhibiting FSH secretion by blocking Activin bioactivity. They exert their function through local autocrine and paracrine effects on granulosa cells activating specific receptors [9].
Fibrillin-3 is a glycoprotein located mainly in the brain, but also in the gonads [10]. The significant role of fibrillins has recently emerged in the control of growth factor signaling, fibrillins regulate TGF-B bioactivity in tissues by binding latent TGF-B binding proteins [11]. Two studies are published regarding the role of Activin and Follistatin hormones [12] and Fibrillin-3 hormone on IUI outcome [13]. However, in our knowledge there are no studies concerned on the relation of these three hormones on IVF programs. Therefore, the goal of the current work is to found out the role of these fertility growth factors on the intra-cytoplasmic sperm injection outcome.
Materials and Methods
A prospective study involving two hundred infertile females selected was performed in the Consultant Clinic in Kamal Al-Samaria IVF Center in Baghdad-Iraq and AZ Jan Palfijn IVF Center in Ghent-Belgium through the period from August 2014 to July 2015. The women’s age ranged between 20-45 years. The body mass index (BMI) was recorded. Exclusion criteria were patients with elevated FSH levels, polycystic ovary syndrome (PCOS), and severe endocrinological pathology such as elevated prolactin, thyroid dysfunction, diabetes and patients on OCP treatment before starting the program .Patients with unexplained infertility were all had normal laparoscopy findings. Hydrosalpinges were removed or the tube clamped before starting the program. Two protocols were used to control ovarian hyper- stimulation: The long protocol GnRH-a treatment was initiated in the mid-luteal phase (day 21) of the preceding cycle by the administration of GnRH-agonists then 14 days later gonadotropins injections were started. In the second group of patients a short GnRH-ant protocol using either the fixed protocol, in which the antagonist was administered daily from stimulation day 6 or 7 onwards, or the flexible protocol in which GnRH-antagonist injections were started as soon as the follicles reached a size of more than 14, 15 or 16 mm in diameter. Triggering final oocyte maturation was realized by the administration of Ovitrelle® (Merck Serono -USP) 6500- 13000 IU or Pregnyl® (Merck Serono Company USP) 5.000–10.000 IU given 30-40 hours after the last FSH or HMG injection to minimize the risk of ovarian hyperstimulation syndrome .Triggering of ovulation was cancelled if the following criteria had not been met: at least 3 follicles greater than 17 mm in diameter were present with 17ß estradiol levels of at least 3500 pmol/L (920 picogram/ml)[14]. After triggering oocyte maturation, oocyte retrieval was carried out 34-36 hours later. Oocytes were harvested by needle aspiration through the posterior fornix with TVU guidance. There was a standardization of the procedure in both centers and there were no flushing of the follicles in the cases that were taken. Fresh semen was collected at time of oocyte pick up by masturbation, sperm aspiration from the testes by FNA or from testicular biopsy as described [15].
The procedure of ICSI was performed 3-5h after oocyte aspiration by choosing mature MII oocytes [16]. Embryo transfer was performed on day 2 or 3 of embryonic development and rarely on blastocyst stage with or without assisted hatching. Maximum two or three embryos were transferred depending on the legislations of country, recommendation of the couple and the quality of the embryos. The number of the transferred embryos was nearly the same in both centers. Support of the luteal phase was performed by injecting 1500 IU hCG immediately after oocyte retrieval and again seven days later in those patients that were not at risk of ovarian hyper stimulation syndrome (OHSS). In addition vaginal administration of 200 mg of micronized progesterone, three times a day, was started in the evening after oocyte pick up [17]. For each patient, measurement of serum Activin A (pg/ml), Follistatin (ng/ml) and Fibrillin-3 (ng/ml), was done on cycle day (CD) 2-3; at the day of ovum pickup; and 14 days after embryo transfer (ET). Also the concentrations of these hormones were determined in FF after ovum pick up. The levels of these hormones were measured using quantitative sandwich enzyme immunoassay technique. hCG production, as our evaluation of an establishing pregnancy of all the patients was measured and recorded after 14 days of embryo transfer. The pregnancy rate was reported per embryo transfer and was calculated on the persistently elevated B.hCG titer. Data were analyzed using R project for statistical computing version 3.2.1 with R Studio interface. Numeric variables were expressed as mean±SE whereas nominal variables were expressed as numbers and percentages. Comparison of variables was done using Fisher exact test and two sample t-test with Satterthwaite approximation of the degrees of freedom which allows separates variance estimations per group. Receiver Operating Characteristic (ROC) curve analysis was done to calculate the cutoff values of numeric variables. The non- parametric Spearman rank correlation coefficient is calculated for each combination of a hormone level (mid- cycle in serum or follicular fluid) and pregnancy rate. The level of significance was p value < 0.05 [18].
Results
(Table 1) shows the age distribution of all studied groups. There was no significant statistical difference (p = 0.572) between the mean age of pregnant (31.5 ±0.82) and non-pregnant (31.0 ±0.49) women included in the current work.
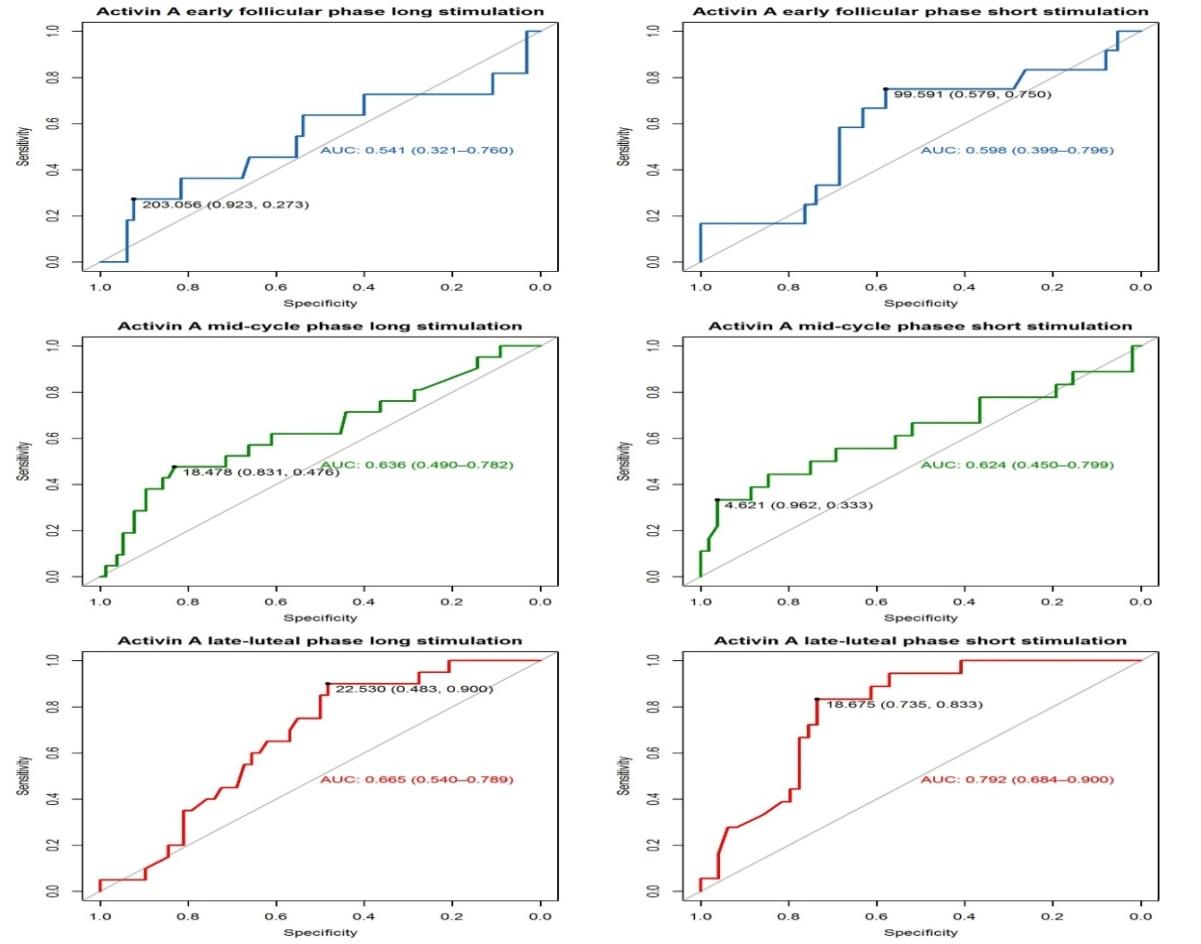
Table I also displays the number and percentage of women with primary infertility being 25 (62.5%) and the number of women with secondary infertility was 75 (37.5%). The pregnancy rate was 18.4% for primary infertility and 26.6 % for secondary infertility. The association between infertility (primary or secondary) and pregnancy was tested with a Fisher exact test. There was no statistically significant association between primary versus secondary infertility and pregnancy after IVF program, the OR=1.609 (0.765, 3.370), p= 0.213. The mean of BMI in the pregnant women was 27.2 ±0.52 and in the non-pregnant was 27.4 ±0.294. There was no significant statistical difference between the BMI of the women and the pregnancy rate in this study (p= 0.762) as shown in (Table 1). Two types of COS protocols were used: the long GnRH- a used for 114 patients (57%) resulted in a PR of 21.1%. The second protocol was the short GnRH-ant protocol, used for 86 patients (43%) with a PR of 22.1%. There was no statistically significant association between stimulation protocol and pregnancy in this study, and the long and the short protocol resulted in very similar pregnancy frequencies (long: 21.1%, short: 22.1%) as shown in (Table 1). In (Table 2) the Activin-A hormone levels in the serum are displayed at different phases of the ICSI cycle. For women being stimulated according to the long GnRH- agonist protocol, the Activin-A hormone level of the pregnant group on cycle day2-3 was 93.86±31.48 pg/ml, decreasing to 21.25±4.48 pg/ml in the mid-cycle phase with more reduction in the late luteal phase to reach 12.4 ±2.49 pg/ml. In the pregnant group stimulated according to the short GnRH-antagonist protocol, Activin-A levels on CD 2-3 was 159.3±34.27 pg/ml, then in mid-cycle it reduced to 32.99±11.38 pg/ml, and it reduced further to 12.91±2.78 pg/ml in the late luteal-phase. During the early follicular stage there was no significant difference in Activin-A levels between pregnant and non-pregnant women in neither of the two stimulation groups (P=0.453 in long and P= 0.395 in the short protocols) as can be seen in table II. In the middle of the cycle phase, there was a borderline significant difference in the long stimulation group, with the pregnant women having higher Activin-A levels compared to the non-pregnant. At the late-luteal phase there was a significant difference in both stimulations protocols (p=0.001 for both). The Activin-A level was higher in the non-pregnant compared to the pregnant. The difference in late-luteal phase Activin-A between pregnant and non- pregnant was most pronounced in the short stimulation group. In this exploratory analysis (Figure 1) using the ROC curve there was an indication that late-luteal phase Activin-A might be a good predictor of pregnancy in both stimulation protocols whereas no significant differences were recorded in the other phases. The AUCs in the short stimulation was 0.792 and in the long stimulation was 0.665. The cut-off value for the short protocol was 18.675 pg/ml, however, has a high sensitivity of 90% but on a low specificity (or true negative rate) of 48.3%. Using this cut-off would thus result in predicting to often that a women is pregnant while she is not. In the long stimulation the cut-off value was 22.53pg/ml, has both a high sensitivity and specificity, indicating this is potentially a reliable predictor. In the t-test comparing the mean hormone levels (Table 2) the most significant differences were observed for the activin at late-luteal phase. Thus the AUC and t-test results are consistent.
Type of Infertility
Age of female (Y)
$$ 3 1. 0 \pm 0. 4 9 \quad 3 1. 5 \pm 0. 8 2 \quad 3 1. 1 \pm 0. 4 2 $$
p = 0.572 $$ \mathrm {B M I} \left(\mathrm {k g} / \mathrm {m} ^ {2}\right) \quad 2 7. 4 \pm 0. 2 9 4 \quad 2 7. 2 \pm 0. 5 2 \quad 2 7. 4 \pm 0. 2 6 \quad \mathrm {p} = 0. 7 6 2 $$ Ovarian Long 90/114 (78.9%)
24/114 (21.1%) $$ \text{Stimulation Short} \quad 67/86 (77.9\%) \quad 19/86 (22.10\%) \quad p=0.864 $$ Total N&PR 157 43(21.5%) 200 Variable Non-Pregnant Pregnant All subjects Statistical Comparison Status N°1(%) 102 (51%) 23 (11.5%) 125 (62.5%) OR=1.609 (0.765, 3.370), p=
0.213 N°2 (%) 55 (27.5%) 20 (10%) 75 (37.5%)
OR=1.063 (0.506, 2.213),
| Ovulation induction program | Pregnancy Status | Early-Follicular phase | Mid-Cycle phase | Late Luteal phase |
| Long GnRH agonist | Non-pregnant | 67.99±11.07 | 11.99±1.72 | 25.85±3.1 |
| Long GnRH agonist | Pregnant | 93.86±31.48 | 21.25±4.48 | 12.4±2.49 |
| Long GnRH agonist | P-value | 0.453 | 0.065 | 0.001 |
| Short GnRH antagonist | Non-pregnant | 125.88±17.04 | 39.5±6.54 | 61.3±10.34 |
| Short GnRH antagonist | Pregnant | 159.3±34.27 | 32.99±11.38 | 12.91±2.78 |
| Short GnRH antagonist | P-value | 0.395 | 0.624 | 0.001 |
Table 1: Activin-A hormone level in the serum at different phases of the ICSI cycle of the studied groups in relation to Table 2:
The serum concentrations of Follistatin hormone at different phases of the IVF cycle were shown in (Table 3). In women using the long GnRH-a protocol, CD2-3 level was 0.76 ±0.18 ng/ml for those who got pregnancy then it reached 0.67 ±0.15 ng/ml in mid-cycle and then increased in the late-luteal phase to 1.09 ±0.2 ng/ml. On the other hand, women who failed to get pregnant the Follistatin level on CD2-3 was 0.48 ±0.05 ng/ml, then increased in the mid-cycle to 0.72 ±0.07ng/ml and reduced to 0.55 ±0.05 ng/ml in the late-luteal phase. For the pregnant women who used the short GnRH- protocol, Follistatin level on CD2-3 was 0.31 ±0.07 ng/ml then elevated to 0.44 ±0.08 ng/ml in the day of ovum retrieval and increased even more in the luteal phase to reach 1.24 ±0.48 ng/ml. In the group of non-pregnant women using the same protocol, the hormone level on CD2-3 was 0.54 ±0.09 ng/ml and increased to the level 0.79 ±0.09 ng/ml in the mid-cycle phase. However it reduced in the late-luteal phase reaching 0.53±0.06 ng/ml as shown in (Table 3).
Ovulatio
Early- Follicul
n inductio Pregnan
Mid- Cycle phase
Late Luteal
cy Status
ar phase n program Phase
Non- pregnant
0.48 ±0.05
0.72±0.0
0.55±0.0
8 P-value 0.042 0.004 0.164 Table 3: Follistatin hormone level in serum at different phases of the ICSI cycle of the studied group in relation to the type of ovarian stimulation protocol.
st
There was a significant difference in early-phase Follistatin level between pregnant and non-pregnant women in the short protocol (P= 0.042), with non- pregnant women having higher levels. During the mid- cycle phase there was a statistical difference between the Follistatin level of pregnant and non-pregnant women in the short protocol (P=0.004), with non-pregnant women having higher levels. On the contrary, there was no statistically significant difference in the mid-cycle analysis of Follistatin in patients being stimulated according to the long protocol. During the late-luteal phase no statistically significant difference was observed in either of the two stimulation groups. (Figure 2) revealed that the overall the AUC of Follistatin were around 0.6 which indicates that there is a relatively low predictive value of the hormone to predict pregnancy at different phases of menstrual cycle.
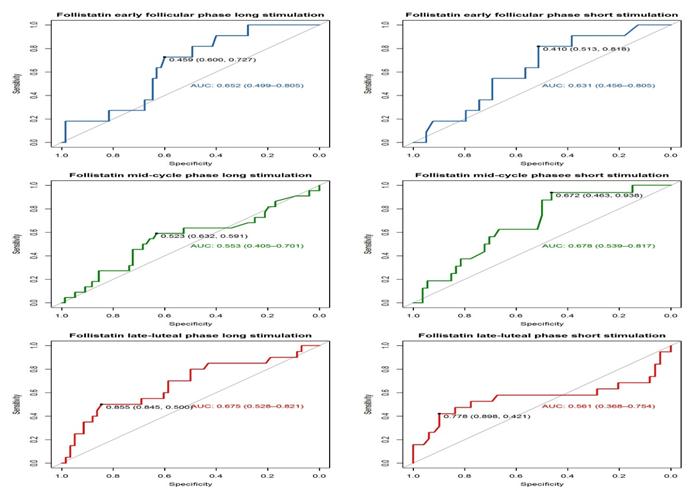
Figure 2: ROC curve of the Follistatin hormone levels as predictors for pregnancy (at different menstrual phases). The AUC together with the 95%confidence interval is provided. The most optimal cut-off for positivity (predicted pregnancy) is shown tighter with the specificity and sensitivity for this point in the ROC. (Table 4) also illustrates the concentration of Fibrillin- 3 hormone measured in different three phases of the ICSI cycle. For patients that were using long GnRH-agonist protocol, Fibrillin-3 concentration on CD2-3 in the pregnant group was 0.83 ±0.18 ng/ml then reduced in the mid-cycle to 0.49 ±0.06 ng/ml, and then increased in the late-luteal phase reaching to 0.86 ±0.13 ng/ml. For these patients, on the same stimulation protocol, that turned out not to be pregnant, the level of Fibrillin-3 at CD2-3 was 0.64 ±0.07 ng/ml, and at mid-cycle 0.59 ±0.05 ng/ml whereas at late luteal phase was 0.64 ±0.05 ng/ml. The same results was observed in the short GnRH-ant protocol Thus, no statistical significant (P>0.05) difference was observed in the Fibrillin-3 levels for any combination of stimulation protocol and cycle phase.
| Pregnancy Status | Early-Follicular phase | Mid-Cycle phase | Late Luteal phase | |
|---|---|---|---|---|
| Long GnRH agonist | Non-pregnant | 0.64±0.07 | 0.59 ±0.05 | 0.64±0.05 |
| Long GnRH agonist | Pregnant | 0.83±0.18 | 0.49±0.06 | 0.86±0.13 |
| Long GnRH agonist | P-value | 0.34 | 0.219 | 0.142 |
| Short GnRH antagonist | Non-pregnant | 0.87±0.08 | 0.57±0.05 | 0.74±0.08 |
| Short GnRH antagonist | Pregnant | 1.65±0.7 | 0.7 ±0.11 | 0.89±0.18 |
| Short GnRH antagonist | P-value | 0.297 | 0.29 | 0.445 |
Table 2: Follistatin hormone level in serum at different phases of the ICSI cycle of the studied group in relation to the type of
(Figure 3) revealed that the AUC values for Fibrillin-3 are maximum 0.6, indicating that this hormone has little predictive use for the pregnancy prediction. This corresponds to the results of the t-test (table 3) where no significant differences were observed.
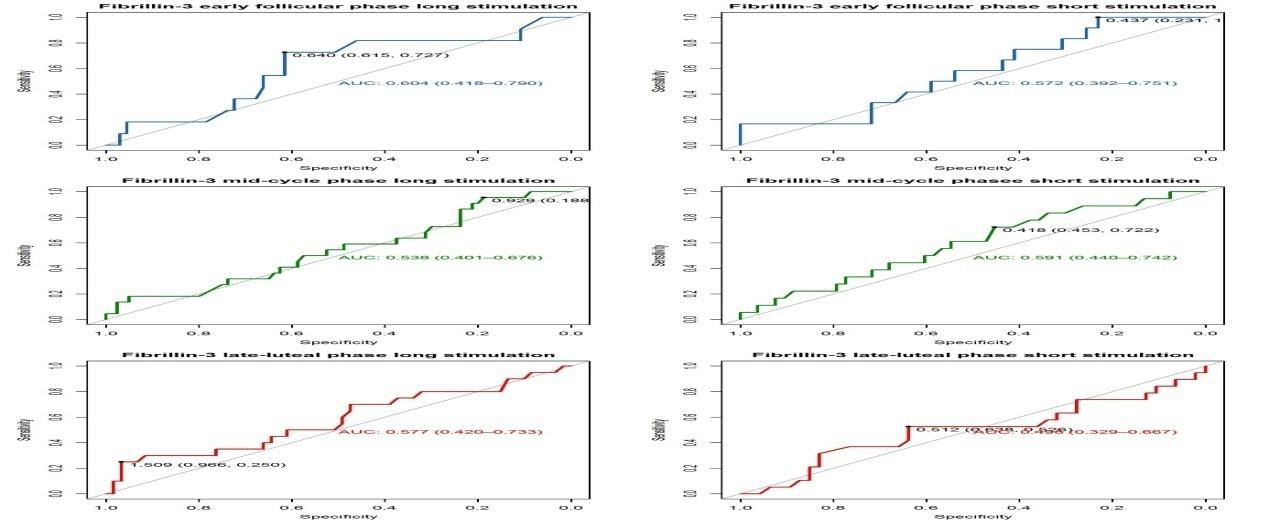
Figure 3: ROC curve of the Fibrillin-3 hormone levels as predictors for pregnancy (at different menstrual phases). The AUC together with the 95%confidence interval is provided. The most optimal cut-off for positivity (predicted pregnancy) is shown tighter with the specificity and sensitivity for this point in the ROC. In (Table 5) the Spearman rank correlation was provided between the mid-cycle phase and the follicular fluid hormone levels provided per combination of stimulation and pregnancy status. In the correlation there seems to be two emerging patterns in the correlation of a hormone in the serum (mid-cycle) and the same hormone in the follicular fluid. For both Activin-A and Fibrilin-3, there is a high correlation within the pregnant subject and/or a very low correlation in the non-pregnant subjects, independent of the stimulation. A different pattern was observed for Follistatin when the stimulation pattern does affect the correlation between serum and follicular fluid levels, regardless of the pregnancy status. The Follistatin levels have a relatively high correlation of around 0.67 in the long stimulation and a low correlation of around 0.3 in the short stimulation subjects.
| Stimulation | Pregnancy status | Hormone | Activin A follicular fluid | Fibrillin follicular fluid | Follistatin follicular fluid |
|---|---|---|---|---|---|
| Long GnRH agonist | Pregnant | Mid-cycle Activin-A | 0.8 | 0.47 | -0.45 |
| Long GnRH agonist | Pregnant | Mid-cycle Fibrillin-3 | -0.26 | -0.6 | 0.48 |
| Long GnRH agonist | Pregnant | Mid-cycle Follistatin | -0.3 | -0.73 | 0.67 |
| Long GnRH agonist | Non-pregnant | Mid-cycle Activin-A | 0.15 | 0.37 | -0.33 |
| Long GnRH agonist | Non-pregnant | Mid-cycle Fibrillin-3 | -0.14 | -0.04 | 0 |
| Long GnRH agonist | Non-pregnant | Mid-cycle Follistatin | -0.23 | -0.5 | 0.68 |
| Short GnRH antagonist | Pregnant | Mid-cycle Activin-A | 0.76 | 0.41 | -0.69 |
| Short GnRH antagonist | Pregnant | Mid-cycle Fibrillin-3 | 0.35 | 0.5 | -0.41 |
| Short GnRH antagonist | Pregnant | Mid-cycle Follistatin | -0.16 | -0.04 | 0.3 |
| Short GnRH antagonist | Non-pregnant | Mid-cycle Activin-A | 0.5 | 0 | -0.5 |
| Short GnRH antagonist | Non-pregnant | Mid-cycle Fibrillin-3 | 0.29 | -0.09 | -0.23 |
| Short GnRH antagonist | Non-pregnant | Mid-cycle Follistatin | -0.2 | 0.07 | 0.27 |
Table 3: Fibrillin-3 hormone level in the serum at different phases of the ICSI cycle of the studied groups in relation to the Ta
Discussion
The current study found no statistical significant difference in pregnancy rates between women who were subjected for the long GnRH-agonist and the short GnRH- antagonist IVF stimulation protocol (OR=1.063 (0.506, 2.213), p=0.864). The same findings were reported by Lai et al. [19] who failed to detect a significant difference between the two protocols regarding the difference in duration of ovarian stimulation, number of recombinant FSH ampoules used, number of oocytes retrieved, serum levels for estradiol and progesterone and thickness of endometrium. The overall pregnancy rate for all patients of the study was 21.5%, in the IVF Center of the Jan Palfijn Hospital the pregnancy rate was 40%, whereas in the study group in Kamal Al-Samarei IVF center it was only 19.4%. This difference between the two centers may be related to the environmental condition such as the level of air pollution which is higher in Iraq than in Belgium, the type of ovulation stimulation drugs (in Belgium IVF Center the gynecologist prefers the long acting FSH injection) or due to the low number of male infertility factor in the Jan Palfijn Hospital center. The data of the study showed that the level of Activin-A hormone in both stimulation protocols was reduced in mid-cycle phase. This finding may be due to the supra- physiological levels of FSH in the ovarian stimulated cycle because Activin-A is negatively affected by FSH [20]and to the high level of E2, suppressing the mRNA level of ßB subunit but did not alter the mRNA expression of inhibin- α and Follistatin [20]. Then in the late-luteal phase of the increment in this hormone reaching a mean of 255.42 ng/ml (unpublished data). This observation might be the result of the fact that Activins are potential factors for maternal-embryo interactions, due to their role in regulating cell proliferation, differentiation and apoptosis, and their abundant expression and actions in remodeling tissues, embryogenesis and organogenesis [24]. Therefore during pregnancy, the placenta is a major source of serum Activin-A, which increases as the pregnancy progresses. However ,recently It has been noticed a significant relationship between Activin-A level and pregnancy at late-luteal phase following IUI, but there was a progressive increment in the hormone level throughout the phases of the non-IVF cycle if pregnancy occurred, reaching its peak at day 28 of the cycle [12]. In evaluating pregnancies a further increase in Active-A level took place as is also corroborated by the findings of [25]. However another study [26] showed that Activin-A did not change with FSH stimulation, whereas inhibin B showed insignificant raise. The statistical analysis of our data revealed that the AUC of Follistatin were around 0.6 which indicates there was a relatively low predictive value of the hormone to predict pregnancy at different phases of the menstrual cycle. The levels of Follistatin during the IVF cycle goes in an opposite direction to Activin-A. This is obvious since most circulating Follistatin binds to Activin with a high affinity and irreversibly thereby it neutralizing Activin activity [ 5,12,21]. The study postulates that Follistatin level may increase during the IVF cycle as it was well established that fast - frequency GnRH pulses stimulate the expression of pituitary Follistatin, and that increased level of Follistatin down regulate FSH secretion. Follistatin and Activin-A exert their effect on FSH secretion through a paracrine mechanism in the pituitary gland besides the local action in the ovary [27]. The current work revealed no statistical significant difference in the Fibrillin-3 levels in any combination of stimulation protocol and cycle phase, indicating that this hormone has little or no predictive use for the pregnancy prediction. It has been reported that the peak of E2 was associated with the peak of Fibrillin-3 level at cycle day 13 of non-IVF cycle, and postulated that mean FBN-3 hormone may interfere with positive feedback of E2 to elevated FSH and LH levels [13]. This controversy may be due to pituitary suppression and high levels of FSH in the IVF cycle or may be due to an unknown autocrine- paracrine mechanism. It was postulated that FSH may be responsible for Fibrillin-3 biosynthesis in the ovaries.
Conclusions
The present study concluded that the levels of Activin- A in follicular fluid and serum proved to be predictive for final pregnancy outcome. Follistatin has a significant difference in early-phase between pregnant and non- pregnant women in the short protocol .Fibrillin-3 level gave no indication on implantation chances neither in its absolute value at any time during the IVF cycle of any stimulation protocol nor in its evolution over time.
Acknowledgments
Thanks to Professor Dr. Nabeel Sahib Abdel-Kadhim the president of Al-Nahrain University for his financial support. A special contribution has been made by Mrs. Lieve Declercq and Mrs. Caroline Van de steene, who did the lay-out of the paper.
References
-
VM Allen, RD Wilson, A Cheung (2006) Pregnancy outcomes after assisted reproductive technology. J Obst Gynaecol Can 28(3): 220-250.
-
JK Fortune, GM Rivera, MY Yang (2004) Follicular development: the role of the follicular microenvironment in selection of the dominant follicle. Animal Reprod Sc 82-83: 109-126.
-
Shimasaki S, Moore RK, Otsuka F, Erickson GF (2004) The bone morphogenetic protein system in mammalian reproduction. Endocrine Review 25(1): 72-101. [INLINE_TABLE:8:0]
-
S Muttukrishna, W Ledger (2001) Inhibin, activin, and follistatin in human reproductive physiology. Endocrine, autocrine and paracrine actions of inhibin, activin and follistatin on follicle stimulating hormone. Imperial. College press, London, UK, pp. 3:72.
-
RJ Rodgers, HF Irving-Rodgers (2010) Formation of the ovarian follicular antrum and follicular fluid. Biol Reprod 82(6): 1021-1029.
-
Leroy JL, Vanholder T, Delanghe JR, Opsomer G, Van Soom A, et al. (2004) Metabolic changes in follicular fluid of the dominant follicle in high-yielding dairy cows early post partum. Theriogenology 62(6): 1131- 1143.
-
P Florio (2010) Activins and related proteins in the establishment of pregnancy. J Reprod Sc 17(4): 320- 330.
-
DM de Kretser, A Meinhardt, T Meehan, et al. (2001) The roles of inhibin and related peptides in gonadal function. Mol Cell Endocrinol 161(1-2): 43-46.
-
F Ramirez, LY Sakai (2010) Biogenesis and function of fibrillin assemblies. Cell Tissue Res 339(1): 71-82.
-
C Jordan CD1, Bohling SD, Charbonneau NL, Sakai LY (2010) Fibrillins in adult human ovary and polycystic ovary syndrome: Is Fibrillin-3 affected in PCOS? J Histochem Cytochem 58(10): 903-915.
-
SS Al-Dujaily, NS Alwan (2013) Relationship between in vivo concentrations of Activin-A, follistatin and antimullerian Ovarian Hormones with pregnancy Rate following Intrauterine. IJEIR 3(6): 9-14.
-
SS Al-Dujaily, W Mohammed (2014) Role of fibrillin-3 in fertilization capacity in women undergoing intrauterine insemination. IJEIR 6(2): 34-39.
-
Morley L, Tang T, Yasmin E, Hamzeh R, Rutherford AJ, et al. (2012) Timing of human chorionic gonadotrophin hormone administration in IVF protocols: a randomized control trail. Hum Fertil 15(3): 134-139.
-
DK Gardner, M Lane, AJ Watson (2004) A laboratory guide to the mammalian embryo. Oxford University Press, New York, pp. 76-85.
-
AK Brooks, VM Jeffery, JD Christopher (2000) Handbook of assisted reproduction laboratory. Micromanipulation of Human Gametes, Zygots and Embryos (2nd edn) CRC Press, pp. 223-227.
-
Fatemi HM, Polyzos NP, van Vaerenbergh I, Bourgain C, Blockeel C, et al. (2013) Early luteal phase endocrine profile is affected by the mode of triggering final oocyte maturation and the luteal phase support used in recombinant follicle-stimulating hormone- gonadotropin-releasing hormone antagonist _in vitro_ fertilization cycles. Fertil Steril 100(3): 742-747.
-
T Glo, K Mitchel (2008) Introduction to Biostatistic (2nd edn) Waveland press. USA, p. 4.
-
Q Lai, H Zhang, G Zhu (2013) Comparison of the GnRH agonist and antagonist protocol on the same patients in assisted reproduction during controlled ovarian stimulation cycles. Int J Clin Exp Pathol 6(9): 1903- 1910.
-
Popovics P, Rekasi Z, Stewart AJ, Kovacs M (2011) Regulation of pituitary inhibin/activin subunits and follistatin gene expression by GnRH in female rats. J Endocrinol 210(1): 71-79.
-
IE Messinis (2005) Ovulation induction: a mini review. Hum Repro 20(10): 2688-2697.
-
McConnell DS, Wang Q, Sluss PM, Bolf N, Khoury RH, et al. (1998) A Two-Site chemiluminescent assay for activine-Free follistatin Reveals That most Follistatin Circulationg in activine-Bound State. J Cl Endocrinol Metabol 83(3): 851-858.
-
GM Lockwood, S Muttukrishna, W Ledger (1998) Inhibins and activins in human ovulation, conception and pregnancy. Hum Reprod Update 4(3): 284-295.
-
B Refaat (2014) Role of activins in embryo implantation and diagnosis of ectopic pregnancy. Reprod Biol Endocrinol 12:116.
-
Birdsall M, Ledger W, Groome N, Abdalla H, Muttukrishna S (1997) Inhibin A and activin A in the first trimester of human pregnancy. J Clin Endocrinol Metab 82(5):1557-1560.
-
Lockwood GM, Muttukrishna S, Groome NP, Knight PG, Ledger WL (2001) Concentrations of inhibins and activin in women undergoing stimulation with recombinant follicle-stimulating hormone for in vitro fertilization treatment. Fertil Steril 75(1): 32-37.
-
De Kretser DM, Hedger MP, Loveland KL, Phillips DJ (2002) Inhibins, activins, and follistatin in reproduction. Hum Reprod update 8(6): 529-541.
- Postpartum Maternal Mental Health - A Narrative Review
- Beta HCG in Cervico-Vaginal Secretion as a Predictor of Preterm Delivery
- Successful Management of Mid Trimester Foetal Death with Major Placenta Previa by Expectant Management Followed by Induction of Labour
- To Evaluate the Expression of Egr2 Gene in Term Low Birth Weight Newborns
- Impact of Maternal Obesity on Maternal and Foetal Outcomes: A Prospective Cohort Study from Northern India
- ‘’Benefit of Pulsatile GnRH Therapy in Treatment of Functional Hypothalamic Amenorrhea (FHA) and Congenital Hypogonadotropic Hypogonadism(CHH) in Infertile Patients Over Canonical Gonadotropins with IVF –A Short Communication’’