To Evaluate the Expression of Egr2 Gene in Term Low Birth Weight Newborns
Objectives 1. To evaluate the role of expression of EGR2 Gene in Term LBW Newborns 2. To study the various risk factor for LBW Newborns 3. Early identification of pregnant women at risk for low-birth-weight newborn is essential to offer them adequate follow up and treatment if required. 4. A strong association was found between expression of EGR2 gene and low birth weight. Low Birth Weight: The birth weight of an infant is the first weight recorded after birth, ideally measured within the first hours after birth, before significant postnatal weight loss has occurred. Low birth weight (LBW) is defined as a birth weight of less than 2500 g (up to and including 2499 g), as per the World Health Organization (WHO) . Low birth weight is further categorized into very low birth weight (VLBW,
Objectives
Thesis
The expression of Egr 1, 2 and 3 were analyzed at different stages of T and B cell development by RT-PCT and results showed that the expression was strictly regulated at different stages. Forced expression of Egr-2 in CD2+ lymphocytes resulted in a severe reduction of CD4+CD8+ (DP) cells in thymus and pro-B cells in bone marrow, which was associated with reduced expression of Notch1 in ISP thymocytes and Pax5 in pro-B cells, suggesting that retraction of Egr-2 at the ISP and pro-B cell stages is important for the activation of lineage differentiation programs.
Keywords: Low Birth Weight; New Borns; EGR2 Gene
Abbreviations
AC: Abdominal Circumference; AGA : Appropriate For Gestational Age; BMI: Body Mass Index; C/EBPA Gene: CAAT Enhancer Binding Protein Alpha Gene; EFW: Effective Fetal Weight; Hb: Hemoglobin; IUGR: Intrauterine Growth Restriction; LBW: Low Birth Weight; LGA: Large for Gestational Age; NBW: Normal Birth Weight; RT-PCR: Real Time Polymerase Chain Reaction; SGA: Small for Gestational Age; WHO: World Health Organization.
Introduction
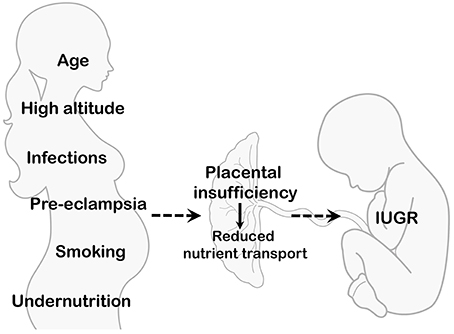
Low birth weight newborns are infants who are born weighing less than 2,500 grams (5 pounds, 8 ounces), regardless of their gestational age. This condition can be caused by preterm birth (born before 37 weeks of gestation) or fetal growth restriction (poor growth in the uterus) Low birth weight babies may face various health challenges, including difficulty regulating body temperature, feeding issues, respiratory problems, and increased risk of infections. They may require specialized medical care and monitoring to ensure healthy development [1].
The estimates provided by the World Health Organization (WHO) regarding low birth weight (LBW) babies are quite distressing, indicating that around 25 million infants are born annually with this condition. It is especially worrisome to note that close to 95% of these occurrences take place in developing nations, highlighting a significant global health imbalance that demands attention and action. The importance of acknowledging the challenges posed by LBW to infant health and development cannot be overstated, as the potential consequences are vast and profound. Out of the more than 20 million LBW infants born worldwide, which represent roughly 15.5% of all births, an overwhelming 95.6% originate from developing countries, emphasizing the urgent necessity for tailored interventions and support in these areas to tackle the complex factors contributing to LBW. This striking data underscores the critical need for focused efforts and allocation of resources to address the underlying issues surrounding LBW and improve outcomes for vulnerable infants in these regions [2].
India plays a crucial role in decreasing early deaths, especially since it holds the title of having the highest child mortality globally. Even with the decrease in infant mortality rate from 81 to 35 per 1000 live births between 1990 and 2016 at a rate of 1.3%, it persists as notably higher than neighboring nations like Nepal, Bangladesh, and Sri Lanka. The objective of the Sustainable Development Goals (SDGs) is to eradicate avoidable deaths of infants and young children under 5 years by 2030, setting specific targets for neonatal mortality (12 per 1000 live births) and under-5 mortality (25 per 1000 live births). However, due to disparities in different regions, half of India’s districts might not achieve these goals by 2030. Notably, approximately 83% of neonatal deaths in India are due to complications related to low birth weight (LBW), with babies weighing less than 2.5 kg being more vulnerable to malnutrition, diarrhea, and pneumonia, all of which are major factors in neonatal and child mortality. Globally, around 15–20% of all deliveries lead to low birth weight (LBW), amounting to more than 20 million births each year. Despite a decrease in LBW rates in developed nations, significant inequalities persist on a global scale, especially in African countries where rates are notably higher. Within various developing nations, the occurrence of LBW is noted at 15.9%, displaying diverse rates from 10% in Uganda to 15.7% in Senegal. Recent meta-analyses in Ethiopia have identified LBW incidence rates of 16.6% in Hawassa and 17% nationwide, while studies in Zambia and Tanzania have shown rates of 10.6% [3]. The heightened prevalence of LBW in developing nations can be elucidated by factors such as an increased incidence of home births, premature deliveries and pregnancy complications like hypertension and antepartum hemorrhage. Discrepancies in research areas also play a role, impacting the referral patterns for complex cases and consequently elevating the risk of LBW.
Additionally, there are significant differences in LBW prevalence among countries, with rates varying from 7.3% in Nigeria to a striking 40.0% in India, and falling between 5% and 12% in Iran. These distinctions emphasize the intricate relationship between socioeconomic, healthcare, and environmental aspects that influence maternal and neonatal health results worldwide. Dealing with the challenge of LBW requires customized interventions that address the specific hurdles encountered in each region. Essential approaches encompass enhancing access to maternal healthcare, improving prenatal services, and optimizing obstetric care to reduce the prevalence of LBW and its associated complications [4]. Low birth weight (LBW) newborns confront a range of path physiologic vulnerabilities, encompassing both immediate challenges and long-term consequences. These vulnerabilities include brain injuries, growth failure, motor difficulties, and developmental delays, reflecting the complex interplay of biological, environmental, and clinical factors.
One significant cardiovascular challenge observed in LBW neonates is hypotension, which is associated with considerable morbidity and mortality. The immature cardiovascular system of LBW infants may struggle to maintain adequate blood pressure, leading to hypotensive episodes that compromise tissue perfusion and oxygen delivery, exacerbating existing vulnerabilities and contributing to adverse outcomes [5]. Furthermore, LBW infants are particularly susceptible to weight loss in the early days of life, a phenomenon that can trigger physiological stress responses. This weight loss may result in the upregulation of the hypothalamus-pituitary-adrenal (HPA) axis, a key stress response system in the body, leading to increased salivary cortisol levels. Elevated cortisol levels signify physiological stress and may have implications for long-term health and development in LBW infants.
These path physiologic vulnerabilities underscore the importance of vigilant monitoring and comprehensive medical care for LBW newborns. Early recognition and intervention for cardiovascular challenges, such as hypotension, are critical to minimizing morbidity and mortality. Additionally, addressing factors contributing to weight loss and stress, such as optimizing feeding practices and providing supportive care, can mitigate the physiological burden on LBW infants and promote healthier outcomes [6].
Risk Factors of LBW
Low birth weight (LBW) in newborns is a multi- dimensional and complex issue influenced by a multitude of maternal risk factors, presenting a intricate interplay of variables contributing to this phenomenon. Maternal age emerges as a pivotal factor in this intricate web of influences, where both teenage pregnancies and pregnancies in advanced maternal age are closely linked with elevated incidences of LBW, underscoring the intricate relationship between maternal age and birth weight outcomes. Furthermore, the educational background of mothers emerges as another critical determinant, with lower levels of education potentially serving as a barrier to accessing essential healthcare resources and receiving adequate prenatal care, consequently heightening the susceptibility to LBW among this demographic [7].
The spatial location of residence, particularly in rural areas, presents a distinctive array of challenges due to the existence of potential barriers that hinder the access to essential healthcare services, thereby leading to delays or insufficiencies in the provision of prenatal care, which can ultimately have a significant impact on the prevalence of LBW among newborns. Furthermore, the presence of anemia in pregnancy, characterized by inadequate iron levels in the blood, emerges as a well-acknowledged risk factor for LBW, highlighting the crucial need to address maternal health concerns related to iron deficiency during pregnancy to reduce the chances of LBW incidents. Insufficient antenatal care further exacerbates this risk, as it may impede the timely identification and management of maternal health conditions that could affect fetal growth and development [8].
Anthropometric measurements such as low mid-upper arm circumference serve as valuable indicators of maternal malnutrition, offering insights into the potential risk of LBW and highlighting the intricate relationship between maternal nutritional status and birth weight outcomes. Additionally, maternal smoking during pregnancy is recognized as a significant risk factor, linked to fetal growth restrictions and LBW due to the compromised oxygen and nutrient supply to the developing fetus, emphasizing the harmful effects of maternal smoking on newborn health outcomes [9].
Moreover, the socioeconomic status and maternal literacy level play crucial roles as determinants of LBW, with lower socioeconomic status and maternal illiteracy often acting as indicators of inadequate access to healthcare services and a higher prevalence of risk factors linked to LBW, thus underscoring the vital importance of addressing social determinants of health to effectively combat the issue of LBW. Exposure to passive smoking during pregnancy and inadequate levels of hemoglobin further contribute to the heightened likelihood of delivering LBW infants, necessitating a comprehensive approach to address these risk factors and improve maternal and child health outcomes [10].
Efforts directed towards alleviating these risk factors require all-encompassing public health interventions that give precedence to maternal health and well-being, underscoring the importance of nutrition, education, and lifestyle choices in impacting birth weight outcomes. Actions targeted at promoting early and regular prenatal care, improving maternal nutritional status, implementing smoking cessation interventions, and addressing socio-economic inequities are vital in decreasing the occurrence of LBW and enhancing neonatal health outcomes. By embracing a comprehensive approach that addresses these multifaceted risk factors, public health initiatives can effectively prevent LBW and its associated complications, thereby promoting enhanced maternal and child health outcomes in the long term [11].
The Role of Expression of EGR2 Gene in Term LBW Newborns
The expression of the EGR2 gene is crucial in acting as a pivotal regulator of T-cell function and immune responses, exerting significant impacts on various aspects of immune- related conditions. The versatile functions of EGR2 not only encompass the maintenance of tolerance to self-antigens but also include the orchestration of T-cell activation and proliferation, in addition to shaping the progression of autoimmune disorders. Within the realm of immune tolerance, EGR2 assumes a central role in safeguarding self-tolerance by finely tuning T-cell reactions towards self-antigens. Its regulatory mechanisms extend further to the management of T-cell activation and expansion, thereby influencing the intricate equilibrium between immune activation and regulation. Disturbances in the expression levels of EGR2 have been correlated with autoimmune conditions such as systemic lupus erythematosus (SLE) and rheumatoid arthritis (RA), where elevated gene expression levels are associated with heightened susceptibility to these diseases [12].
In addition, the involvement of EGR2 goes beyond the realm of autoimmunity, encompassing its participation in the control of immune reactions to extended antigen exposure. EGR2 has been demonstrated to trigger transcription factors associated with anergy, thus impacting the differentiation statuses of CD8+ T cells and modulating immune reactions to enduring antigenic stimulation. Considering the pivotal role of EGR2 in regulating the immune system, the expression of this gene in low birth weight (LBW) neonates carries significant implications for the development and functionality of their immune systems [13]. Alterations in the expression patterns of EGR2 could potentially disturb immune homeostasis, thereby predisposing LBW infants to disorders related to the immune system and influencing their susceptibilities to infections. A comprehensive understanding of the interactions between EGR2 expression and the dynamics of the immune system in LBW neonates is critical for unraveling the underlying mechanisms of immune-related conditions and for optimizing approaches to immune regulation and disease prevention in this vulnerable demographic.
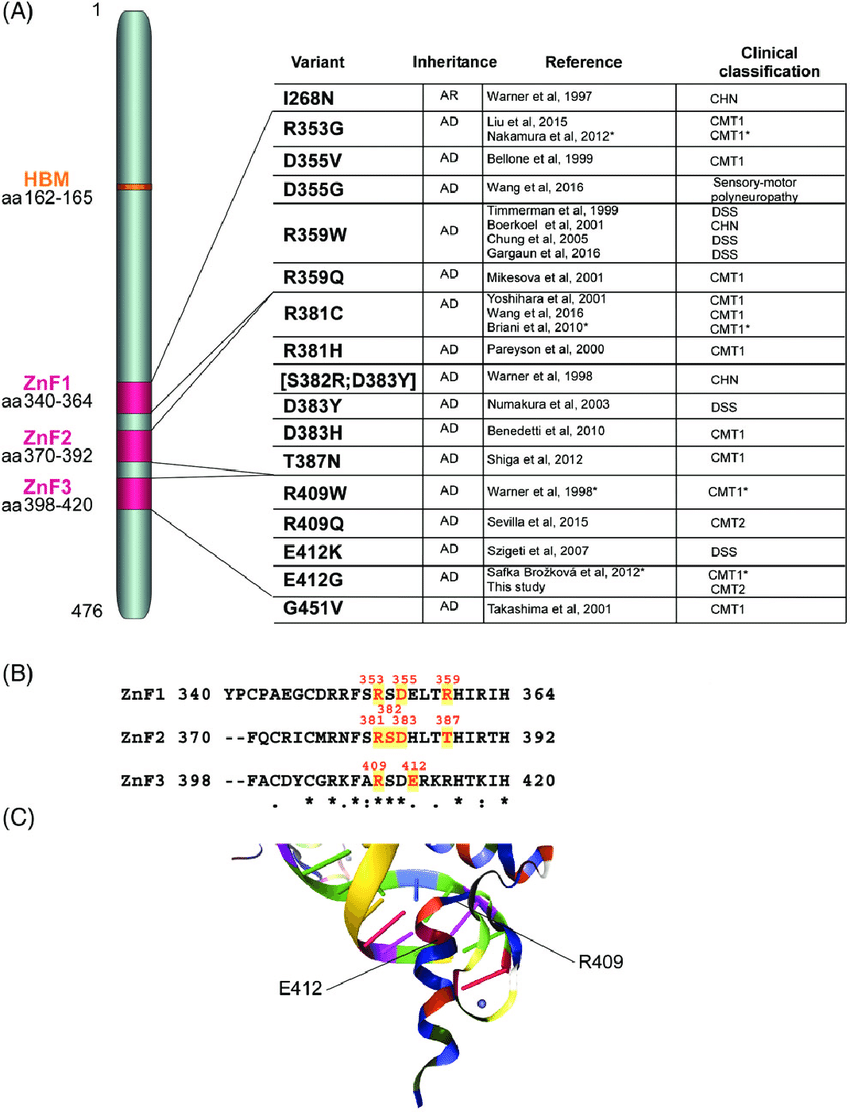
The gene identified as EGR2, also known as early growth response 2, plays a pivotal and fundamental role in various neurological and cardiac conditions, underscoring its remarkable importance in both the function of the peripheral nervous system and the health of the myocardium. Mutations occurring in the EGR2 gene have been implicated in a diverse range of peripheral neuropathies, including Charcot-Marie- Tooth type 1, Dejerine-Sottas syndrome, and congenital hypomyelinating neuropathy, disrupting crucial myelination processes essential for peripheral nerve function [14].
The dysregulation of EGR2 resulting from mutations not only impacts the functionality of the nervous system but also bears implications for conditions such as low birth weight (LBW) observed in newborns. The disruption of myelination processes mediated by EGR2 in the peripheral nervous system has the potential to impede neurological development in the prenatal stage, thereby contributing to LBW and the subsequent complications associated with it [15]. Hence, understanding the intricate role played by EGR2 in both neurological and cardiac contexts is crucial for uncovering the underlying mechanisms of disease pathogenesis and for developing targeted therapeutic interventions to mitigate the effects of EGR2 dysregulation on human health [16]. Aims and Objectives
- To evaluate the role of expression of EGR2 Gene in Term LBW Newborns.
- To study the various risk factor for LBW Newborns. Review of Literature Low birth weight newborns are infants who are born weighing less than 2,500 grams (5 pounds, 8 ounces), regardless of their gestational age. This condition can be caused by preterm birth (born before 37 weeks of gestation) or intrauterine growth restriction (poor growth in the womb). Low birth weight babies may face various health challenges, including difficulty regulating body temperature, feeding issues, respiratory problems, and increased risk of infections. They may require specialized medical care and monitoring to ensure healthy development [17].
Birth weight, the initial weight recorded after the birth of a fetus or newborn, serves as a crucial indicator of their health and development. When this weight falls below 2500 grams, it is termed as low birth weight (LBW). LBW is a significant factor influencing perinatal survival, infant health and mortality rates. Additionally, it heightens the risk of developmental complications and future illnesses for the infant. Disturbingly, infants weighing between 1500 to 2500 grams face a staggering 20-fold increase in the risk of neonatal death compared to infants with normal birth weights [18].
Epidemiology of Low Birth Weight
The World Health Organization (WHO) has provided alarming estimates regarding low birth weight (LBW) babies, revealing that approximately 25 million infants are born each year with this condition. What’s particularly concerning is that nearly 95% of these births occur in developing countries, indicating a profound global health disparity, it’s crucial to recognize that LBW poses significant challenges to infant health and development, with potentially far-reaching consequences [19]. Among the more than 20 million infants worldwide born with LBW, comprising approximately 15.5% of all births, an overwhelming 95.6% hail from developing countries. This staggering statistic underscores the pressing need for targeted interventions and resources in these regions to address the multifaceted factors contributing to LBW [20].
India’s role in reducing premature deaths is pivotal, given its status as the nation with the highest child mortality worldwide.
This study aims to explore LBW determinants and their spatial clustering, offering insights for policymakers to revise strategies for achieving SDG 3, ensuring universal health and well-being. Addressing the issue of LBW demands a comprehensive approach that encompasses improved maternal healthcare, nutrition, access to prenatal services, and socioeconomic support for families. By prioritizing interventions aimed at reducing LBW rates in developing countries, we can strive towards ensuring healthier outcomes for mothers and infants worldwide [21].
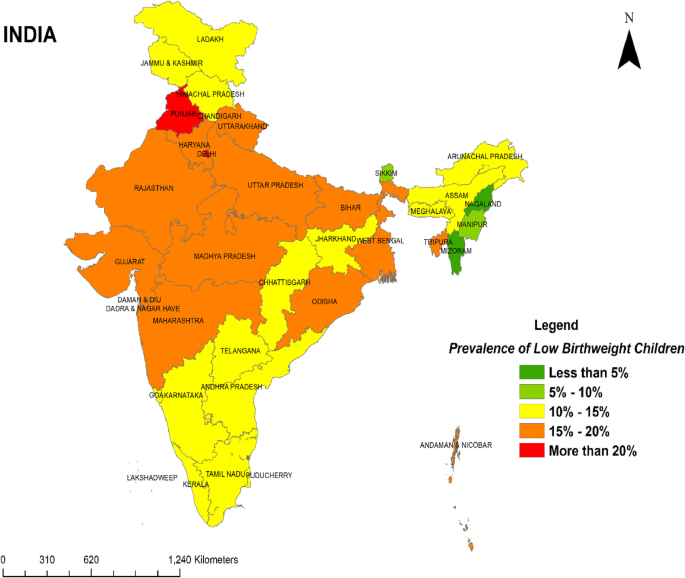
Further illustrating this global disparity, LBW prevalence ranges widely across different nations. For instance, Nigeria reports a rate of 7.3%, while India records a strikingly high prevalence of 40.0%. Similarly, LBW rates in Iran fall between 5% and 12%. The prevalence of low birth weight (LBW) infants among recent deliveries in healthcare facilities across Indian states and Union territories varies significantly. Approximately one fifth (17.06%) of the infants were born with LBW. States such as Punjab (21.36%) and Delhi (20.11%) recorded the highest prevalence of LBW infants, followed closely by Madhya Pradesh (19.47%), Uttar Pradesh (19.20%), and Daman Diu and Dadar and Nagar Haveli (19.07%). Conversely, states like Nagaland (3.38%) and Mizoram (3.36%) reported the lowest prevalence of LBW infants. illustrates the distribution of LBW prevalence across Indian states and Union territories [22]. It categorizes the prevalence into the following ranges: < 5%, 5%-10%, 10%-15%, 15%-20%, and > 20%.
These variations reflect the complex interplay of socioeconomic, healthcare, and environmental factors influencing maternal and neonatal health outcomes worldwide. Addressing these disparities requires targeted interventions tailored to the specific challenges faced by each region, with a focus on improving maternal healthcare access, prenatal services, and obstetric care to reduce the burden of LBW and its associated complications [23].
Predictors of Low Birth Weight
The most prevalent diagnoses to indicated low birth weight (LBW) often revolve around hypertensive disorders, hemorrhage, and acute or chronic fetal compromise, including fetal distress or intrauterine growth restriction (IUGR). A noteworthy recent study conducted at Hawassa University Comprehensive Specialized Hospital in Southern Ethiopia highlighted several key predictors of LBW [24]. Among these predictors were a history of previous abortion, hypertensive disorders of pregnancy, the frequency of antenatal care (ANC) visits, and gestational age at birth. These factors play significant roles in determining the likelihood of LBW occurrences and underscore the importance of comprehensive prenatal care and monitoring to identify and manage potential risk factors [25].
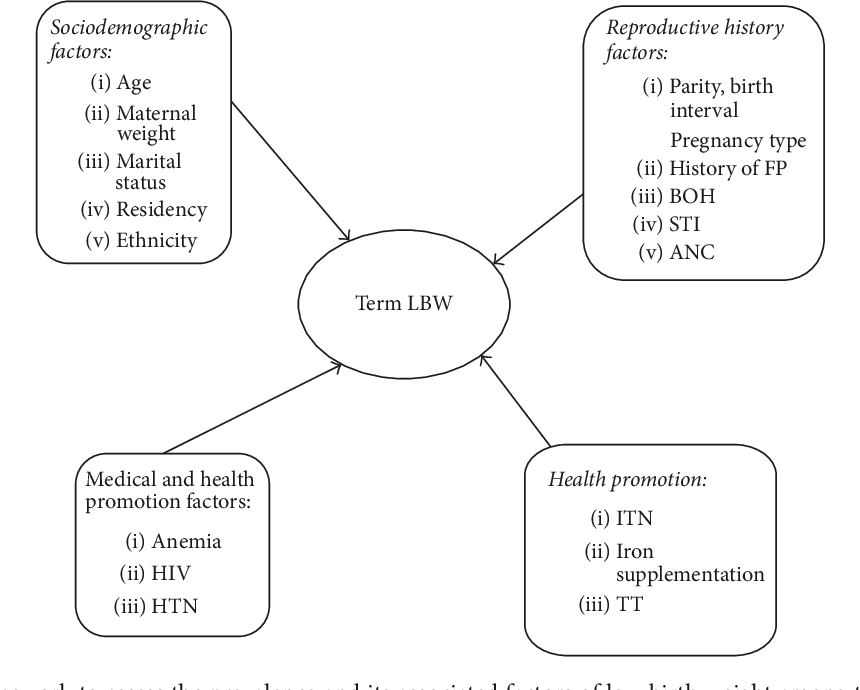
In addition to clinical factors, sociodemographic variables also play a crucial role in shaping the risk profile for LBW Factors such as maternal age, educational level, socioeconomic status, and access to healthcare services can influence pregnancy outcomes. Understanding and addressing these sociodemographic determinants are essential for developing targeted interventions and strategies to reduce the incidence of LBW and improve maternal and neonatal health outcomes. By addressing both clinical and sociodemographic factors, healthcare providers can better identify at-risk pregnancies, implement preventive measures, and provide appropriate care to mitigate the risk of LBW and its associated complications [26].
Maternal age emerges as a crucial predictor of low birth weight (LBW) incidence, as evidenced by research findings. Studies conducted in developing countries have indicated that maternal age between 35 and 49 years old elevates the odds of LBW occurrences. Conversely, younger maternal age, particularly under 20 years old, has also been linked to increased LBW risk in various studies. Furthermore, the absence of adequate social support, residing in rural areas, and lacking formal education have all been identified as additional factors associated with LBW [27]. These findings underscore the multifaceted nature of maternal influences on birth weight outcomes, highlighting the importance of addressing sociodemographic factors alongside clinical considerations in maternal and child health interventions.
By understanding and targeting these factors, healthcare providers can better tailor strategies to support maternal well-being and mitigate the risk of LBW, ultimately improving neonatal health outcomes.
In addition to prematurity, other factors play crucial roles in predicting LBW incidence. Hypertension, preeclampsia, and eclampsia during pregnancy emerge as significant contributors, as supported by various studies. Lack of antenatal care follow-up, shorter pregnancy intervals of less than 24 months, depression during pregnancy, and maternal near miss events are also identified as common predictors of LBW [28]. These findings collectively underscore the complex interplay of maternal health, prenatal care, and obstetric factors in shaping birth weight outcomes. Understanding and addressing these predictors are essential for developing targeted interventions aimed at reducing the incidence of LBW and improving neonatal health outcomes globally [29].
Furthermore, hypertensive disorders of pregnancy, a significant contributor to maternal near miss and perinatal mortality, have a notable impact on the rising prevalence of low birth weight (LBW) in Africa. Mothers with hypertension during pregnancy are at a heightened risk of delivering low- weight infants compared to those without hypertension, particularly if delivery occurs before 37 weeks of gestation. This association is supported by multiple studies, possibly due to hypertension-induced uteroplacental insufficiency. Similarly, inadequate antenatal care (ANC) visits, defined as fewer than the World Health Organization’s recommendation of four visits, increase the likelihood of LBW births, as evidenced by various studies.
Notably, research in Ethiopia and elsewhere has shown that women with at least one previous abortion are at increased risk of delivering LBW neonates. This finding aligns with studies conducted in Denmark, the USA, and the physical trauma caused by abortion may compromise cervical integrity, leading to LBW in subsequent pregnancies [30]. Moreover, stress and depression following previous abortion events have been linked to lower dietary diversity, reduced fetal nutrient supply, and an elevated risk of LBW. Additionally, untreated antenatal depression and maternal anemia have been identified as significant predictors of LBW, further emphasizing the importance of addressing maternal mental health and nutritional status during pregnancy to mitigate the risk of LBW.
Research from Tanzania underscores malnutrition as another significant factor increasing the risk of low birth weight (LBW) among pregnant women. Similarly, studies across developing countries and meta-analyses conducted in Ethiopia have revealed that a body mass index (BMI) below 18.5 kg/m² significantly elevates the odds of LBW. Moreover, findings from Ethiopia indicate that factors such as lack of nutrition counseling and iron/folic acid supplementation during pregnancy, inadequate dietary diversity, maternal under nutrition, maternal anemia, and failure to consume snacks during pregnancy are independently associated with LBW [31].
Evidence-based medicine supports the efficacy of iron supplementation in improving birth weight, emphasizing the importance of enhancing antenatal care program coverage and advocating for food fortification initiatives. Additionally, addressing underlying social determinants such as poverty and women’s status, particularly in South Asia, is crucial. To effectively reduce LBW rates, strategies should integrate nutrition-based interventions focused on improving food intake and micronutrient status, particularly iron, with initiatives that enhance women’s status and reproductive health. By implementing comprehensive approaches, healthcare systems can better address the multifaceted causes of LBW and improve maternal and neonatal health outcomes on a global scale [32].
Prevention and Associated Adverse Outcomes
Low birth weight (LBW) represents a critical concern due to its association with heightened morbidity and mortality rates among newborns. Factors contributing to LBW include maternal HIV infection, higher parity, occurrences of preeclampsia, and premature birth (gestational age less than 37 weeks). Furthermore, maternal anemia, inadequate nutrition, and insufficient antenatal care have also been identified as contributors to LBW [33].
Researches from Indonesia, Brazil, and Colombia underscore the pivotal role of adequate prenatal care in preventing low birth weight (LBW) among infants. Multiple studies have demonstrated that effective utilization of antenatal care (ANC) significantly reduces LBW rates, particularly in pregnancies deemed high-risk.
Quality prenatal care encompasses timely initiation and consistent attendance, both of which have been linked to decreased incidences of LBW and premature births. Moreover, the quality of ANC services itself plays a crucial role in preventing LBW. Specific interventions during ANC, such as regular weight and abdominal examinations, as well as iron supplementation, have been identified as key factors contributing to improved birth outcomes [34].
These findings underscore the critical importance of comprehensive and timely prenatal care in mitigating LBW risks and enhancing neonatal health outcomes, particularly in resource-constrained settings and developing countries. By emphasizing the provision of high-quality ANC services, healthcare systems can effectively reduce the burden of LBW and promote better health outcomes for both mothers and newborns.
Efforts aimed at addressing these risk factors through enhanced maternal and neonatal interventions are pivotal in lowering LBW rates and alleviating its associated health impacts. This highlights the crucial role of public health initiatives and tailored prevention strategies in safeguarding maternal and child health [35].
Prenatal care is a fundamental framework designed to safeguard the health and well-being of both mothers and fetuses throughout pregnancy. This comprehensive approach involves early and ongoing risk assessment to promptly identify potential health risks or complications. It empowers expectant mothers through health promotion initiatives, offering education on nutrition, lifestyle choices, and self- care practices that support a healthy pregnancy.
The traditional model of prenatal care adheres to a structured schedule of visits at specific intervals, starting early in the first trimester and continuing throughout pregnancy. During these visits, healthcare providers conduct thorough assessments, provide tailored health education, and administer necessary medical interventions like screenings and vaccinations to monitor maternal and fetal health. Emerging models such as group prenatal care, exemplified by programs like Centering Pregnancy, integrate traditional components with peer support and interactive sessions, fostering a collaborative environment for mothers to share experiences and receive comprehensive education [36].
The World Health Organization recommends focused antenatal care visits, ensuring each encounter includes evidence-based interventions tailored to the stage of pregnancy, aiming to reduce maternal and newborn mortality rates globally. By combining medical expertise with health promotion and supportive interventions, prenatal care plays a pivotal role in promoting maternal and fetal health, aiming for positive birth outcomes and overall maternal well-being.
Improving the utilization of Kangaroo Mother Care (KMC) is crucial for enhancing newborn care, particularly for premature babies or those with low birth weight (LBW). KMC involves placing the newborn in skin-to-skin contact with the mother’s chest and abdomen, coupled with frequent breastfeeding, providing warmth and touch essential for the newborn’s well-being. This low-cost method has shown significant survival benefits, benefiting breastfeeding outcomes and cardiorespiratory stability without adverse effects.
Clinical trials in India have demonstrated that wider implementation of KMC leads to improvements in vital physiological parameters of LBW newborns, correcting individual abnormalities such as hypothermia and bradycardia [37].
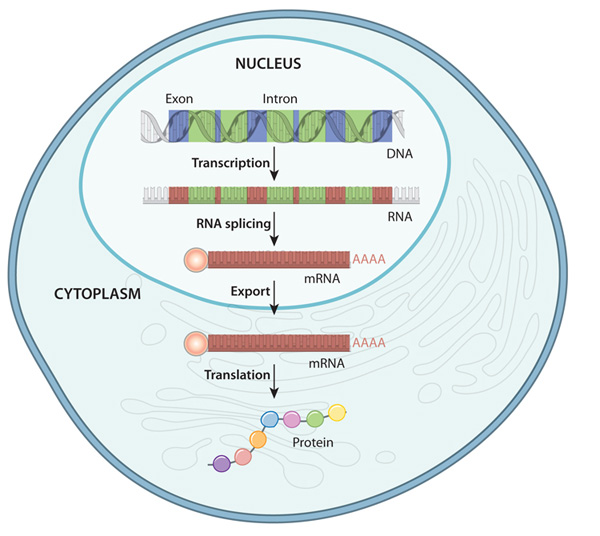
Gene expression refers to the process by which the information encoded in a gene is used to synthesize functional gene products, such as proteins or RNA molecules. This process is tightly regulated and involves multiple steps, including transcription, where a copy of the gene’s DNA sequence is made into a messenger RNA (mRNA) molecule, and translation, where the mRNA is used as a template to assemble a specific sequence of amino acids into a protein. Gene expression is crucial for the growth, development and functioning of all organisms, as it dictates the production of the molecules necessary for various cellular processes. It is highly dynamic and can be influenced by internal factors, such as cellular signaling pathways and epigenetic modifications, as well as external factors, such as environmental cues and stressors. Dysregulation of gene expression can lead to a range of diseases and disorders, highlighting the importance of understanding and studying this fundamental biological process [38].
Gene expression refers to the process by which the information encoded in a gene is utilized to create a functional gene product, like a protein. In the study of term low birth weight newborns, researchers are focusing on the EGR2 gene to discern the extent to which its genetic information is translated into the corresponding protein. The EGR2 gene, also called Early Growth Response 2, codes for a transcription factor pivotal in regulating gene expression. This factor is implicated in numerous cellular activities, spanning growth, differentiation, and response to stress. Understanding the dynamics of EGR2 gene expression could shed light on the molecular mechanisms underlying term low birth weight and potentially inform strategies for diagnosis and treatment[39].
Evaluation
The evaluation of EGR2 gene expression in term low birth weight (LBW) newborns provides valuable insights into potential links with health conditions. Studies suggest that EGR2 serves as a genetic risk factor for systemic lupus erythematosus (SLE) and rheumatoid arthritis (RA), where heightened gene expression may contribute to the development of SLE. In the context of LBW newborns, there are observations of compromised innate immune responses and inefficient hematopoietic differentiation, leading to variations in the expression of hematopoiesis-related genes compared to newborns with normal birth weight. These findings suggest a potential role for EGR2 in mediating immune and hematopoietic processes in LBW newborns, highlighting its relevance in understanding the molecular mechanisms underlying LBW-associated health outcomes. Further research into the specific mechanisms by which EGR2 influences immune function and hematopoiesis in LBW newborns may offer novel insights and therapeutic avenues for addressing health challenges in this population [40].
Arthritis In addition to its role in systemic lupus erythematosus (SLE) and rheumatoid (RA), research highlights the critical involvement of the EGR2 gene in regulating T cell functions and autoimmune diseases. Elevated EGR2 expression in lupus cells has been shown to exert significant effects on T helper 1 (Th1) cell differentiation and the production of interferon-gamma (IFNγ), key players in the inflammatory response. Furthermore, EGR2 exhibits a nuanced and context-dependent regulatory role in immune function, influencing various immune cell subpopulations and auto inflammatory processes across different physiological and pathological conditions. These findings underscore the complexity of EGR2’s involvement in immune regulation and its potential implications for understanding autoimmune diseases. By elucidating the intricate mechanisms by which EGR2 modulates immune responses, researchers may uncover novel therapeutic targets and strategies for managing autoimmune disorders more effectively [41].
The EGR2 gene emerges as a pivotal player in a multitude of biological processes, spanning T-cell differentiation, senescence regulation, and cellular proliferation. Research indicates that EGR2 acts as a crucial positive regulator in promoting peripheral naive T-cell differentiation and augmenting in vivo T-cell responses to viral infections, contrary to its traditional role as a negative regulator in T-cell activation. Moreover, EGR2 has been identified as a novel regulator of senescence, with its expression up- regulated during senescence processes, thereby activating key pathways involved in growth arrest and age-related diseases [42]. Additionally, EGR2’s involvement in cellular proliferation is underscored by its induction by various mitogens and its function as a transcriptional regulator in cellular proliferation pathways. Therefore, the multifaceted functions of the EGR2 gene render it a significant contributor to various physiological processes, potentially impacting factors such as low birth weight through its regulatory roles in fundamental cellular functions. Understanding the intricate mechanisms underlying EGR2’s involvement in these processes could provide valuable insights into its role in health and disease, paving the way for targeted therapeutic interventions and improved management of conditions influenced by EGR2 dysregulation [43].
The EGR2 gene assumes pivotal roles across diverse biological processes in various tissues. In Schwann cells, EGR2 promoter antisense RNA governs chromatin accessibility, thereby modulating gene transcription. In autoimmune conditions, EGR2’s immune regulatory function is context- dependent, exerting influence on T cell activation and antibody production. During myocardial injury in myocardial infarction, EGR2 exacerbates inflammation and apoptosis, suggesting its potential as a therapeutic target for rescuing myocardial cells. Alveolar macrophages rely on EGR2 for their phenotypic identity, crucially impacting lung homeostasis and responses to respiratory challenges. Additionally, EGR2 contributes to embryo implantation and decasualization processes, influencing stromal cell proliferation, differentiation markers, and responses to growth factors like HB-EGF. Collectively, the multifaceted regulatory roles of the EGR2 gene extend across a spectrum of physiological and pathological processes, underscoring its significance not only in fetal development but also in various aspects of health and disease. Understanding the intricate mechanisms by which EGR2 operates in different tissues offers valuable insights into its broader implications and potential therapeutic targets in diverse medical contexts [44].
Association between EGR2 Gene Expression and Low Birth Weight
Recent research findings have brought to light a deep and meaningful connection between the patterns of expression exhibited by the EGR2 gene and the occurrence of low birth weight, a crucial aspect with significant implications for the well-being of both mothers and fetuses. It is noteworthy to mention that detailed inquiries have uncovered that changes occurring within the EGR2 gene are not solely linked to chronic lymphocytic leukemia but also serve as indicators of unfavorable prognostic outcomes for patients affected by this condition. This duality in the role of EGR2 mutations hints at the gene’s intricate participation in a wide array of physiological processes, emphasizing its potential significance as a notable molecular marker in various clinical scenarios [45].
Delving beyond the scope of leukemia, the significance of EGR2 extends into the realm of autoimmune disorders. Elevated levels of EGR2 gene expression have been documented in T cells from individuals grappling with lupus, suggesting a plausible mechanistic association between EGR2 and the development of autoimmune conditions. These discoveries prompt a deeper investigation into the specific molecular pathways through which EGR2 impacts immune dysregulation, presenting promising opportunities for targeted therapeutic interventions in autoimmune diseases [46].
Furthermore, the role played by EGR2 goes beyond immune system function, encompassing its pivotal contribution to the differentiation of naive T cells. By virtue of its regulatory functions, EGR2 exerts significant control over the adaptive immune response, particularly in the context of viral infections. This highlights the broader significance of the gene in coordinating immune defense mechanisms against infectious agents, thus underscoring its potential as a target for therapies aimed at modulating immune responses to bolster host defenses [47].
IInd the field of human genetics, variations in the EGR2 gene have been identified as predisposing factors for systemic lupus erythematosus, a complex autoimmune disorder characterized by dysregulated immune responses. Notably, heightened levels of EGR2 expression associated with these genetic alterations could contribute to the disruption of immune pathways implicated in the progression of diseases. Understanding the interplay between genetic polymorphisms, EGR2 expression levels, and susceptibility to diseases holds promising prospects for advancing personalized medicine strategies in the treatment of autoimmune conditions [48].
Taken together, these observations emphasize the multifaceted role of EGR2 across different dimensions of human health and disease. From its involvement in predicting leukemia outcomes to its role in autoimmune disease development and prenatal health, EGR2 emerges as a central figure in orchestrating the molecular processes that underlie the onset and progression of diseases. Ongoing exploration of the molecular mechanisms governing EGR2 function is poised to offer valuable insights with broad implications for clinical practice and therapeutic approaches [49].
Mechanisms Underlying EGR2 Dysregulation in LBW
Low birth weight (LBW) has surfaced as a pivotal clinical indicator intricately intertwined with the dysregulation of the transcription factor EGR2, exerting profound impacts on a myriad of biological processes, delving into realms of intricate molecular interactions. This intricate link between LBW and EGR2 not only delves into the immediate implications on infant health but also extends to encompass broader implications in autoimmune disorders, hematopoietic stem cell aging, and cardiovascular maladies, showcasing the expansive functional repertoire of EGR2 within the intricate web of human health dynamics. The disruption of EGR2 in LBW infants is thought to encompass a intricate interplay of molecular mechanisms, including alterations in chromatin accessibility, complex interactions with histone modification complexes, and modulation of immune responses, highlighting the multifaceted nature of EGR2-mediated pathways and their significant contributions to the path physiology associated with LBW [50].
Moreover, the involvement of EGR2 transcends into the realm of inflammatory cascades and transcriptional programs linked to leukemia, underscoring the versatility of this transcription factor in orchestrating a wide array of pathological conditions. The remarkable elevation of EGR2 in LBW scenarios raises urgent concerns regarding its capability to disturb the delicate equilibrium of normal physiological processes, potentially predisposing individuals to immune dysregulation and heightened susceptibility to a range of diseases, thereby highlighting the intricate interplay between EGR2 dysregulation and LBW, shedding light on the underlying molecular mechanisms governing this complex phenomenon [51].
Given these profound observations, further in-depth explorations focused on unraveling the specific intricate molecular pathways driving the dysregulation of EGR2 in LBW unveil a realm of immense promise and potential. Devoted actions are essential in revealing priceless understandings of the roots of LBW, which could lead to the identification of groundbreaking therapeutic targets to address the negative health impacts related to LBW. By delving into the labyrinthine molecular networks orchestrated by EGR2 in LBW contexts, researchers stand poised to advance our comprehension of the developmental origins of health and disease, thereby laying the foundation for targeted interventions aimed at enhancing clinical outcomes for LBW infants [52].
Clinical Implications and Future Directions
EGR2, a crucial transcription factor, occupies a central position at the convergence of diverse biological processes vital for immune functionality and beyond, as demonstrated by a plethora of research discoveries. A significant aspect to note is that investigations emphasize its essential role in shaping immune reactions, particularly by participating in the formation and sustenance of exhausted CD8+ T cells—an indispensable aspect within the realm of chronic infections and tumor immunity. The complex interaction between EGR2 and the dynamics of immune cells accentuates its importance as a prospective target for therapeutic interventions aimed at modulating immune responses in the context of various diseases. Exploring further into its immunological functions, the significance of EGR2 extends into the realm of hematologic malignancies, particularly chronic lymphocytic leukemia (CLL), where mutations in the gene are associated with advanced disease stages and unfavorable prognoses. This correlation highlights the multifaceted involvement of EGR2 in the pathogenesis of diseases, illuminating its potential as both a predictive marker and a target for therapeutic approaches in managing CLL [53].
Furthermore, EGR2 emerges as a pivotal figure in autoimmune conditions, where its regulatory roles play a critical part in coordinating the dysregulation of the immune system. The intricate web of regulatory mechanisms governed by EGR2 underscores its importance in comprehending the molecular foundations of autoimmune disease development, presenting promising avenues for precise therapeutic interventions. Expanding the scope beyond immune-related functions, the influence of EGR2 extends to specific tissue contexts, particularly in the lungs where it assumes a crucial role in defining the characteristics and functions of alveolar macrophages. This function underscores the broader implications of EGR2 in immune surveillance, defense against pathogens, and mechanisms of tissue repair, showcasing its diverse range of functions in maintaining tissue equilibrium and responding to injuries [54].
Considering the multifaceted roles of EGR2 spanning various biological contexts, its potential implications in the realm of Low Birth Weight (LBW) demand closer examination. Given its profound impact on immune responses and disease outcomes, delving into the intricate mechanisms through which EGR2 operates in LBW scenarios holds promise for unveiling the developmental roots of health and disease. These insights might open doors for innovative therapeutic approaches aimed at modulating immune responses and enhancing clinical outcomes in LBW populations, thereby addressing a significant medical need that remains unmet [55].
The pursuit of finding non-invasive markers to evaluate EGR2 expression levels in maternal blood or amniotic fluid marks a revolutionary shift towards early detection and intervention methods to address the risk of low birth weight (LBW) in pregnancies. Taking inspiration from successful approaches in diagnosing various pregnancy-related issues like preeclampsia, scientists have made notable progress in utilizing circulating RNA (C-RNA) analysis as a diagnostic instrument. Through examining changes in gene expression patterns observable in maternal blood, this technique provides a glimpse into the molecular landscape of pregnancy complications, including LBW, potentially enabling timely actions to protect the well-being of both mother and fetus, thus paving the way for improved health outcomes [56].
Moreover, liquid biopsies, which assess circulating cell- free RNA (cfRNA), present a promising frontier in prenatal diagnostics. These tests have shown exceptional sensitivity in identifying alterations in gene expression profiles linked to unfavorable pregnancy outcomes, empowering healthcare professionals to pinpoint pregnancies at elevated risk of LBW at an earlier stage. By harnessing the potential of cfRNA analysis, medical practitioners can craft personalized care plans tailored to the specific requirements of high-risk pregnancies, thereby optimizing results for both the mother and the child [57].
At the same time, the unearthing of specific protein markers in amniotic fluid, like lactotransferrin (LTF) and superoxide dismutase 2 (SOD2), marks a significant leap forward in predictive medicine. These signals function as early alarms, providing crucial understanding of the likelihood of preterm birth (PTB) and empowering proactive measures to decrease risks to the newborn. The capacity to anticipate PTB and LBW risks in advance empowers healthcare providers to apply targeted interventions, ranging from lifestyle adjustments to medical treatments, thus enhancing pregnancy outcomes and lessening the impact of neonatal complications [58].
The amalgamation of non-invasive biomarker- driven techniques into traditional prenatal care presents considerable potential for enhancing clinical decision- making and improving maternal-fetal health outcomes. Harnessing the predictive potential of these markers enables healthcare providers to pinpoint pregnancies at risk of LBW early on, facilitating proactive management strategies to avert adverse outcomes. Furthermore, continuous advancements in biomarker exploration emphasize the evolving nature of prenatal diagnostics, offering prospects for further enhancements and breakthroughs in risk evaluation and intervention approaches. Essentially, the acceptance of non-invasive markers for evaluating EGR2 expression levels signifies a crucial stride towards realizing the concept of precision medicine in prenatal care, where individualized interventions are guided by molecular insights to optimize results for both the mother and the child [59].
There are Several Studies have Been Conducted from Time to Time which are Presented Below
According to Xiao C, et al. [60] intrauterine growth retardation (IUGR) impacts around 10% to 15% of pregnancies globally, linking not only to stillbirth and infant mortality but also to cognitive delays in childhood and the onset of metabolic and vascular issues in adulthood. Understanding its mechanism holds significant value. Utilizing datasets from the Gene Expression Omnibus, normalization via Principal Component Analysis (PCA), and ggplot2 for screening Differential Expressed Genes (DEGs), we conducted various analyses including Gene Ontology (GO), Kyoto Encyclopedia of Genes and Genomes (KEGG) pathways, and protein-protein interaction (PPI) analysis. Eleven DEGs were identified from 2 datasets, intersecting with 195 genes related to IUGR from OMIM, with EGR2 being the sole intersection gene. Notably, placental expression genes like COL17A1, HSD11B1, and LGALS14 were found, along with molecular functions linked to oxidoreductase activity. GSEA identified enriched pathways like interleukins signaling and collagen degradation. PPI analysis highlighted critical modules involving up-regulated genes (LEP, PRL, TAC3, MMP14, and ADAMTS4) and down-regulated genes (TIMP4, FOS, CCK, and KISS1). Notably, six genes (PRL, LGALS14, EGR2, TAC3, LEP, and KISS1) were identified as potentially central to IUGR pathophysiology, particularly in placental development concerning hypoxia and oxidoreductase activities. This bioinformatics analysis offers valuable insights for further understanding and potentially preventing IUGR [60].
According to Li S, et al [61] 2023 Very low-coverage (0.1 to 1×) whole genome sequencing (WGS) has emerged as an affordable method for uncovering genomic variants in human populations, particularly for genome-wide association studies (GWAS). In this study, an ultra-low coverage (ulcWGS) approach, below 0.1×, was investigated to support genetic screening using preimplantation genetic testing (PGT) in a large population. A pipeline was developed to analyze ulcWGS data for GWAS, and the accuracy of genotype imputation was assessed across different coverages and sample sizes using embryo PGT samples and a standard Chinese sample with known genotypes. Results showed that genotype imputation accuracy improves with larger sample sizes and certain filtering techniques. GWAS on 1744 transferred embryos identified 11 genomic risk loci associated with gestational ages and 166 genes mapped to these loci, including CRHBP, ICAM1, and OXTR, known for their relation to preterm birth. Further analysis revealed interrelationships between these genes and preterm birth, infant disease, and breast cancer, shedding light on genetic variations in fetal embryos from the Chinese population and the potential of ulcWGS for GWAS [61].
Sampino S, et al [62] 2017 suggested that advanced maternal age poses a risk for neurological and neuropsychiatric disorders in offspring, but whether these are influenced by pre- or postnatal factors remains uncertain. In this study, a mouse model was employed to explore whether pregnancy at advanced age triggers behavioral and brain gene expression changes in offspring. Swiss Albino mice were conceived by 3-month-old males and either 15–18-month-old (n = 11) or 3-month-old control females (n = 5), delivered via cesarean section, fostered post- birth by 3-month-old dams, and subjected to behavioral tests. Genome-wide mRNA expression in the hippocampi of 4-month-old male offspring was analyzed using microarrays. Offspring from older mothers displayed increased ultrasound vocalization during separation, heightened anxiety-like behaviors in adulthood, and altered hippocampal gene expression compared to controls. Notably, these effects were not reversed by postnatal maternal care from young foster mothers, indicating that altered brain programming is likely established at birth, suggesting prenatal effects linked to maternal aging [62].
Nrf2, a crucial transcription factor in defending against oxidant disorders, has been understudied regarding its involvement in organ development and neonatal diseases like broncho-pulmonary dysplasia (BPD) caused by therapeutically administered oxygen in premature infants. Cho HY et.al; 2012 investigated Nrf2-mediated molecular events during lung maturation from saccular to alveolar stages and its role in hyperoxic lung injury using newborn Nrf2-deficient (Nrf2−/−) and wild-type (Nrf2+/+) mice. Results revealed lower basal expression of genes related to cell cycle, redox balance, and metabolism, alongside elevated expression of lymphocyte immunity genes in Nrf2−/− neonates compared to Nrf2+/+ neonates. Hyperoxia- induced lung injury was more severe in Nrf2−/− neonates, characterized by increased mortality, impaired saccular-to- alveolar transition, lung edema, inflammation, DNA damage, and tissue oxidation. Nrf2 orchestrated the expression of genes involved in organ injury, cellular growth, vasculature development, immune response, and cell interaction during lung injury pathogenesis. Bioinformatics analysis identified Nrf2 binding motifs and supported Gpx2 and Marco as Nrf2 effectors, with augmented inflammation in genetically deficient neonates. This investigation employed lung transcriptomics and gene-targeted mice to uncover molecular events during lung development and elucidate Nrf2’s role in protecting against hyperoxia-induced lung injury in neonates, suggesting the therapeutic potential of Nrf2 activators for neonatal disorders linked to oxidative stress, including BPD [63].
Ayuso M, et al. [64] compared purebred (IB) and Duroc- crossbred (IBxDU) Iberian pigs, known for distinct meat quality and production traits, using RNA-Seq analysis of Biceps femoris muscle samples from nine IB and ten IBxDU pigs at birth. Phenotypic differences include greater body size and weight in IBxDU and higher intramuscular fat and plasma cholesterol content in IB neonates. Differential gene expression analysis reveals 149 genes, including DLK1, FGF21, and UBC, linked to adipose and muscle tissue development. Transcriptomic differences suggest enrichment of lipid metabolism functions in IB and cellular/ muscle growth in IBxDU pigs, with shared functions in protein catabolism, cholesterol biosynthesis, and immune response. Transcription factors like CEBPA, EGRs, and PPARGC1B, known for roles in adipogenesis and lipid metabolism, and myogenesis factors like FOXOs, MEF2D and MYOD1, potentially influence meat quality differences. Furthermore, differential segregation of polymorphisms, including non- synonymous variants in transcription factors like PPARGC1B and TRIM63 genes, suggests associations with altered gene function. These findings provide insights into candidate genes, metabolic pathways, and genetic polymorphisms contributing to phenotypic disparities between IB and IBxDU pigs, particularly in meat quality and production traits [64].
Kantake M, et al. [65] study aimed to investigate the impact of environmental factors on cytosine methylation of preterm infants’ DNA, recognizing the potential influence of early life experiences on physiological and mental health through epigenetic DNA modification. Conducted in a Neonatal Intensive Care Unit at a Japanese University Hospital, the study compared epigenetic differences in the glucocorticoid receptor (GR) gene between 20 healthy term and 20 preterm infants. Methylation rates in the 1-F promoter region of the GR gene were measured using the Mquant method, with peripheral blood samples obtained at birth and on postnatal day 4. Results indicated a significant increase in methylation rate between postnatal days 0 and 4 in preterm infants, contrasting with stable levels in term infants, leading to significantly higher methylation rates in preterm infants by day 4. Correlations were found between perinatal parameters and methylation rate changes. Logistic regression analysis revealed predictive value of methylation rates on postnatal day 4 for later complications requiring glucocorticoid administration during the neonatal period, with no gene polymorphisms detected within the analyzed GR promoter region. The study concludes that while further large-scale research is warranted to identify environmental factors explaining epigenetic differences among infants post- birth, the data suggests the postnatal environment influences epigenetic programming of GR expression through GR gene promoter methylation in premature infants, potentially resulting in relative glucocorticoid insufficiency during the postnatal period [65].
According to Bhattacharya S, et al. [66] 2021 transcriptomic profiles from sorted peripheral blood CD8+ T cells of preterm and full-term infants enrolled in the NHLBI Prematurity and Respiratory Outcomes Program (PROP) were analyzed to understand the development of Bronchopulmonary Dysplasia (BPD) and Post-Prematurity Respiratory Disease (PRD) in premature babies with neonatal respiratory distress syndrome (RDS). RNA-Seq analysis of CD8+ T cells from 145 subjects, including those born at <29 weeks gestational age (GA), revealed gene expression patterns associated with oxygen utilization and BPD outcomes.
Specifically, 501 genes were linked to oxygen utilization, while 571 genes were differentially expressed in subjects diagnosed with BPD. A set of 92 genes could predict BPD with moderate accuracy. Dysregulation of TGFB, NRF2, HIPPO and CD40-associated pathways was consistently observed in BPD cases. Additionally, a 28-gene set was identified that predicted PRD status with moderate accuracy, also involving TGFB signaling. These findings highlight molecular markers of inflammation associated with the independent development of BPD and PRD in extremely premature infants and in preterm and full-term subjects, shedding light on potential mechanisms underlying these respiratory diseases [66].
Gao H, et al. [67] investigated the physiological changes in postnatal intrauterine growth restriction (IUGR) piglets, focusing on liver metabolism’s role in neonatal growth and survival. Transcriptome profiling of liver samples from postnatal Days 1, 7, and 28 highlighted several complications in IUGR piglets, including inflammatory stress, immune dysregulation, cytoskeleton and membrane disorganization, dysregulated transcription events, and abnormal glucocorticoid metabolism. Elevated serum liver function indices (alanine aminotransferase, aspartate aminotransferase, total protein) and hepatic pathological changes indicated liver damage and dysfunction in IUGR piglets. Sex-specific differences were observed, suggesting male IUGR piglets may be more susceptible to disrupted metabolic homeostasis. These findings provide insight into IUGR liver function mechanisms, emphasizing the need for strategies balancing postnatal catch-up growth and metabolic consequences, with considerations for sex- specific interventions to improve the survival and growth performance of IUGR offspring [67].
Twisselmann N, et al. [68] investigated immune responses in preterm infants, focusing on dysregulated macrophage (MФ) activation as a potential contributor to inflammation- mediated bronchopulmonary dysplasia (BPD) development. Comparing monocyte-derived MФ from preterm and term infants, as well as healthy adults, after lipopolysaccharide (LPS) exposure, preterm MФ exhibited enhanced and sustained pro-inflammatory responses, characterized by transcriptome analysis, cytokine release inducing RORC upregulation, and increased TLR4 surface expression. A double-hit model, involving priming MФ with hyperoxia or hypoxia followed by LPS, revealed exaggerated pro- inflammatory responses in preterm MФ, particularly when primed with hyperoxia. Transcriptome analysis highlighted downregulation of transcription factors Egr2 and Gfi1 in preterm MФ, potentially contributing to their exaggerated response to LPS insult after hyperoxia or hypoxia priming. These findings suggest age-dependent differences in preterm MФ responses to LPS and hyperoxia/hypoxia, implicating their involvement in excessive inflammation in developing lungs, mediated by Egr2 and Gfi1 downregulation [68].
Przybycien-Szymanska MM, et al. [69] explored the enduring effects of adolescent binge alcohol exposure on hypothalamic gene expression patterns in the F1 generation offspring of rats. While maternal alcohol exposure during fetal development is well-documented, less is known about the consequences of parental alcohol exposure outside gestational periods. Adolescent male and female rats were exposed to repeated binge alcohol, then mated in adulthood, with hypothalamic samples from their offspring analyzed at postnatal day 7. Results revealed significant gene expression differences in offspring of alcohol-exposed parents compared to alcohol-naïve parents, particularly in genes mediating neurogenesis, synaptic plasticity, chromatin remodeling, posttranslational modifications, transcription regulation, obesity regulation and reproductive function. Importantly, parents were not intoxicated at mating, and offspring were never directly exposed to alcohol. This suggests that adolescent binge alcohol exposure may have lasting detrimental effects on future offspring, highlighting the potential impact of parental alcohol consumption beyond gestational periods [69].
Chermuła B, et al. [70] was conducted on immature and in vitro matured porcine oocytes to understand genes influencing oocyte maturation and their potential roles in developmental potential and mechanistic pathways. Viable oocytes were selected using the brilliant cresyl blue (BCB) test, and transcriptome analysis was performed using microarrays and RT-qPCR before and after in vitro maturation (IVM). Focus was on genes involved in “Cellular response to hormone stimulus” and “Cellular response to unfolded protein”, crucial for signal transduction during oocyte maturation, with a lower expression level observed after IVM. Ten genes with the highest expression changes were identified: FOS, ID2, BTG2, CYR61, ESR1, AR, TACR3, CCND2, EGR2, and TGFBR3, their potential roles in oocyte maturation discussed in relation to literature sources. Successful oocyte maturation was confirmed via lipid droplet assay. These findings provide a molecular basis for further research aimed at enhancing in vitro maturation methods, essential in assisted reproduction procedures [70].
Systemic lupus erythematosus (SLE) is an autoimmune condition marked by widespread inflammation driven by autoantibodies. Research indicates that Early growth response gene 2 (Egr2), a key transcription factor for T-cell tolerance, plays a crucial role in controlling systemic autoimmunity, alongside LAG3-expressing CD4+ regulatory T cells, known for TGF-β3 production. However, the presence of additional regulators was suggested due to the mild phenotype in lymphocyte-specific Egr2-deficient mice. Morita K et.al; 2016 revealed that both Egr2 and Egr3 expressed in T cells collaboratively suppress humoral immune responses by promoting TGF-β3 secretion. T cell-specific Egr2/Egr3 double-deficient (Egr2/3DKO) mice exhibited severe lupus-like symptoms compared to Egr2-deficient mice, with CD4+CD25−LAG3+ cells from Egr2/3DKO mice losing TGF-β3 production capacity. Yet, adoptive transfer of WT CD4+CD25−LAG3+ cells or TGF-β3 treatment mitigated excessive germinal center reactions. Additionally, Egr2 and Egr3 sustained latent TGF-β binding protein (Ltbp)3 expression crucial for TGF-β3 production by CD4+CD25−LAG3+ cells, while not intrinsically suppressing follicular helper T cell development, underscoring their role in controlling B-cell responses. This insight into Egr2/Egr3 function in T cells holds promise for developing innovative therapies for SLE and related autoimmune diseases [71].
Gomez-Lopez N, et al. [72] viewed as contributors to preterm labor through inflammation, are now proposed to have a protective function during late gestation. This study suggests that insufficient macrophages may increase the risk of spontaneous preterm labor and adverse neonatal outcomes. The research found that women experiencing spontaneous preterm birth exhibited reduced expression of CD209+CD206+ in alternatively activated macrophages and increased TNF expression in proinflammatory macrophages in the uterine decidua. Depletion of maternal CD11b+ myeloid cells in mice led to preterm birth, neonatal death, and growth impairment, while adoptive transfer of WT macrophages prevented preterm birth and partially rescued neonatal loss. In an inflammation-induced preterm birth model, M2- polarized macrophages demonstrated superior capacity to reduce uterine and fetal inflammation, prevent preterm birth, and enhance neonatal survival compared to nonpolarized macrophages. These findings highlight the critical regulatory role of macrophages in late gestation and their involvement in determining susceptibility to spontaneous preterm birth and fetal inflammatory injury [72].
According to Welfley H, et al. [73] 2022 Single-cell genomic techniques offer significant potential in deepening our comprehension of both development and disease, yet a crucial challenge remains in effectively isolating intact cells from primary tissues for analysis. Methods compatible with existing clinical procedures could facilitate longitudinal investigations, the inclusion of large cohorts, and the advancement of novel diagnostic approaches. In an effort to explore the single-cell RNA sequencing (scRNA-seq) profiling of airway luminal cell types in extremely premature (<28 weeks gestation) neonates, cells were extracted from endotracheal aspirates obtained within the first hour post- birth from intubated neonates. Data from 10 subjects yielded a comprehensive insight into airway luminal biology during this critical developmental window, revealing a predominant representation of myeloid differentiation, encompassing fetal monocytes (25% of all cells), intermediate myeloid populations (48% of cells), and macrophages (2.6% of cells). This study marks the first single-cell transcriptomic characterization of human monocytes in neonatal airways isolated within the first hour of birth.
Trajectory analysis of premature neonate myeloid populations delineated two trajectories mirrors the developmental stages of interstitial and alveolar macrophages, alongside a third trajectory indicating a potential alternative pathway linking these terminal macrophage states. Despite sharing numerous dynamic genes (5,451), each trajectory exhibited distinct transcriptional alterations (259 alveolar-specific genes, 666 interstitial- specific genes, and 285 bridging-specific genes). These findings furnish high-quality single-cell data acquired from cells harvested during the critical “golden hour of birth” in extremely premature neonatal airways, thereby illuminating the intricate landscape of lung biology and offering valuable insights for studies of human development and disease [73].
According to Dupré N, et al. [74] Human brain lesions occurring in the perinatal period can lead to lifelong neuro- disabilities, affecting sensory-motor, cognitive, and behavioral functions persistently. The location and nature of these lesions are influenced by the gestational age during insult, impacting subsequent brain development. Research utilizing the Rice-Vannucci procedure in mice revealed distinct transcriptional responses to neonatal hypoxia-ischemia (HI) at different ages (P5 and P10), mirroring preterm and full- term infant stages. Micro-array analysis unveiled age-specific regulations, with early and transient effects observed at P5, while delayed and prolonged responses were noted at P10, predominantly involving inflammation, immunity, apoptosis, and angiogenesis pathways. Notably, a transient repression of cholesterol biosynthesis genes at P5 and specific involvement of interleukin-1 (Il-1) at P10 were highlighted, indicating age- dependent vulnerabilities. The study emphasizes the need for further investigation into the mechanisms underlying these age-related differences, particularly regarding the role of cholesterol biosynthesis genes in white matter vulnerability and the inflammatory response dynamics, offering potential avenues for understanding and potentially mitigating perinatal brain injuries [74].
According to Welfley H, et al. [75] Single-cell genomic technologies offered promise in advancing our comprehension of lung development and diseases, yet accessing intact cells from primary lung tissues remains a challenge for profiling human airway health. Sampling methods like endotracheal aspiration, compatible with clinical interventions, hold potential for longitudinal studies, large cohort enrollment, and diagnostic innovation. Examining single-cell RNA sequencing profiling of airway lumen cells in extremely premature neonates (<28 wk gestation) through endotracheal aspirates collected within the first hour after birth, data from 10 subjects provide insight into airway luminal biology during this critical developmental phase. Results reveal a predominance of myeloid differentiation continuum, comprising fetal monocytes (25% of total), intermediate myeloid populations (48%), and macrophages (2.6%).
Trajectory analysis identifies two consistent developmental stages of interstitial and alveolar macrophages, alongside a third trajectory representing an alternative pathway linking distinct macrophage precursors, sharing numerous dynamic genes but exhibiting distinct transcriptional changes. This exploration of cells within the “golden hour of birth” in extremely premature neonate airways delineates complex lung biology, facilitating studies of human development and disease [75].
Premature infants often suffer from chronic hypoxia, leading to cognitive and motor neurodevelopmental impairments, which may stem from compromised neural precursor cell (NPC) repair and variable central nervous system (CNS) recovery. Investigating two mouse strains, C57BL/6 and CD1, reflecting the spectrum of responsiveness seen in premature humans, we previously correlated CNS tissue and cellular behaviors with behavioral differences. Utilizing unbiased array technology, Li Q, et al. [76] examined the transcriptome of the subventricular zone (SVZ) in these strains. Our findings highlight mRNA expression disparities in the SVZ of both strains post-hypoxia and under normoxic and hypoxic conditions, particularly in gene sets linked to Sox10-mediated neural functions. These differences potentially explain varying cognitive and motor responses to hypoxic insult, aiding our comprehension of variability in premature infants and facilitating early intervention strategies. Further analysis of these gene sets promises a comprehensive understanding of diverse responses to and recovery from hypoxia, enhancing disease severity modeling in this vulnerable population [76].
According to Bouchoucha YX, et al. [77] premature infants frequently experience chronic hypoxia, leading to cognitive and motor neurodevelopmental challenges likely due to compromised neural precursor cell (NPC) repair and variable CNS recovery. By studying two mouse strains, C57BL/6 and CD1, mirroring the diversity of premature human responses, previous research correlated CNS tissue and cellular behaviors with behavioral distinctions. Employing unbiased array technology, we scrutinized the transcriptome of the subventricular zone (SVZ) in these strains, revealing mRNA expression differences post-hypoxia and under normoxic and hypoxic conditions, particularly in gene sets associated with Sox10-mediated neural functions. These variances potentially elucidate diverse cognitive and motor responses to hypoxic insult, enhancing our understanding of prematurity-related variability and supporting early intervention strategies. Further exploration of these gene sets promises a more nuanced comprehension of responses to and recovery from hypoxia, thereby refining disease severity modeling for this vulnerable population [77].
Embryonic development relies on precise regulation by transcription factors and chromatin-associated proteins, where H3K4me3 signals active transcription and H3K27me3 denotes gene repression, with their combination maintaining developmental genes in a flexible state. Albert M, et.al; 2013 revealed that deletion of the H3K4me2/3 histone demethylase Jarid1b (Kdm5b/Plu1) leads to significant neonatal lethality attributed to respiratory failure. Jarid1b knockout embryos exhibit neural defects such as disorganized cranial nerves, impaired eye development, and increased incidences of exencephaly. Notably, there’s a convergence of Jarid1b and Polycomb target genes, as evidenced by homeotic skeletal transformations reminiscent of Polycomb mutants, indicating functional crosstalk between Polycomb proteins and Jarid1b. Through genome-wide analysis of histone modifications, we found that normally inactive genes encoding developmental regulators acquire aberrant H3K4me3 during early embryogenesis in Jarid1b knockout embryos, progressively accumulating as development proceeds, thereby upregulating expression of neural master regulators like Pax6 and Otx2 in Jarid1b knockout brains. Collectively, these findings suggest that Jarid1b regulates mouse development by safeguarding developmental genes from inappropriate acquisition of active histone modifications [78].
According to Maeda N, et al. [79] at the weaning stage, mammals transition from breastfeeding to consuming foods from their environment, exposing them to novel tastes and textures for the first time. This shift in diet may impact the cognitive brain function of young mammals, influencing their reactions to food environments. Focusing on the cerebral cortex, crucial for cognition and learning, we conducted microarray analysis on mouse cortical gene expression before and after weaning, identifying 35 upregulated and 31 downregulated genes out of 45,037 murine genes. Specifically, immediate early genes, molecular chaperones, and myelin- related genes showed upregulation. In situ hybridization analysis revealed mRNA transport of an immediate early gene, Egr-2/KROX-20, from the nucleus to the cell body in the somatosensory cortex during weaning, contrasting with animals exclusively fed mother’s milk, where Egr-2/KROX-20 mRNA remained in the nucleus. These findings suggest that the introduction of solid foods during weaning modulates gene expression profiles in the mouse cerebral cortex, potentially influencing cognitive responses to food intake [79].
Nguyen HD, et al. [80] aimed to elucidate the interaction between mixed heavy metals (cadmium, lead, and mercury) and genes, transcription factors (TFs), and microRNAs (miRNAs) implicated in metabolic syndrome (MetS) and cognitive impairment. Through analysis, essential biological pathways including oxidative stress, altered lipoprotein metabolism, atherosclerosis, apoptosis, IL-6 signaling, and Alzheimer’s disease were highlighted, with CASP3, BAX, BCL2, IL6, TNF, APOE, HMOX1, and IGF identified as mutually affected genes by the heavy metal mixture, suggesting their significance in these conditions. Key TFs EGR2, ATF3, and NFE2L2 were implicated in the etiology of MetS and cognitive impairment, while six miRNAs induced by heavy metals were found to be linked to these conditions. Notably, miRNA sponges constructed for these miRNAs show promise as potential therapeutic interventions for MetS and cognitive impairment [80].
Extensive molecular coordination is essential for the histogenesis of the auditory system, with recent studies highlighting the significance of Dicer1, a gene crucial for microRNA generation, and miR-96 in peripheral auditory system development. Rosengauer E et.al; 2012 delved into their roles in the formation of the auditory brainstem. Early embryonic ablation of Dicer1 through Egr2::Cre-mediated deletion severely disrupted auditory brainstem structures, notably resulting in a 73.5% reduction in the volume of the cochlear nucleus complex (CNC), primarily due to the absence of the micro neuronal shell. However, fusiform cells, derived from Egr2 positive cells, remained intact. Reduction in CNC volume was evident at birth (67.2% decrease), with the superior olivary complex also significantly affected, exhibiting absence of principal nuclei like the medial nucleus of the trapezoid body and the lateral superior olive. Instead, densely packed choline acetyltransferase positive neurons of the olivocochlear bundle were observed. Mid-embryonic ablation of Dicer1 in the ventral cochlear nucleus resulted in normal CNC formation, suggesting an early embryonic requirement of Dicer1. Quantitative RT-PCR analysis revealed low miR-96 expression in the embryonic brainstem, increasing thereafter, indicating the involvement of other micro RNAs in auditory brainstem histogenesis. Overall, these findings underscore the critical role of Dicer activity during embryonic development of the auditory brainstem [81].
Ng SF, et al. [82] examined the impact of paternal high- fat diet (HFD) consumption on offspring, previous findings revealed β-cell dysfunction in female rat offspring alongside transcriptome alterations in pancreatic islets. Here, the investigation extends to the retroperitoneal white adipose tissue (RpWAT) transcriptome, employing gene and pathway enrichment analyses to identify shared network topologies between these metabolically related tissues. In RpWAT, 5108 genes were differentially expressed due to paternal HFD, with significantly enriched networks including mitochondrial and cellular stress response, telomerase signaling, cell death/ survival, cell cycle, cellular growth/proliferation, and cancer pathways.
Notably, 187 adipose olfactory receptor genes were down-regulated. Comparison with islet transcriptome data revealed common gene networks and pathways, including olfactory receptor genes, suggesting shared molecular responses to programmed systemic factors or tissue crosstalk. Of particular interest is the identification of a common molecular network involving cell cycle and cancer pathways, with the hub gene Myc, indicating potential early onset developmental changes or persistent responses to paternal HFD consumption in both RpWAT and pancreatic islets of female offspring. These findings suggest that paternal HFD triggers unique gene signatures associated with premature aging and chronic degenerative disorders in both RpWAT and pancreatic islets of female offspring [82].
According to Hadley KB, et al. [83] Arachidonic acid (ARA, 20:4n-6), derived from linoleic acid (LA, 18:2n-6), is a vital component of infant development, consistently present in human milk and crucial for various bodily functions. Infants rely on preformed ARA from milk or formula as their synthetic pathways alone cannot meet metabolic demands. ARA serves as a precursor to eicosanoids, essential for immunity and immune response. Extensive evidence from animal and human studies underscores ARA’s critical role in infant growth, brain development, and overall health, emphasizing the need to balance ARA and DHA levels as excess DHA may diminish ARA’s benefits. Infant formulas have incorporated both ARA and DHA for over two decades, with discussions on the required amounts and ratios based on comprehensive scientific reviews [83].
According to Hadziselimovic F, et al. [84] The gonadotropin-releasing hormone agonist (GnRHa; Buserelin) treatment rescues fertility in the majority of cryptorchid boys at high infertility risk, who exhibit defective mini-puberty, yet the molecular mechanisms driving this effect remain unclear. In this study, we conducted RNA profiling analysis of testicular biopsies from operated patients treated with GnRHa for 6 months compared to untreated controls. GnRHa treatment elicited a significant transcriptional response, involving protein-coding genes crucial for pituitary development, the hypothalamic-pituitary-gonadal axis, and testosterone synthesis. Additionally, we observed increased expression of long noncoding RNAs (lncRNAs) implicated in epigenetic processes, including AIRN, FENDRR, XIST, and HOTAIR. These findings support the notion that hypogonadotropic hypogonadism in boys with altered mini-puberty stems from a profoundly altered gene expression program involving both protein-coding genes and lncRNAs. Our results shed light on the molecular mechanisms underlying the fertility-rescuing ability of GnRHa [84].
According to Somm E, et al. [85] Intrauterine growth restriction (IUGR), characterized by poor fetal growth, poses a significant global health concern due to its association with increased perinatal mortality and heightened risk of chronic metabolic diseases later in life, such as obesity, type 2 diabetes, and metabolic syndrome, attributed to “metabolic programming.” To elucidate early alterations in metabolic programming, we utilized rat models of IUGR induced by prenatal exposure to synthetic glucocorticoid (DEX) or prenatal undernutrition (UN). Through a combination of physiological, morphometric, and transcriptomic analyses focusing on endocrine pancreas and adipose tissue development during early life, we observed that IUGR pups, without prior catch-up growth, exhibited basal hyperglycemia, reduced glucose tolerance, and pancreatic islet atrophy. Model-specific metabolic defects included decreased insulin sensitivity in DEX pups and diminished glucose-induced insulin secretion and pronounced alterations in gene expression related to pancreatic islet and adipose tissue development in UN pups. These findings underscore the presence of early physiologic, morphologic, and transcriptomic defects in IUGR rats before any catch-up growth, serving as foundational mechanistic insights into metabolic programming [85]. Material and Methods
Study Design
This study, titled “Evaluation of the Expression of the EGR2 Gene in Term Low Birth Weight Newborns,” was conducted as a prospective observational study. The primary objectives were to evaluate the role of the EGR2 gene in term low birth weight (LBW) newborns and to identify various risk factors associated with LBW.
Study Population
The study population comprised full-term newborns (gestational age ≥ 37 weeks) who were categorized into two groups: normal birth weight (NBW) newborns and low birth weight (LBW) newborns. A total of 42 newborns were included in the study, with 21 in each group.
Inclusion Criteria
- Full-term newborns (gestational age ≥ 37 weeks).
- Birth weight categorized into NBW (≥ 2500 grams) as controls and LBW (<2500 grams) as cases
Exclusion Criteria
- Non pregnant females
- All preterm births and post term births
- Females delivering baby to large for gestational age
- Females with complications such as multiple pregnancies, abnormal fetal karyotypes, Newborns with congenital anomalies.
- History of any autoimmune diseases
- Maternal diseases like diabetes ,kidney disease and hypertension
- Maternal disease like HIV, Hep B, Hep C, Syphilis
Sample Collection
I have myself collected the sample in LR/MCH OT, Cord blood samples (10 ml) were collected from 42 full-term newborns (21 NBW and 21 LBW) in sterile tubes containing non-pyrogenic anti-coagulant heparin. The samples were collected at the Department of Obstetrics and Gynaecology, Institute of Medical Sciences, Banaras Hindu University, after obtaining informed and written consent from the parents. The birth weight of newborns was measured immediately after birth.
Detailed information about the mother and her baby was collected using a predesigned questionnaire, which included data on maternal age, socioeconomic status, gestational age, obstetric history, presence of pallor, and occurrence of premature rupture of membranes (PROM).
RNA Extraction from Cord Blood Samples
Total RNA was extracted from 1 ml of cord blood using the TRI reagent following the Phenol-Chloroform method as per the manufacturer’s protocol:
- 1 ml cord blood was mixed with 1 ml TRI reagent and vortexed vigorously.
- 200 µl of chloroform was added, and the mixture was shaken for 15 seconds.
- The sample was centrifuged at 12000g for 15 minutes at 4ºC, followed by a 15-minute incubation.
- The upper aqueous phase was collected in a separate Eppendorf tube.
- 500 µl isopropanol was added, and the sample was mixed gently.
- After standing for 10 minutes at room temperature, the sample was centrifuged at 12000g for 10 minutes at 4ºC.
- The RNA pellet was washed with 1 ml of 75% ice-cold ethanol and centrifuged at 12000g for 5 minutes at 4ºC.
- Ethanol was removed, and the pellet was air-dried.
- 10 µl of nuclease-free water was added to dissolve the RNA pellet. One-Step Real-Time PCR Quantification of RNA was performed using a Nanodrop spectrophotometer. For real-time PCR, the One Step TB Green® PrimeScript™ RT-PCR Kit II (Perfect Real Time) was used according to the manufacturer’s protocol. The master mix for each gene was prepared separately, excluding RNA. The reactions were set up in duplicates for each gene with all samples.
Master Mix Composition (per reaction)
- 2X One Step TB Green RT-PCR Buffer 4: 10 µl
- Prime Script 1 step Enzyme Mix 2: 0.8 µl
- PCR Forward Primer (10 µM): 0.8 µl
- PCR Reverse Primer (10 µM): 0.8 µl
- Total RNA: 0.5 µg
- RNase-Free dH2O: 5.6 µl
- Total Volume: 20 µl After mixing all components, the PCR tubes were gently spun down and set for quantitative real-time analysis. The real-time amplification was performed on the Quant Studio 5 PCR system with the following PCR conditions:
PCR Conditions:
PCR Conditions: 1. Reverse Transcription • 42ºC for 5 minutes • 95ºC for 10 seconds 2.PCR Reaction (40 Cycles) • 95ºC for 5 seconds • 60ºC for 34 seconds 3. Melting Curve Analysis • 95ºC for 15 seconds • 65ºC for 1 minute • 95ºC for 15 seconds
Primer Details
Primers Used
- Early Growth Response 2 (EGR2) Forward Primer: ACCACCTCACCACCCATATC
- Early Growth Response 2 (EGR2) Reverse Primer: ACTTTCGGCCACAGTAGTCA Data Analysis Quantitative data were expressed as mean ± standard deviation (SD), and differences between the two groups were tested using Student’s t-test. A p-value of less than 0.05 was considered statistically significant. Statistical analysis was performed using Graph Pad version 10.1.
Statistical Methods
- Student’s t-test: Used to compare means between two groups.
- Chi-Square Test: Applied to assess the association between categorical variables.
- ANOVA (Analysis of Variance): Utilized for comparing means among multiple groups.
- F-Statistic: Used to compare variances and assess the overall significance of the model. Observation and Results
Title
Evaluation of the expression EGR2 gene in term low birth weight newborns
Objective
- To evaluate the role of the expression of EGR2 Gene in Term LBW New-borns
- To study the various risk factors for LBW New-borns
Sample Size
- Total number of cases (LBW): 21
- Total number of controls (NBW): 21
| Age group | Number of Cases (n=21) | Number of Controls (n=21) |
|---|---|---|
| ≤20 | 1 | 1 |
| 20-25 | 4 | 2 |
| 25-30 | 12 | 13 |
| ≥30 | 4 | 5 |
| Total | 21 | 21 |
Table 1: Age Distribution.
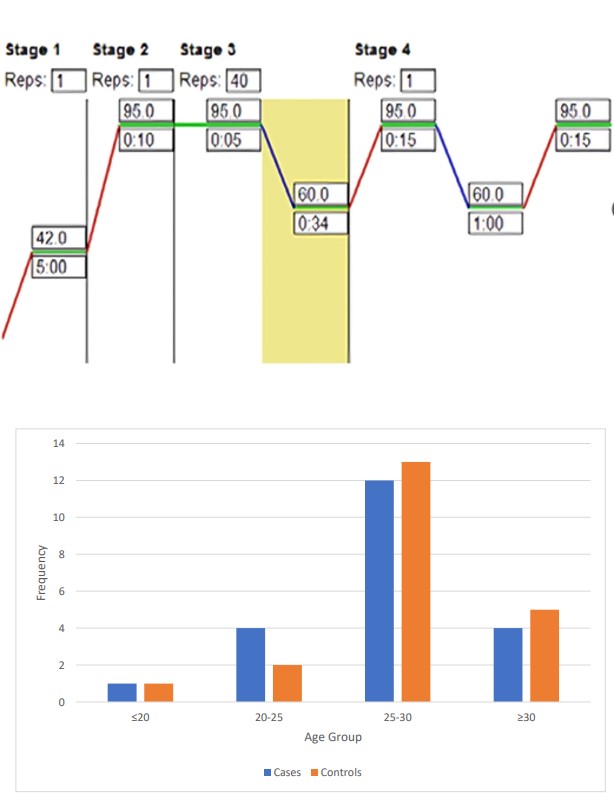
Figure 7a: Age Distribution.
The bar chart depicts the frequency distribution of cases and controls across different age groups in a study with 21 cases and 21 controls. The age groups are categorized as ≤20, 20-25, 25-30, and ≥30. In the ≤20 age group, both cases and controls have a frequency of 1 each. In the 20-25 age group, there are 4 cases compared to 2 controls. The 25-30 age group has the highest frequency, with 12 cases and 13 controls.
In the ≥30 age group, there are 4 cases and 5 controls. The distribution indicates that the majority of both cases and controls fall within the 25-30 age group, suggesting a higher prevalence of the studied condition or characteristic in this age range. The frequencies are relatively balanced between cases and controls in each age group, with slight variations.
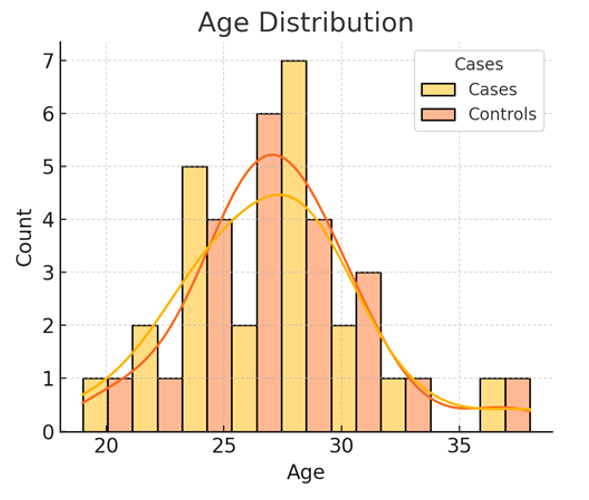
Figure 7b: Shows the Age Range Distribution in Both Groups. The histogram and overlaid density plots depict the age distribution of cases and controls in a study. The counts of individuals are plotted against their ages, with cases shown in yellow and controls in orange. The distribution shows that both cases and controls are most commonly found between the ages of 25 and 30, with a peak count of 7 cases and 6 controls in the age group around 28-30 years. The distribution curves indicate a similar pattern for both groups, with a slightly higher concentration of cases in the 25-30 age range compared to controls. There is a noticeable drop in the number of individuals above age 30 for both groups, and very few individuals below age 20. This suggests that the majority of the studied condition or characteristic is prevalent in the mid to late twenties age group for both cases and controls, with a balanced distribution overall.
| Socio-economic Status | Lower Class | Lower Middle | Upper Class | Upper Lower | Upper Middle | Total |
|---|---|---|---|---|---|---|
| Cases | 3 | 3 | 3 | 7 | 5 | 21 |
| Controls | 3 | 3 | 3 | 7 | 5 | 21 |
| Total | 6 | 6 | 6 | 14 | 10 | 42 |
Table 2: Socio-economic Status Distribution.
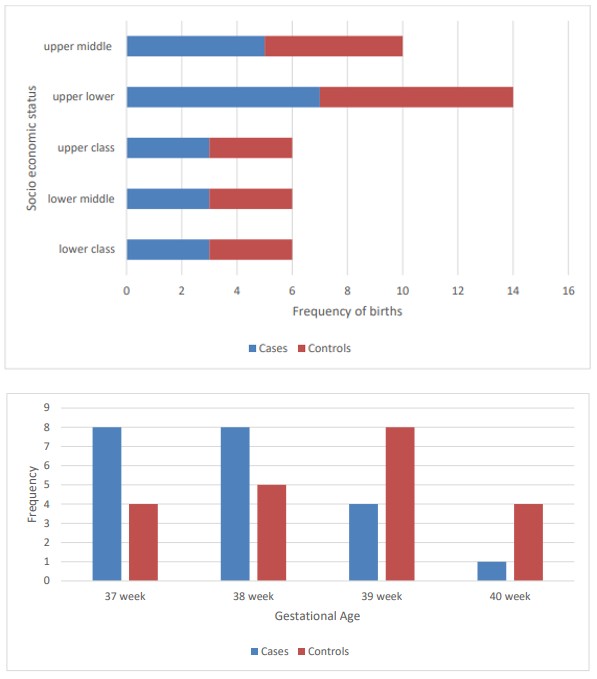
The horizontal bar chart and accompanying table display the distribution of cases (low birth weight newborns) and controls (normal birth weight newborns) across different socio-economic statuses: lower class, lower middle, upper class, upper lower, and upper middle. Each socio-economic status category has an equal number of cases and controls, with three in the lower class, lower middle, and upper class categories, and seven in the upper lower category, and five in the upper middle category. The chart shows that there is no significant difference in the distribution of cases and controls across different socio-economic statuses, indicating that socio-economic status may not be a strong differentiating factor for low birth weight in this sample. Both groups are evenly represented across all socio-economic categories.
| Gestational Age | 37 week | 38 week | 39 week | 40 week | Total |
|---|---|---|---|---|---|
| Cases | 8 | 8 | 4 | 1 | 21 |
| Controls | 4 | 5 | 8 | 4 | 21 |
Table 3: Gestational Age Distribution.
Figure 9a: Gestational Age Distribution.
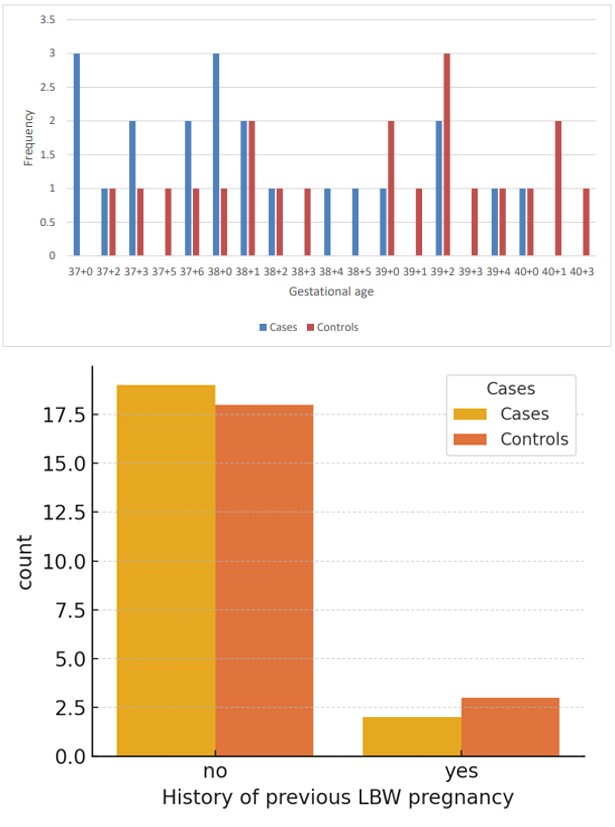
Figure 9b: Gestational Age Distribution.
The bar chart and table display the frequency distribution of cases (low birth weight newborns) and controls (normal birth weight newborns) across different gestational ages: 37 weeks, 38 weeks, 39 weeks, and 40 weeks. The data shows that a higher number of cases are associated with earlier gestational ages, with the highest frequencies at 37 weeks (8 cases) and 38 weeks (8 cases). In contrast, the controls are more evenly distributed across the gestational ages, with the highest frequency at 39 weeks (8 controls). There is a notable decrease in the number of cases as gestational age increases, with only 1 case at 40 weeks compared to 4 controls. This suggests that shorter gestational age is associated with a higher likelihood of low birth weight, highlighting the importance of gestational age as a risk factor for low birth weight.
| LBW Pregnancy history | No | Yes | Total |
|---|---|---|---|
| Cases | 19 | 2 | 21 |
| Controls | 18 | 3 | 21 |
Table 4: History of Previous LBW Pregnancy Distribution.
The bar chart and table illustrate the distribution of cases (low birth weight newborns) and controls (normal birth weight newborns) based on the mother’s history of previous low birth weight (LBW) pregnancies. The majority of both cases and controls have no history of previous LBW pregnancies, with 19 cases and 18 controls. Only a small number of both cases (2) and controls (3) have a history of previous LBW pregnancies. This distribution suggests that a history of previous LBW pregnancies is not a predominant factor in this sample, as most cases and controls do not have such a history. The similarity in distribution between cases and controls indicates that, within this dataset, having a history of previous LBW pregnancies does not significantly differentiate the likelihood of having a low birth weight newborn.
| Pallor Distribution | Absent | Present | Total |
|---|---|---|---|
| Cases | 14 | 7 | 21 |
| Controls | 14 | 7 | 21 |
Table 5: Pallor Distribution.
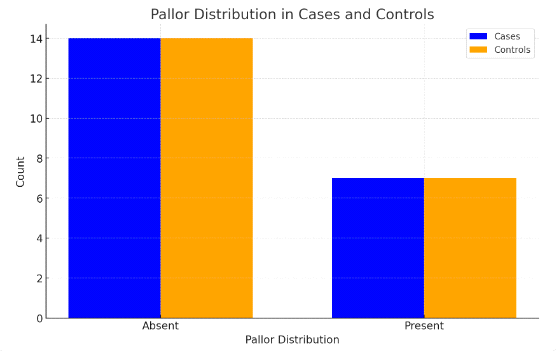
The bar chart and table illustrate the distribution of cases (low birth weight newborns) and controls (normal birth weight newborns) based on the presence of pallor in the mother. Both groups, cases and controls, have an equal distribution with 14 mothers having no pallor and 7 mothers having pallor. This equal distribution indicates that the presence or absence of pallor does not differ between cases and controls in this sample. Consequently, pallor does not appear to be a significant differentiating factor for low birth weight in this dataset, as its presence is evenly distributed among both low birth weight and normal birth weight newborns.
| PROM | Absent | Present | Total |
|---|---|---|---|
| Cases | 10 | 11 | 21 |
| Controls | 7 | 14 | 21 |
Table 6: Presence or Absence of Premature Rupture of Membranes (PROM) Distribution.
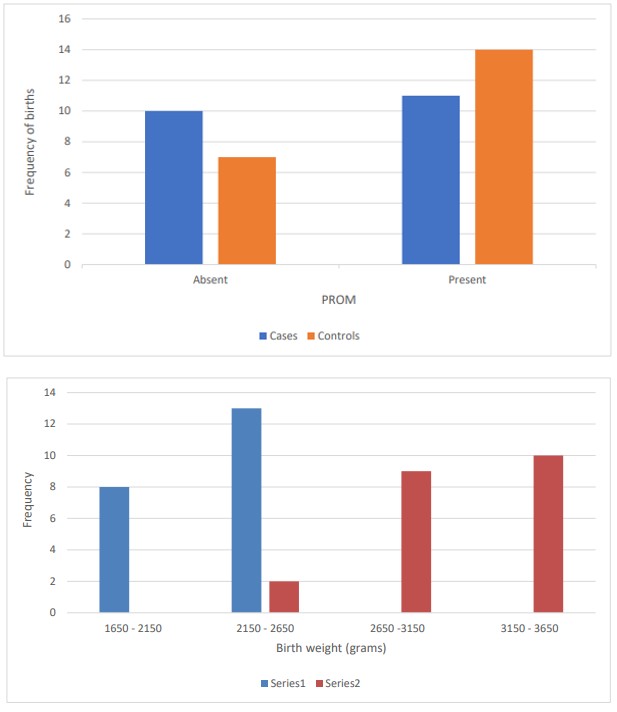
The bar chart and table show the distribution of cases (low birth weight newborns) and controls (normal birth weight newborns) based on the presence of PROM (Premature Rupture of Membranes). Among the cases, 10 had PROM absent and 11 had PROM present. In contrast, among the controls, 7 had PROM absent and 14 had PROM present. This data suggests that PROM is more frequently present in the control group compared to the cases. The higher frequency of PROM in the controls compared to the cases implies that PROM presence is not strongly associated with an increased risk of low birth weight in this sample. In fact, more cases of low birth weight occurred when PROM was absent rather than present. This indicates that PROM might not be a significant factor in predicting low birth weight in this dataset.
| Birth Weight (grams) | 1650 - 2150 | 2150 - 2650 | 2650 -3150 | 3150 - 3650 | Total |
|---|---|---|---|---|---|
| Cases (LBW) | 8 | 13 | 0 | 0 | 21 |
| Controls (NBW) | 0 | 2 | 9 | 10 | 21 |
Table 7: Birth Weight Distribution.
Figure 13a: Birth Weight Distribution.
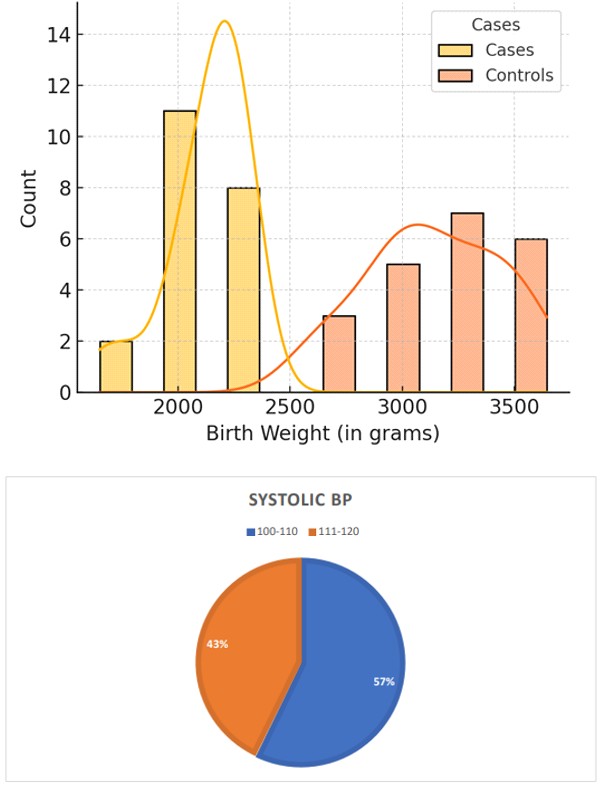
Figure 13b: Birth Weight Distribution.
The two visualizations and table present the distribution of birth weights (in grams) for cases (low birth weight newborns) and controls (normal birth weight newborns).
The first bar chart divides birth weights into four ranges: 1650-2150, 2150-2650, 2650-3150, and 3150-3650 grams. The majority of cases are in the 2150-2650 grams range (13 cases) and 1650-2150 grams range (8 cases), with no cases above 2650 grams. In contrast, the controls are predominantly in the 3150-3650 grams range (10 controls) and the 2650-3150 grams range (9 controls), with very few controls below 2650 grams. The second combined bar and This distribution clearly indicates that low birth weight newborns (cases) fall within the lower birth weight ranges, while normal birth weight newborns (controls) occupy the higher birth weight ranges. This highlights the distinct separation in birth weight distributions between the two groups.
density plot reinforces these findings. Cases are concentrated at lower birth weights, primarily between 1650 and 2650 grams, with a peak around 2150 grams. Controls are concentrated at higher birth weights, mostly between 2650 and 3650 grams, with peaks around 3150 grams and above.
| Systolic BP | 100-110 | 111-120 | Total |
|---|---|---|---|
| Cases | 12 | 9 | 21 |
| Controls | 11 | 10 | 21 |
Table 8: Systolic BP Distribution.
The pie chart and accompanying table display the distribution of systolic blood pressure (BP) readings among cases (low birth weight newborns) and controls (normal birth weight newborns) divided into two categories: 100- 110 mmHg and 111-120 mmHg. According to the data, 57% of the mothers fall into the 100-110 mmHg range while 43% fall into the 111-120 mmHg range. Specifically, within the cases group, 12 mothers have systolic BP between 100-110 mmHg, and 9 mothers have systolic BP between 111-120 mmHg. Among the controls, 11 mothers have systolic BP between 100-110 mmHg, and 10 mothers have systolic BP between 111-120 mmHg. The distribution is fairly similar between the two groups, indicating that systolic BP in the given ranges does not significantly differentiate between cases and controls. The nearly equal distribution suggests that systolic BP might not be a strong independent predictor of low birth weight in this sample.
| Diastolic BP | 60-70 | 71-80 | Total |
|---|---|---|---|
| Cases | 8 | 13 | 21 |
| Controls | 10 | 11 | 21 |
Table 9: Diastolic BP distribution.
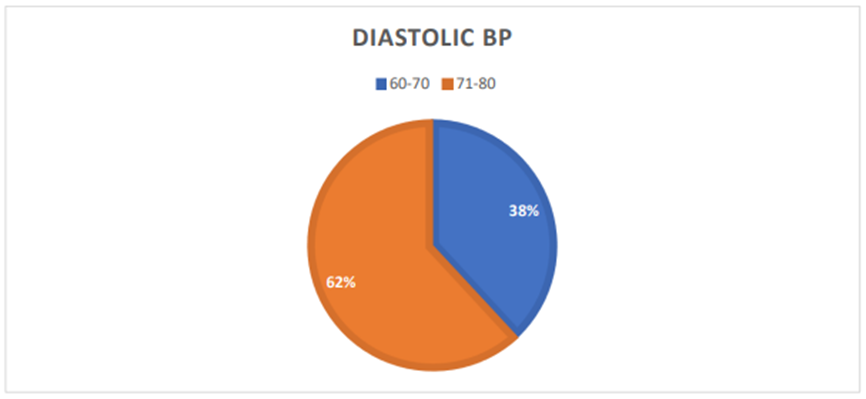
The pie chart and accompanying table display the distribution of diastolic blood pressure (BP) readings among cases and controls divided into two categories: 60-70 mmHg and 71-80 mmHg. The pie chart shows that 38% of the mothers have diastolic BP in the range of 60-70 mmHg, while 62% fall into the 71-80 mmHg range. Specifically, within the cases group, 8 mothers have diastolic BP between 60-70 mmHg, and 13 mothers have diastolic BP between 71-80 mmHg. Among the controls, 10 mothers have diastolic BP
Obstetric History
between 60-70 mmHg, and 11 mothers have diastolic BP between 71-80 mmHg. The distribution is relatively similar between the two groups, indicating that diastolic BP in the given ranges does not significantly differentiate between cases and controls. This suggests that diastolic BP might not be a strong independent predictor of low birth weight in this sample, as the proportions are comparable for both cases and controls.
| Gravida score | 1 | 2 | 3 | 4 | Total |
|---|---|---|---|---|---|
| Cases | 6 | 10 | 5 | 0 | 21 |
| Controls | 6 | 10 | 3 | 2 | 21 |
Table 10a: Distribution of Gravida Score.
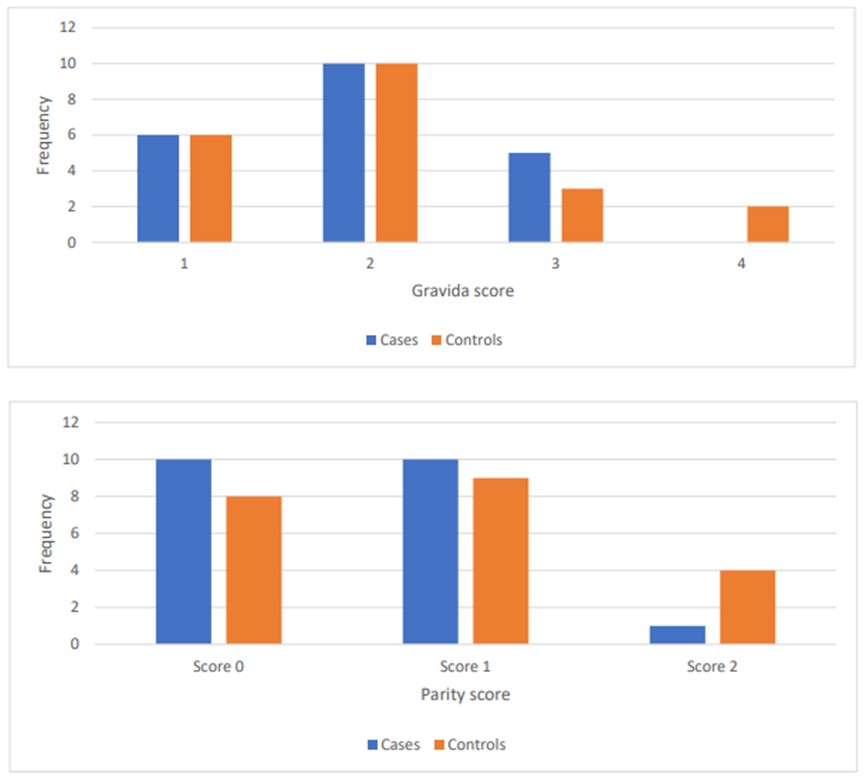
Figure 16a: Distribution of Gravida Score.
The bar chart and table illustrate the distribution of gravida scores among cases and controls. Gravida score represents the number of pregnancies a woman has had. For gravida score 1, both groups show an equal frequency of 6. For gravida score 2, both cases and controls also have an equal frequency of 10. However, for gravida score 3, there are 5 cases compared to 3 controls, indicating a higher frequency among cases. For gravida score 4, there are no cases but 2 controls. The total number of cases and controls is equal at 21 each. This data suggests that higher gravida scores (3 and 4) are more frequent in controls compared to cases, indicating a potential relationship between the number of pregnancies and the condition being studied.
| Parity score | 0 | 1 | 2 |
|---|---|---|---|
| Cases | 10 | 10 | 1 |
| Controls | 8 | 9 | 4 |
Table 10b: Distribution of Parity Score.
Figure 16b: Distribution of Parity Score.
The bar chart and accompanying table illustrate the frequency distribution of parity scores among two groups: cases and controls. The parity score indicates the number of times a woman has given birth. For parity score 0, 10 cases and 8 controls are observed. For parity score 1, both cases and controls show nearly equal frequencies, with 10 cases and 9 controls. However, for parity score 2, there is a significant difference: only 1 case is observed compared to 4
controls. This data suggests that higher parity scores (score 2) are less frequent among cases than controls, indicating a possible relationship between parity and the condition being studied.
| Live Issue score | Score 0 | Score 1 | Score 2 |
|---|---|---|---|
| Cases | 11 | 10 | 0 |
| Controls | 11 | 8 | 2 |
Table 12: Distribution of APGAR Score.
Table 10c: Distribution of Live Issue Score.
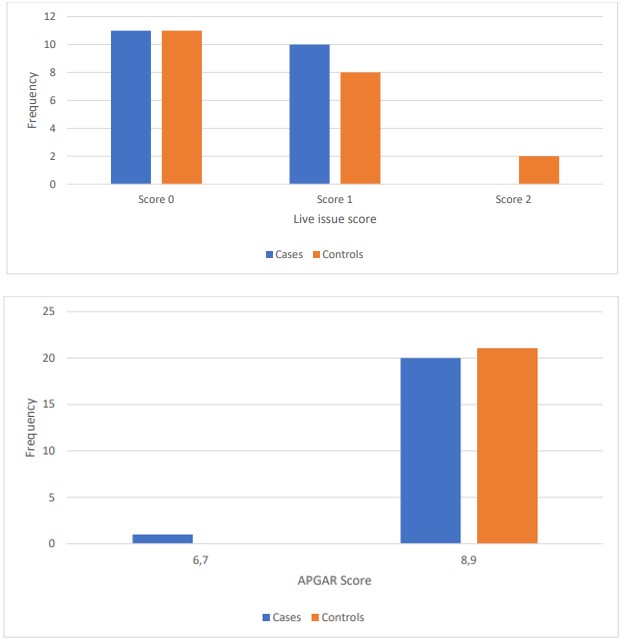
Figure 16c: Distribution of Live Issue Score.
The bar chart and table present the distribution of live issue scores among cases and controls. The live issue score reflects the number of live births. For score 0, both groups have an equal frequency of 11. For score 1, there are 10 cases and 8 controls, indicating a slightly higher frequency in the case group. In contrast, for score 2, there are no cases but 2 controls. This distribution suggests that higher live issue scores (score 2) are absent among cases but present among controls, indicating a potential association between the number of live births and the condition being studied.
| APGAR sore | 6,7 | 8,9 |
|---|---|---|
| Cases | 1 | 20 |
| Controls | 0 | 21 |
Table 13: Distribution of APGAR Score.
The bar chart and table display the distribution of APGAR scores among cases and controls. The APGAR score is a measure of a newborn’s health, with higher scores indicating better health. For scores 6 and 7, there is only 1 case and no controls. For scores 8 and 9, there are 20 cases and 21 controls, indicating a high frequency of good health in both groups. This data suggests that the majority of both cases and controls have high APGAR scores (8 and 9), indicating generally good health at birth, with only a minimal difference between the two groups.
| Descriptive statistics | Age | Gestational Age | Pulse Rate | Birth Weight (in grams) | Systolic BP | Diastolic BP | Gravida | Parity | Live Issue |
|---|---|---|---|---|---|---|---|---|---|
| Count | 42 | 42 | 42 | 42 | 42 | 42 | 42 | 42 | 42 |
| Mean | 27.19 | 38.24 | 83.19 | 2639.36 | 110.29 | 72.29 | 2 | 0.69 | 0.52 |
| Std | 3.76 | 1.01 | 11.66 | 564.81 | 7.01 | 6.13 | 0.83 | 0.68 | 0.59 |
| Min | 19 | 37 | 60 | 1650 | 100 | 60 | 1 | 0 | 0 |
| Median | 27 | 38 | 86 | 2495 | 110 | 74 | 2 | 1 | 0 |
| Max | 38 | 40 | 102 | 3645 | 120 | 80 | 4 | 2 | 2 |
Table 14: Descriptive Statistics for Various Parameters.
The descriptive statistics provide an overview of the dataset, including measures such as mean, standard deviation, and quartiles for each continuous variable.
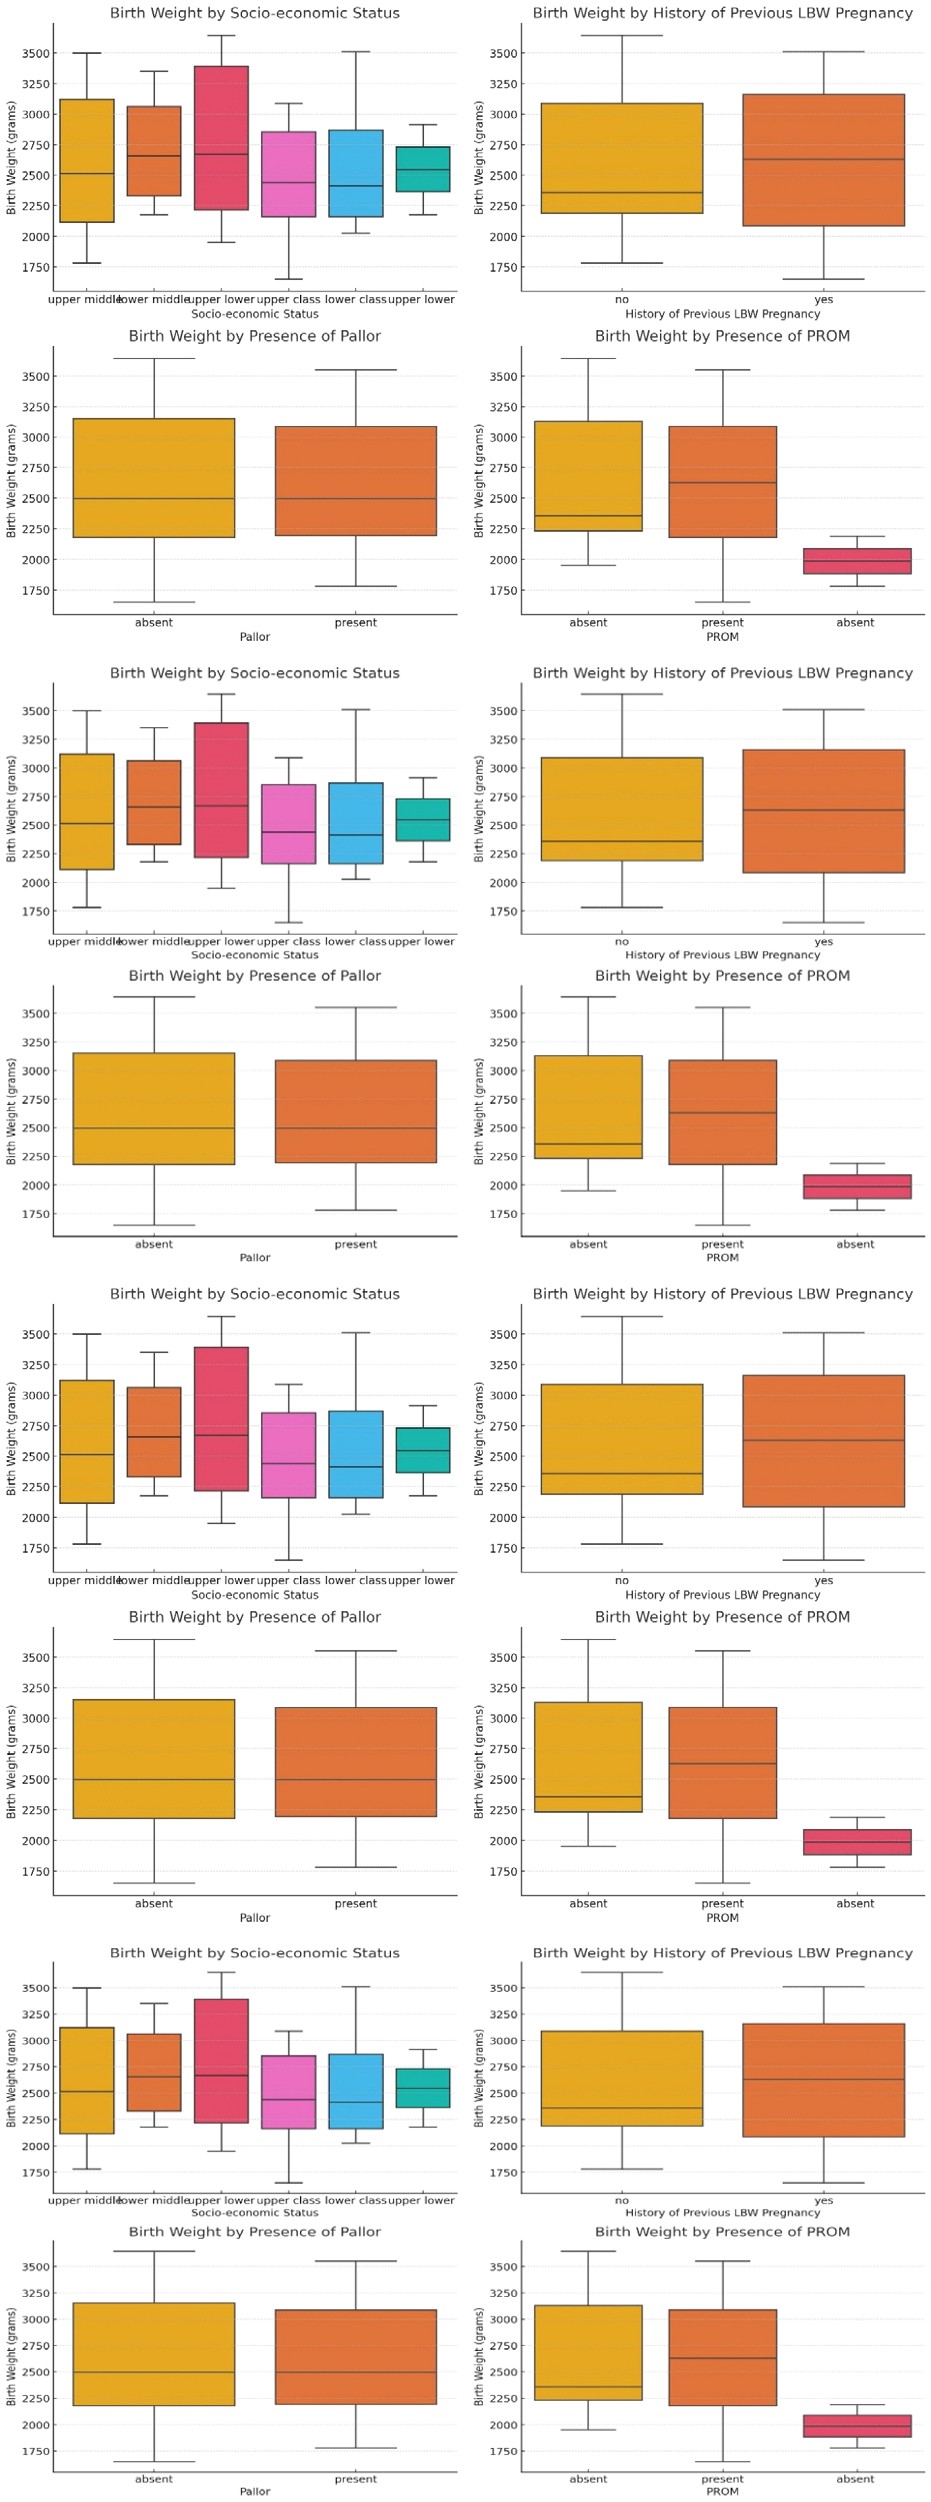
Figure 18a : Birth Weight by Socio-Economic Status.
Figure 18b : Birth Weight by History of Previous LBW Pregnancy.
Figure 18c : Birth Weight by Presence of Pallor.
Figure 18d : Birth Weight by Presence of PROM. The box plots in the image display the distribution of birth weight (in grams) across various categorical factors: socio-economic status, history of previous low birth weight (LBW) pregnancy, presence of pallor, and presence of PROM (Premature Rupture of Membranes).
• Socio-economic Status: There is noticeable variability in birth weights across different socio-economic groups, but no clear trend indicating a particular socio-economic status is associated with higher or lower birth weights. • History of Previous LBW Pregnancy: Birth weights are slightly higher in mothers with a history of previous LBW pregnancies compared to those without, although the overlap in distributions suggests no strong differentiation. • Presence of Pallor: The presence or absence of pallor does not show a significant impact on birth weight, as the median and distribution are similar for both groups. • Presence of PROM: Birth weights for cases with PROM are distinctly lower compared to those without PROM, suggesting a notable impact of PROM on reducing birth weight.
Overall, while socio-economic status and history of previous LBW pregnancies show some variability, the presence of PROM appears to have a more pronounced effect on reducing birth weight.
| Parameters | Correlation coefficient |
|---|---|
| Birth Weight (in grams) | 1 |
| Gestational Age | 0.31 |
| Pulse Rate | 0.14 |
| Parity | 0.1 |
| Age | 0.1 |
| Gravida | 0 |
| Live Issue | 0 |
| Diastolic BP | -0.04 |
| Systolic BP | -0.11 |
Table 15: Correlation Analysis.
The correlation analysis shows the relationship between birth weight and other continuous variables. The key findings are:
- Gestational Age has the highest positive correlation with birth weight (0.309), suggesting that longer gestation is associated with higher birth weight.
- Pulse Rate, Parity, and Age have weak positive correlations with birth weight.
- Gravida, Live Issue, Diastolic BP, and Systolic BP have very weak or negative correlations with birth weight.
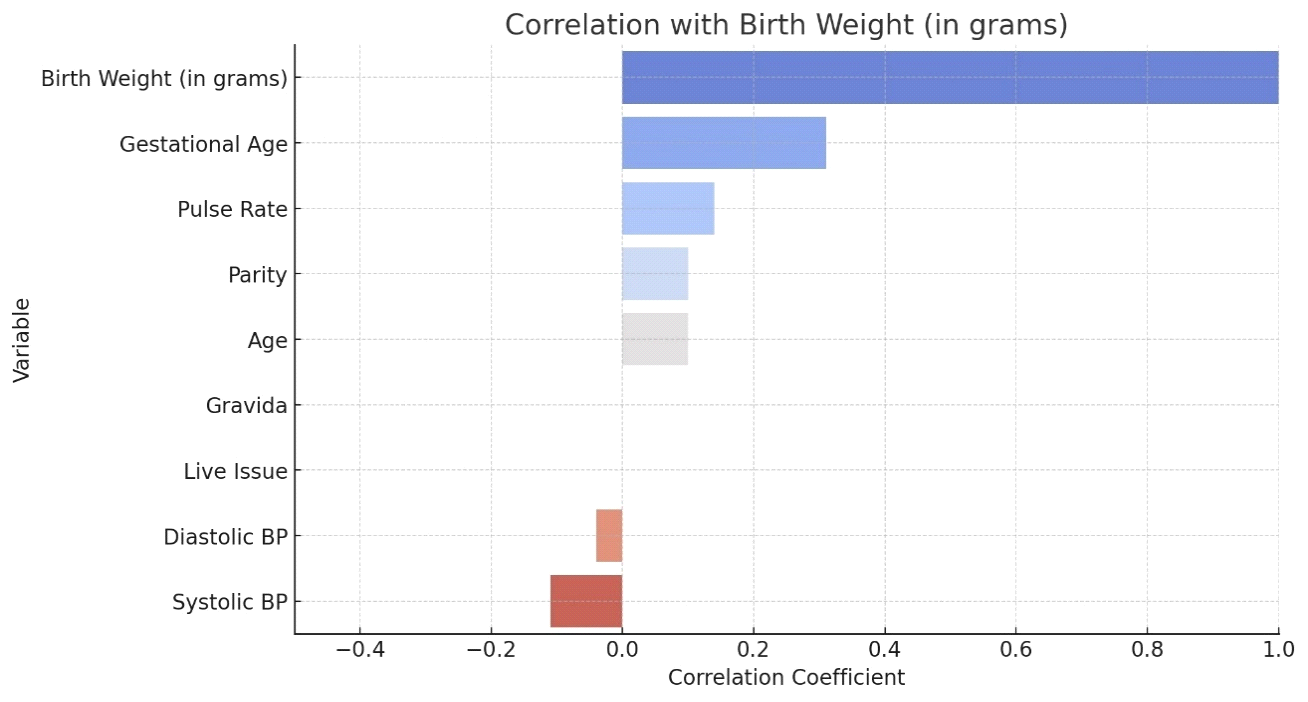
Figure 19a: Correlation Aanalysis.
The bar plot visually represents the correlation coefficients between various variables and birth weight. Each bar’s length indicates the strength and direction of the correlation, with positive values indicating a direct relationship and negative values indicating an inverse relationship.
The bar chart displays the correlation coefficients between various variables and birth weight (in grams). Birth weight shows a perfect positive correlation with itself (correlation coefficient = 1.0), as expected. Gestational age has the highest positive correlation with birth weight (approximately 0.6), indicating that longer gestation periods are strongly associated with higher birth weights. Pulse rate and parity also show positive correlations, albeit weaker, suggesting some association with birth weight. Age and gravida show very weak positive correlations, indicating minimal influence on birth weight. Conversely, live issue, diastolic blood pressure (BP), and systolic BP have negative correlations with birth weight, with diastolic BP showing a moderate negative correlation (approximately -0.2) and systolic BP showing a weaker negative correlation. These results suggest that higher blood pressure readings may be associated with lower birth weights. Overall, gestational age appears to be the most significant factor positively affecting birth weight.
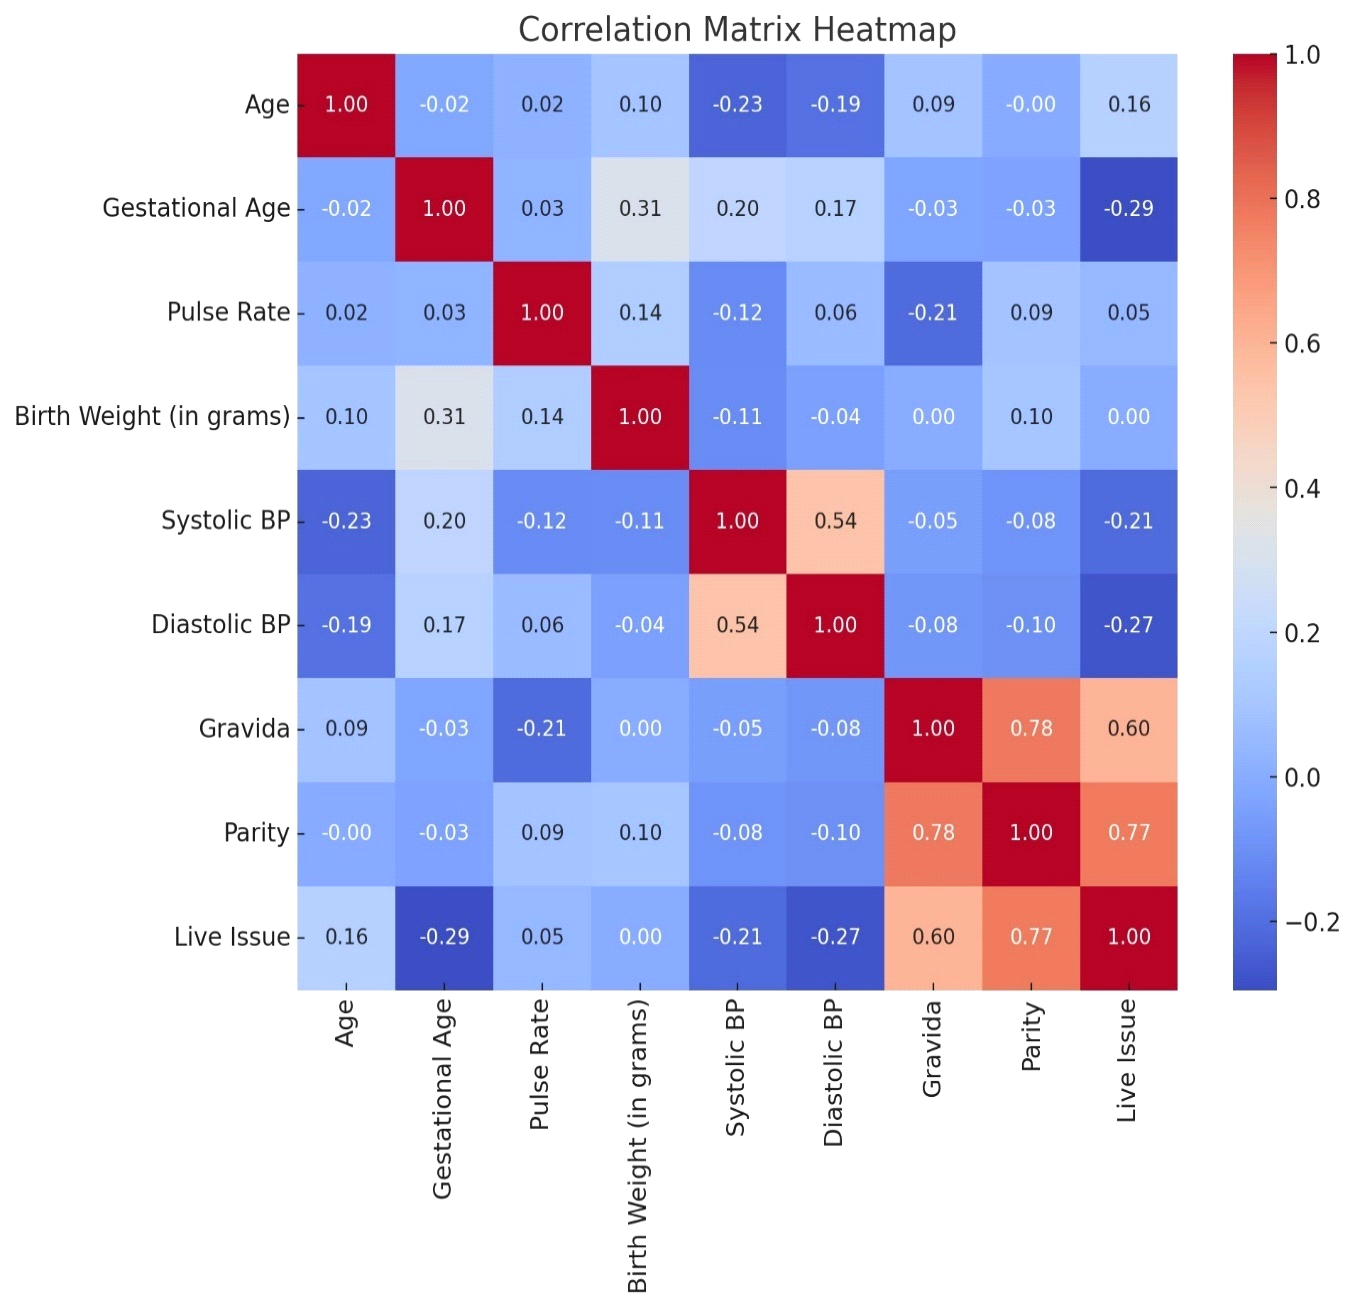
Figure 19b: Correlation Analysis Matrix.
The heatmap shows the correlation between different variables in the dataset. The values range from -1 to 1, with darker colours indicating stronger correlations. As observed, gestational age has the highest positive correlation with birth weight.
Regression Analysis
The regression plot shows the relationship between gestational age and birth weight. The red line represents the regression line, indicating the positive association between these variables. As gestational age increases, birth weight also tends to increase, which aligns with the findings from the regression analysis.
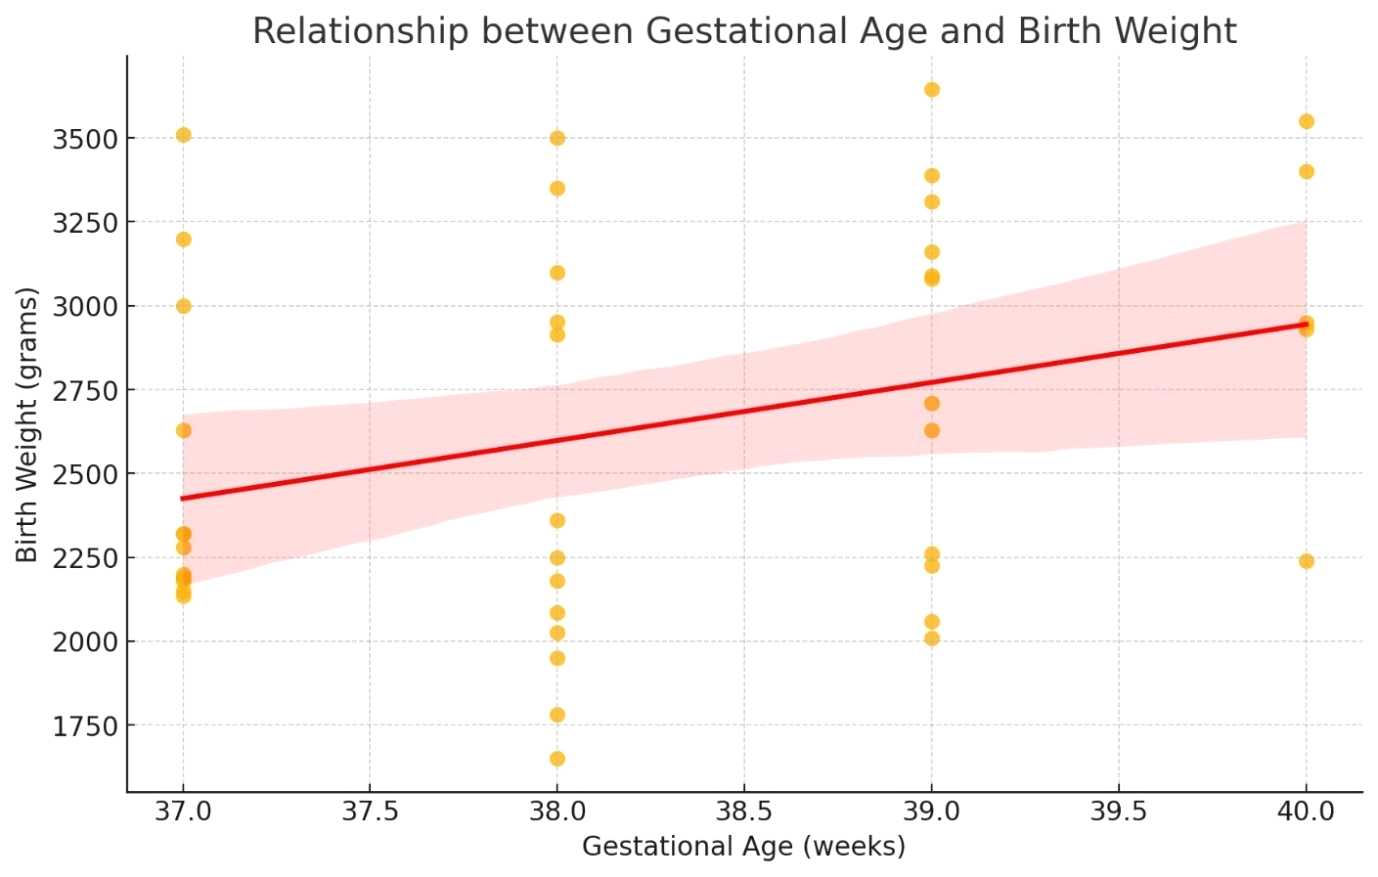
Statistical Analysis of EGR2 Gene in Term LBW New-Borns
Quantitative data was expressed in mean ± SD and differences between the two groups were tested by student’s t-test. A ‘p’ value less than 0.05 was considered statistically significant. GraphPad version 10.1 was used to perform statistical analysis.
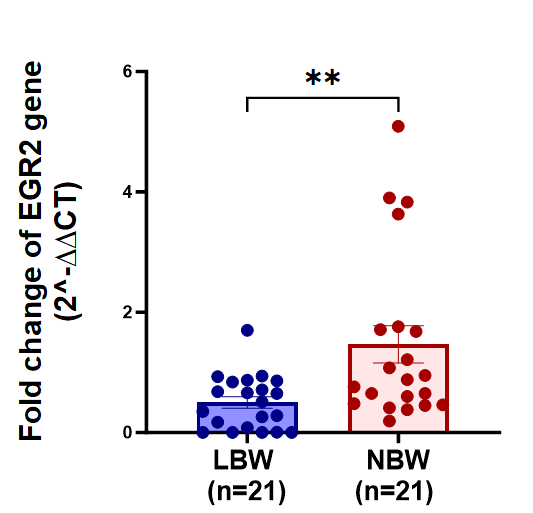
The bar graph compares the fold change of EGR2 gene expression between low birth weight (LBW) newborns (blue) and normal birth weight (NBW) newborns (red), each group consisting of 21 samples. The fold change is presented as 2−ΔΔCT2^{-\Delta\Delta CT}2−ΔΔCT, a measure of relative gene expression. The NBW group shows significantly higher fold change values compared to the LBW group, indicating greater EGR2 gene expression in normal birth weight newborns. The double asterisks (**) denote a statistically significant difference between the two groups. This result suggests that EGR2 gene expression is notably higher in NBW newborns compared to their LBW counterparts, highlighting a potential association between birth weight and EGR2 gene expression levels.
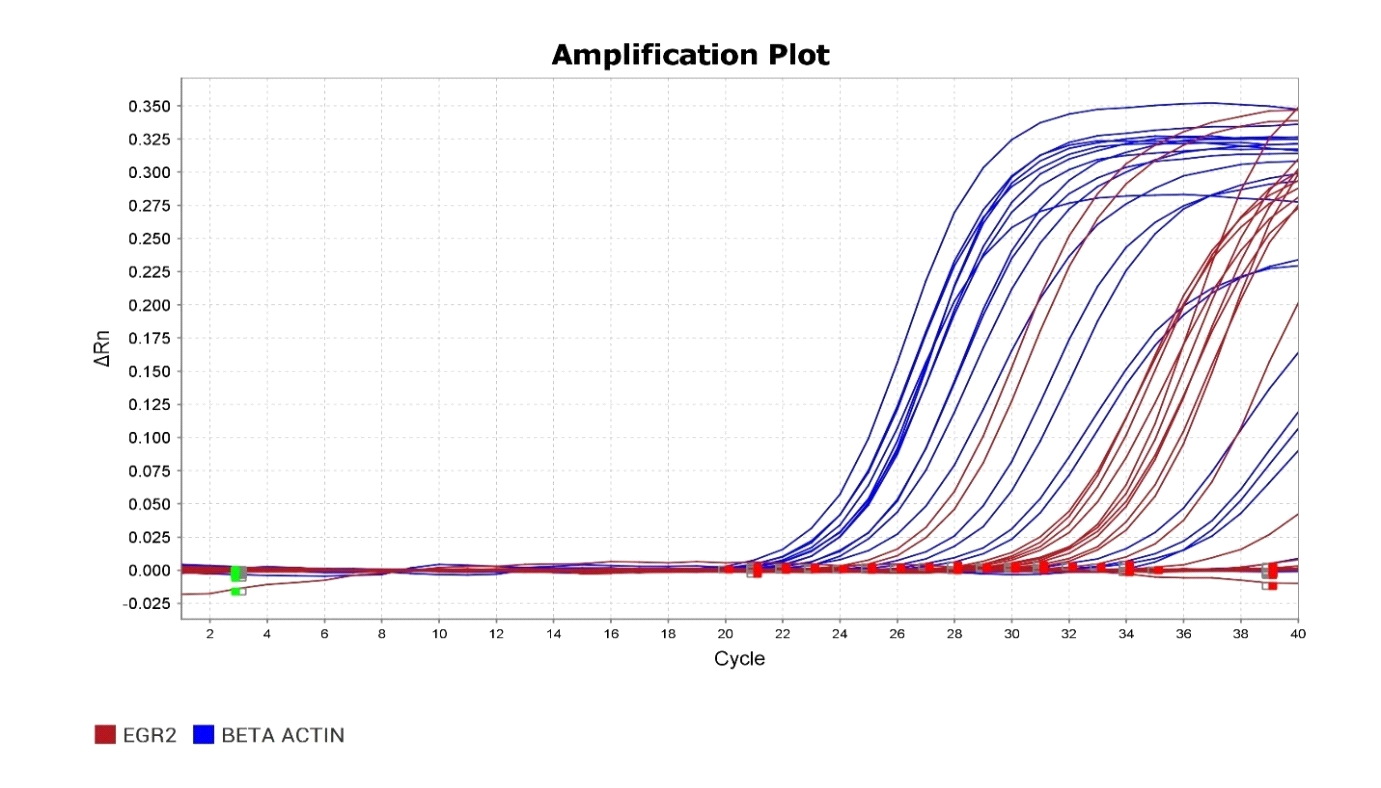
The amplification plot displays the expression levels of the EGR2 gene and BETA ACTIN in term low birth weight newborns across multiple cycles of PCR. The red curves represent the EGR2 gene, while the blue curves represent BETA ACTIN. The EGR2 gene shows significant amplification, indicating its expression in the samples tested. The BETA ACTIN gene serves as a control, showing consistent amplification across all samples, which validates the assay’s performance. The difference in cycle threshold (Ct) values between EGR2 and BETA ACTIN can be used to quantify the relative expression levels of EGR2 in the term low birth weight newborns. Overall, the plot suggests that EGR2 is actively expressed in the tested samples.
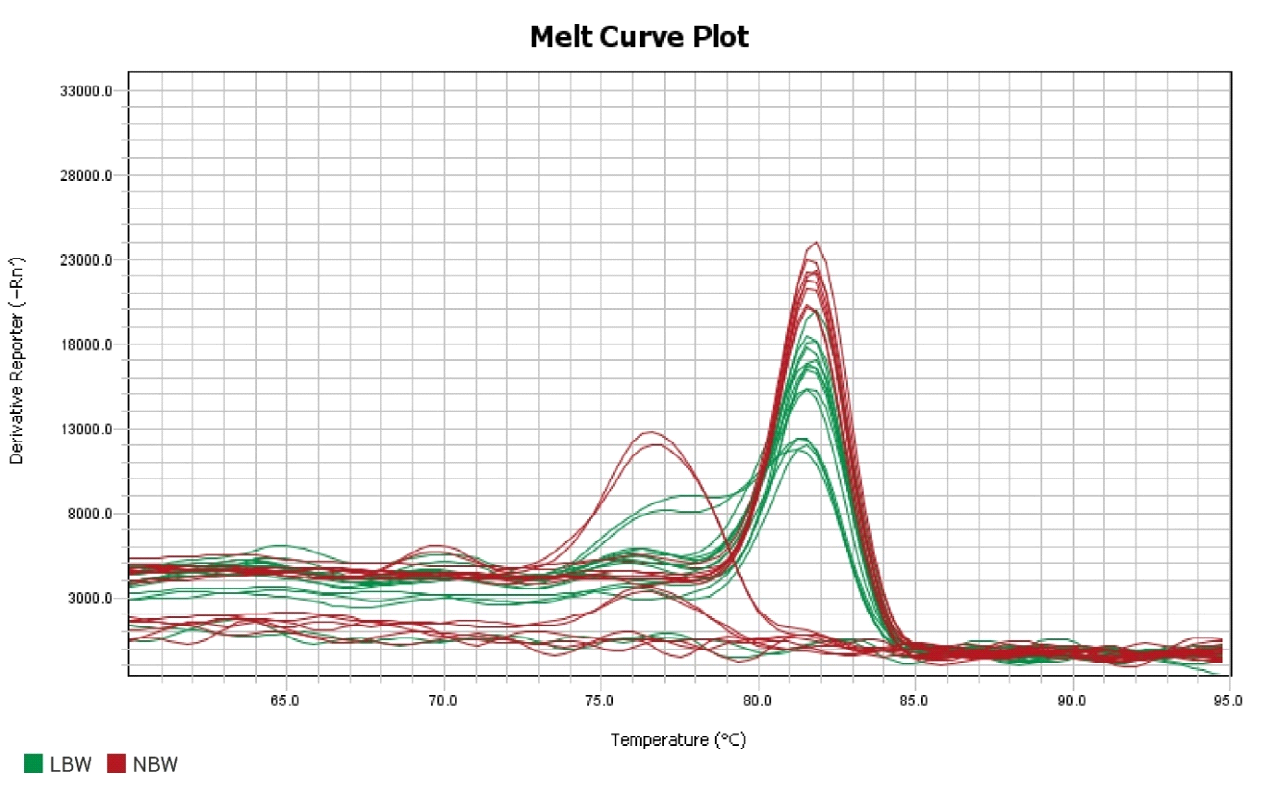
The melt curve plot represents the derivative reporter values (−Rn’) against temperature for evaluating the expression of the EGR2 gene in term low birth weight (LBW) newborns (green curves) and normal birth weight (NBW) newborns (red curves). The distinct peaks around 80°C indicate the melting temperatures (Tm) of the amplified products, confirming the presence of specific PCR products for EGR2 in both groups. The similarity in peak profiles between LBW and NBW groups suggests that the EGR2 gene expression produces a consistent and specific product in both sample sets. However, any subtle differences in peak heights or positions could indicate variations in the expression levels or product purity between the two groups. Overall, the melt curve analysis supports the specificity of the PCR amplification and suggests that EGR2 is expressed in both LBW and NBW newborns.
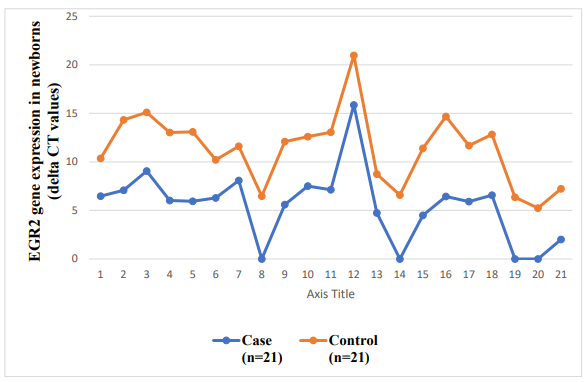
The line graph illustrates the delta Ct values for EGR2 gene expression in term low birth weight (LBW) newborns (case group, blue line) and normal birth weight (NBW) newborns (control group, orange line), with 21 samples in each group. The delta Ct values, which are inversely proportional to gene expression levels, fluctuate across samples for both groups. The control group consistently shows higher delta Ct values compared to the case group, indicating lower expression levels of the EGR2 gene in normal birth weight newborns. In contrast, the case group exhibits lower delta Ct values, suggesting higher EGR2 gene expression in low birth weight newborns. These findings suggest that EGR2 gene expression is upregulated in term low birth weight newborns compared to normal birth weight newborns.
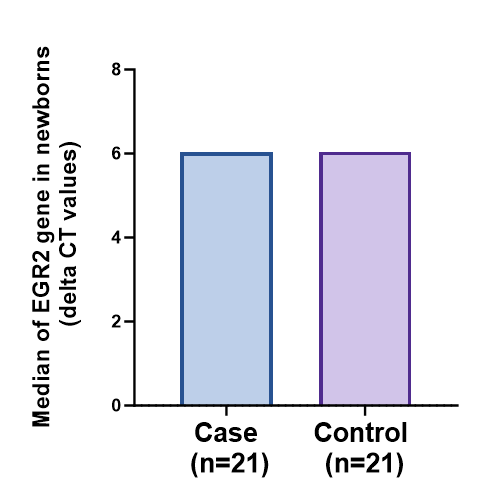
The bar graph depicts the median delta Ct values for EGR2 gene expression in term low birth weight (LBW) newborns (case group) and normal birth weight (NBW) newborns (control group), each with 21 samples. Both groups show a similar median delta Ct value around 6, suggesting no significant difference in the median expression levels of the EGR2 gene between LBW and NBW newborns.
This implies that while individual variations exist, the overall median expression of the EGR2 gene is comparable in both groups. Thus, the EGR2 gene expression may not be distinctly different in term low birth weight newborns compared to their normal birth weight counterparts based on the median values.
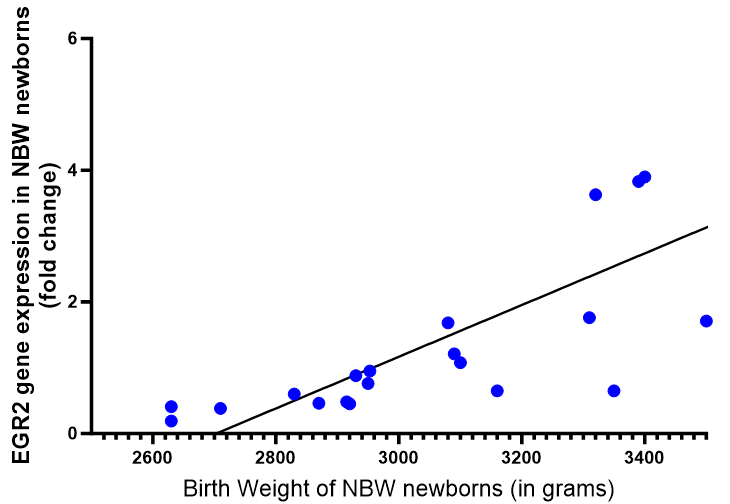
The scatter plot illustrates the relationship between the birth weight of normal birth weight (NBW) newborns (in grams) and the fold change in EGR2 gene expression. Each blue dot represents an individual NBW newborn, and the trend line indicates a positive correlation between birth weight and EGR2 gene expression. As the birth weight increases, there is a general trend of higher EGR2 gene expression (higher fold change). This suggests that in NBW newborns, those with higher birth weights tend to have higher levels of EGR2 gene expression. This positive correlation implies that birth weight may influence the expression of the EGR2 gene in term newborns.
The scatter plot shows the relationship between the birth weight of low birth weight (LBW) newborns (in grams) and the fold change in EGR2 gene expression. Each red dot represents an individual LBW newborn, and the trend line indicates a positive correlation between birth weight and EGR2 gene expression. As the birth weight increases, there is a corresponding increase in EGR2 gene expression, indicated by higher fold change values. This positive correlation suggests that among LBW newborns, those with higher birth weights tend to have higher levels of EGR2 gene expression. This relationship implies that even within the LBW category, birth weight significantly influences the expression of the EGR2 gene in term newborns.
Discussion
Low birth weight (LBW) is one of the most serious challenges in maternal and child health, especially in low- middle-income countries such as India. The World Health Organisation (WHO) defines LBW as a birth weight smaller than 2.500 kg, irrespective of the period of gestation. Based on epidemiological observations, it was noticed that infants weighing less than 2.500 kg are approximately 20 times more likely to die than heavier babies (WHO, 2023). 91 reported that globally, about 20 million LBW babies are born each year, comprising 15.5% of all live births, and nearly 95.6% of them were born in developing countries. The number of LBW babies is concentrated in two regions of the developing world, Asia (72%), and Africa (22%), and India alone accounts for 40% of LBW births in the developing world [86].
There are nearly eight million LBW infants born in India, which accounts for about 28% of all live births in India. According to the latest WHO and UNICEF estimates, there is partial data available from approximately 54 countries that include India. The infant mortality rate in India is 37%, and in Telangana State, it stands at 34% [88]. The principal cause of infant mortality in India is LBW, which accounts for 57% of all causes [86, 87, 88].
This study confirmed that LBW is still a major problem in India. Although it seems to be reducing trend compared to earlier studies to 13.96% in previous studies (Yadav et.al., 2013). However, LBW is still a significant cause of morbidity and mortality among neonates and children [89].
In this study, we included an equal number of patients for each group (case n = 21, control n = 70) and identified the major differences in clinical characteristics, such as age distribution, socio-economic status distribution, gestational age distribution, polar distribution, birth weight distribution, and EGR2 gene expression. The main objectives of this study are: 1) To evaluate the role of expression of the EGR2 gene in term LBW newborns. 2) To study the various risk factors for LBW newborns.
Age Distribution
Our study shows the frequencies for both cases and controls are observed in the 25–30 age groups, with 12 cases and 13 controls. The next significant group is the 20–25 age group, with 4 cases and 2 controls. The least represented age group is ≤20, with 1 case and 1 control. The ≥30 age group has 4 cases and 5 controls. This distribution suggests that most mothers fall within the 25–30 age range, with relatively fewer mothers in the youngest and oldest age groups.
Similar to our study, Devaguru A, et al. [91] reported that out of the 900 newborn babies included in the study, 327 were identified as LBW babies, with a prevalence rate of 36.33%. The LBW babies with an age of <19 had 99 cases, the LBW babies with an age of 19–35 had 216 cases, and the LBW babies with an age of >35 had 12 cases. Moreover, the occurrence of LBW babies was predominant among mothers who were aged 35 years (57.14%) [91].
Socio-Economic Status Distribution
The current study revealed that socio-economic status may not be a strong differentiating factor for low birth weight in this sample.
Gestational Age Distribution
Our data revealed that there is a notable decrease in the number of cases as gestational age increases, with only 1 case at 40 weeks compared to 4 controls. This suggests that a shorter gestational age is associated with a higher likelihood of low birth weight, highlighting the importance of gestational age as a risk factor for low birth weight. Begum K, et al. [92], reported that they included 100 very low birth weight babies and selected them by weight, intrauterine growth chart, and new ballad score. There is a slight preponderance of male babies (64%) over female babies (36%). The overall survival and mortality rates were 50% and 50%, respectively, in the present study. Mortality is highest (76.47%) in babies whose gestational age is 28 weeks, and the mortality rate gradually decreases as gestational age increases [92, 93, 94, 95, 96, 97, 98].
Sutan R, et al. [99] 2014 reported that gestation age <37, 92 LBW, and 9 control. Gestation age ≥37, 88 LBW, and 171 control. They suggested that gestational age <37 was associated with more LBW cases than control [99].
History of Previous LBW Pregnancy Distribution
The current study revealed that the majority of both cases and controls have no significant history of previous LBW pregnancies, with 19 cases and 18 controls. Only a small number of both cases (2) and controls (3) have a history of previous LBW pregnancies. This distribution suggests that a history of previous LBW pregnancies is not a predominant factor in this sample, as most cases and controls do not have such a history. However, a study shows that previous LBW pregnancies have a significant factor associated with LBW [93].
Pallor Distribution
Our study shows that both groups (case and control) have an equivalent distribution, with 14 mothers having no pallor and 7 mothers having pallor. This equal distribution indicates that the presence or absence of pallor does not differ between cases and controls in this sample.
Presence or Absence of Premature Rupture of Membranes (PROM) Distribution
In this study, among the cases, 10 had PROM absent and 11 had PROM present. In contrast, among the controls, 7 had PROM absent and 14 had PROM present. This data suggests that PROM is more frequently present in the control group compared to the cases. The higher frequency of PROM in the controls compared to the cases implies that PROM presence is not strongly associated with an increased risk of low birth weight in this sample.
A study by Miller HC, et al. [94] reported that the frequency of PROM in the control group was 34/707 (4.8%) to 40/444 (9.0%), while in the cases it was 21/204 (10.3%) to 12/46 (26%), which differs from our study [94, 95].
Birth Weight Distribution
Our study shows the majority of cases are in the 2.15- 2.65 kg range and 1.65-2.15 kg range, with no cases above 2.65 kg. In contrast, the controls are predominantly in the 3.15–3.65 kg range and the 2.650–3.15 kg range, with very few controls below 2.65 kg. Cases are concentrated at lower birth weights, primarily between 1.650 and 2.650 kg, with a peak around 2.150 kg. Controls are concentrated at higher birth weights, mostly between 2.650 and 3.650 kg, with peaks around 3.150 kg. and above. This distribution clearly indicates that low birth weight newborns (cases) fall within the lower birth weight ranges, while normal birth weight newborns (controls) occupy the higher birth weight ranges. This highlights the distinct separation in birth weight distributions between the two groups.
Alsamae AA, et al. [96] reported that the pre-pregnancy weight for LBW cases was 48.87 kg with a standard deviation ±9.93 and for normal control was 54.21 kg with a standard deviation ± 11.30. For pregnancy, it was 60.72 kg with a standard deviation of 10.68, and for normal control, it was 65 kg with a standard deviation of 13.35. These results suggest that the distribution clearly indicates that low birth weight newborns (cases) fall within the lower birth weight ranges, while normal birth weight newborns (controls) occupy the higher birth weight ranges [96].
A study by Najmi RS, et al. [95] shows the mean birth weight of the newborns was 2.91 kg. The weight of 78% of babies ranged from 2.5 to 4 kg; 19% had a low birth weight; and 3% of neonates weighed above 4 kg. Of 1156 low birth weight babies, 70% were preterm, 16% were growth retarded, and 14% were both premature and growth retarded [95]. Systolic BP Distribution Our results show that the distribution of systolic blood pressure (BP) readings among cases (low birth weight newborns) and controls (normal birth weight newborns) is divided into two categories: 100–110 mmHg and 111–120 mmHg. According to the data, 57% of the mothers fall into the 100–110 mmHg range, while 43% fall into the 111–120 mmHg range. The distribution is fairly similar between the two groups, indicating that systolic BP in the given ranges does not significantly differentiate between cases and controls. The nearly equal distribution suggests that systolic BP might not be a strong independent predictor of low birth weight in this sample.
The distribution of systolic blood pressure in LBW cases compared to normal individuals shows a consistently higher systolic blood pressure in the LBW group across multiple studies. For example, Salgado CM, et al. [97] reported that Low- birth-weight children had higher casual systolic blood pressure (SBP) compared to normal birth weight children [97].
Diastolic BP Distribution
Our study represented the distribution of diastolic blood pressure (BP) readings among cases and controls, divided into two categories: 60–70 mmHg and 71–80 mmHg. The pie chart shows that 38% of the mothers have diastolic BP in the range of 60–70 mmHg, while 62% fall into the 71–80 mmHg range.
Specifically, within the case group, 8 mothers have diastolic BP between 60 and 70 mmHg, and 13 mothers have diastolic BP between 71 and 80 mmHg. Among the controls, 10 mothers have diastolic BP between 60 and 70 mmHg, and 11 mothers have diastolic BP between 71 and 80 mmHg. The distribution is relatively similar between the two groups, indicating that diastolic BP in the given ranges does not significantly differentiate between cases and controls. This suggests that diastolic BP might not be a strong independent predictor of low birth weight in this sample, as the proportions are comparable for both cases and controls.
In general, LBW cases consistently show higher diastolic blood pressure compared to healthy control individuals. Shortland et.al., 1988, reported that the mean diastolic blood pressure in very low birth-weight infants ranged between 31 and 34 mmHg. In detail, the mean values were remarkably constant, with diastolic blood pressure varying between 31 and 34 mmHg, mean blood pressure between 35 mmHg and 40 mmHg, and systolic blood pressure between 46 mmHg and 52 mmHg [98].
Distribution of the Gravida Score
Gravida was defined as the number of all previous pregnancies, including abortions and stillbirths. The bar chart and table illustrate the distribution of gravida scores among cases and controls. The gravida score represents the number of pregnancies a woman has had. For gravida score 1, both groups show an equal frequency of 6. For gravida score 2, both cases and controls also have an equal frequency of 10. However, for gravida score 3, there are 5 cases compared to 3 controls, indicating a higher frequency among cases. For gravida score 4, there are no cases but 2 controls. The total number of cases and controls is equal to 21 each. This data suggests that higher gravida scores (3 and 4) are more frequent in controls compared to cases, indicating a potential relationship between the number of pregnancies and the condition being studied.
A study reported a gravida score of 1, 85 in LBW and 67 in control. However, gravida score ≥1 is 95 in LBW and 113 in control. The total number of gravida for cases and controls was equal to 180 each. They suggested that a higher gravida score was obtained with ≥1 score [99].
Distribution of Parity Score
The parity score indicates the number of times a woman has given birth. For parity score 0, 10 cases and 8 controls are observed. For parity score 1, both cases and controls show nearly equal frequencies, with 10 cases and 9 controls.
However, for parity score 2, there is a significant difference: only 1 case is observed compared to 4 controls. This data suggests that higher parity scores (score 2) are less frequent among cases than controls, indicating a possible relationship between parity and the condition being studied.
A study by Sutan et al [99] reported that parity scores of 0, 94 cases, and 78 controls were observed. For a parity score ≥1, 86 LBW and 102 controls show nearly equal frequencies, with 10 cases and 9 controls [99].
Comparisons of Various Parameters with Birth Weight
There is noticeable variability in birth weights across different socio-economic groups, but there is no clear trend indicating a particular socio-economic status is associated with higher or lower birth weights. In addition, the birth weights are slightly higher in mothers with a history of previous LBW pregnancies compared to those without, although the overlap in distributions suggests no strong differentiation. Moreover, the presence or absence of pallor does not show a significant impact on birth weight, as the median and distribution are similar for both groups. Overall, while socio-economic status and the history of previous LBW pregnancies show some variability, they have a more pronounced effect on reducing birth weight.
Correlation Analysis of Various Parameters with Birth Rate
The key finding of correlation analysis shows that the relationship between birth weight and other continuous variables is that gestational age has the highest positive correlation with birth weight (0.309), suggesting that longer gestation is associated with a higher birth weight. Moreover, pulse rate, parity, and age have weak positive correlations with birth weight. Additionally, gravida, diastolic BP, and systolic BP have very weak or negative correlations with birth weight. Regression analysis between gestational age and birth weight. The regression plot shows the relationship between gestational age and birth weight. The red line represents the regression line, indicating the positive association between these variables. As gestational age increases, birth weight also tends to increase, which aligns with the findings from the regression analysis.
Statistical Analysis of the EGR2 Gene in LBW Newborns
This result suggests that EGR2 gene expression is notably higher in NBW newborns compared to their LBW counterparts, highlighting a potential association between birth weight and EGR2 gene expression levels.
Correlation of the Birth Weight of LBW Newborns with EGR2 Gene Expression
In our study, we first reported the EGR2 expression and its correlation with the birth weight of normal birth weight (NBW) newborns. Those with higher birth weights tend to have higher levels of EGR2 gene expression. This positive correlation implies that birth weight may influence the expression of the EGR2 gene in term newborns. As the birth weight increases, there is a corresponding increase in EGR2 gene expression, indicated by higher fold change values. There is no study specifically mentioning the EGR2 gene, so there is no direct correlation provided in the top results for the expression of the EGR2 gene in relation to the birth weight of LBW newborns.
The hematopoietic system plays an essential role in human health and survival. Early growth response gene 2 (Egr2, also known as Krox20) has been identified as a transcriptional factor (TF) involved in the differentiation of hematopoietic stem cells into myeloid cells. Along with the transcriptional regulator including C/EBPα and PU.1, EGR2 mediates monocytic differentiation.
The C/EBP family and PU.1TFs are the primary regulators of myeloid lineage development. PU.1 and C/ EBPα express oppositely in myeloblasts and a high C/ EBPα/PU.1 ratio favours granulopoiesis over monopoiesis. Next, C/EBPα triggers the TF GFI1 to direct neutrophil differentiation, while PU.1 triggers the activation of IRF8, KLF4, and EGR2 to facilitate monocytic differentiation. In addition to this, EGR2 also regulates the development and function of immune cells, including T cells and B cells, which are crucial for the adaptive immune response. This function is important in maintaining a balanced immune system within the hematopoietic system.EGR2 is involved in maintaining the hematopoietic stem cell niche within the bone marrow. It contributes to the microenvironment that supports HSC self-renewal and differentiation, thereby sustaining the continuous production of blood cells throughout life.
In our study, we analyzed the significant down regulation (p=0.0048) of the EGR2 gene in LBW newborns compared to NBW newborns suggesting impaired haematopoiesis. The correlation of the EGR2 gene with the birth weight of newborns further suggests lower expression of the EGR2 gene in LBW newborns, identifying it as a probable factor of impaired immunity in them. The poor innate immune response and high morbidity of LBW newborns are associated with several factors. Our study highlights egr2 as one of the novel factors of compromised hematopoiesis which further causes a low number of circulating immune cells in LBW newborns compared to NBW newborns.
Real time PCR machine - Quantstudio 5

Summary and Conclusion
Low birth weight (LBW) is defined as a birth weight of less than 2500 grams, regardless of gestational age. This condition can result from preterm birth or intrauterine growth restriction, leading to various health challenges such as difficulty regulating body temperature, feeding issues, respiratory problems, and increased risk of infections. Globally, approximately 15-20% of all deliveries result in LBW, with the majority occurring in developing countries. This study aims to evaluate the expression of the EGR2 gene in term LBW newborns and to investigate various risk factors associated with LBW.
Objectives
1. To evaluate the role of the expression of the EGR2 gene in term LBW newborns. 2. To study the various risk factors for LBW newborns.
Study Design and Methods
This prospective observational study included 42 full- term newborns (21 NBW and 21 LBW) from the Department of Obstetrics and Gynecology, Institute of Medical Sciences, Banaras Hindu University. Cord blood samples were collected and RNA was extracted using the TRI reagent method. Quantitative real-time PCR was used to analyze the expression of the EGR2 gene.
Sample Collection
- Cord blood (10 ml) from 42 full-term newborns was collected in sterile tubes containing non-pyrogenic anti- coagulant heparin.
- Informed and written consent was obtained from the parents.
- Birth weight was measured immediately after birth.
- Detailed maternal and neonatal information was collected using a predesigned questionnaire.
RNA Extraction
- Total RNA was extracted from 1 ml cord blood using TRI reagent and the Phenol-Chloroform method.
- The RNA pellet was washed with 75% ethanol and dissolved in nuclease-free water.
One-Step Real-Time PCR
- RNA quantification was performed using a Nanodrop spectrophotometer.
- The One Step TB Green® PrimeScript™ RT-PCR Kit II was used for quantitative real-time PCR.
- EGR2 and β-actin primers were used to amplify the RNA.
PCR Conditions
• Reverse Transcription: 42ºC for 5 minutes, 95ºC for 10
seconds.
- PCR Reaction (40 Cycles): 95ºC for 5 seconds, 60ºC for 34 seconds.
- Melting Curve Analysis: 95ºC for 15 seconds, 65ºC for 1 minute, 95ºC for 15 seconds.
Data Analysis
- Quantitative data were expressed as mean ± SD.
- Differences between groups were tested using Student’s t-test.
- A p-value of less than 0.05 was considered statistically significant.
- Statistical analysis was performed using GraphPad version 10.1.
Results
Age Distribution
- Most mothers fell within the 25-30 age range, with no significant difference between cases and controls. Socioeconomic Status
- No significant difference in socioeconomic status distribution was observed between cases and controls.
- Gestational Age
- Higher frequencies of LBW cases were associated with earlier gestational ages, highlighting the importance of gestational age as a risk factor.
History of Previous LBW Pregnancy
• The majority of both cases and controls had no history of previous LBW pregnancies, indicating it is not a predominant factor in this sample.
Pallor
• The presence of pallor in mothers showed no significant difference between cases and controls.
Premature Rupture of Membranes (PROM)
• PROM was more frequent in the control group, suggesting it may not be strongly associated with LBW risk.
Birth Weight Distribution
• LBW cases were concentrated at lower birth weights (1650-2650 grams), while controls were at higher birth weights (2650-3650 grams), indicating a distinct separation in birth weight distributions.
Blood Pressure
Systolic and diastolic BP readings showed no significant difference between cases and controls, suggesting BP may not be a strong predictor of LBW.
Obstetric History
- Higher gravida scores were more frequent in controls.
- Higher parity scores were less frequent among cases.
- Higher live issue scores were absent among cases.
APGAR Score
• Most cases and controls had high APGAR scores (8 and 9), indicating generally good health at birth.
Correlation Analysis
- Gestational age had the highest positive correlation with birth weight.
- Other variables showed weak correlations with birth weight.
EGR2 Gene Expression
• Quantitative real-time PCR analysis showed significantly higher EGR2 gene expression in NBW newborns compared to LBW newborns, suggesting a potential association between birth weight and EGR2 gene expression.
Conclusion
The study provides significant insights into the prevalence and impact of various factors on LBW in term newborns, with a particular focus on the role of the EGR2 gene. The findings highlight the importance of early identification and management of risk factors to improve outcomes for LBW newborns. Key conclusions include: • Gestational Age: The shorter gestational age is significantly associated with a higher likelihood of LBW, emphasizing the importance of managing pregnancies to term whenever possible. • Socioeconomic Factors: Socioeconomic status showed no significant impact on the likelihood of LBW in this sample, suggesting that LBW may be influenced more by biological and medical factors than by socioeconomic conditions. • Maternal Health: Factors like maternal age, history of LBW pregnancies, and presence of pallor did not show a significant impact on LBW in this sample, although these factors should still be monitored as part of comprehensive maternal care. • PROM: The presence of PROM was more common in controls, indicating that PROM may not be a significant risk factor for LBW in this dataset. • Blood Pressure: Both systolic and diastolic BP readings were not significantly different between LBW and NBW groups, suggesting BP may not be a strong independent predictor of LBW. • EGR2 Gene Expression: Higher EGR2 gene expression was observed in NBW newborns compared to LBW newborns, indicating a potential regulatory role of this gene in fetal growth and development. • Overall Health Indicators: APGAR scores were high in both LBW and NBW groups, suggesting good immediate health outcomes at birth despite the differences in birth weight.
Implications for Future Research
Future research should focus on • Longitudinal Studies: Conducting long-term studies to track the development of LBW newborns and identify any lasting impacts of low birth weight and EGR2 gene expression on health outcomes. • Broader Population Samples: Including a more diverse population sample to generalize findings across different demographics and regions. • Mechanistic Studies: Investigating the underlying mechanisms through which EGR2 gene expression influences fetal growth and development. • Intervention Strategies: Developing and testing targeted intervention strategies to manage risk factors associated with LBW, particularly in resource-limited settings. Clinical Recommendations • Prenatal Care: Emphasizing the importance of regular prenatal care to monitor gestational age and manage conditions that may lead to premature birth. • Nutritional Support: Providing adequate nutritional support to pregnant women to promote healthy fetal growth. • Genetic Screening: Considering genetic screening for EGR2 expression as part of prenatal care to identify at- risk pregnancies. • Public Health Policies: Implementing public health policies to address socioeconomic and healthcare disparities that may contribute to LBW.
In conclusion, this study underscores the importance of comprehensive prenatal and postnatal care to manage and mitigate the risks associated with low birth weight. By focusing on both genetic and environmental factors, healthcare providers can develop more effective strategies to ensure healthy outcomes for all newborns. The results were statistically significant hence this concludes that there is low expression of EGR2 gene in low birth weight babies which may lead to low immunity in LBW babies.
References
-
Khan AM, Carducci B, Bhutta ZA (2017) Low birth weight and small for gestational age in the context of 1,000 days. In: The biology of the first 1,000 days. CRC Press, pp: 171-188.
-
Darmstadt GL, Al Jaifi NH, Arif S, Bahl R, Blennow M, et al. (2023) New World Health Organization recommendations for care of preterm or low birth weight infants: health policy. EClinicalMedicine 63: 102210.
-
Sharma S (n.d.) Childhood mortality and health in India.
-
Nisha MK (n.d.) Modifiable risk factors associated with adverse perinatal outcomes in Bangladesh. Doctoral dissertation.
-
Ashorn P, Ashorn U, Muthiani Y, Aboubaker S, Askari S, et al. (2023) Small vulnerable newborns big potential for impact. Lancet 401(10389): 1692-1706.
-
Evans K (2016) Cardiovascular transition of the extremely premature infant and challenges to maintain hemodynamic stability. J Perinat Neonatal Nurs 30(1): 68-72.
-
Sudano JJ Jr (1998) Explaining racial differentials in pregnancy outcomes: race, community context, and the individual. Doctoral dissertation, Kent State University.
-
Wodahl EJ (2006) The challenges of prisoner reentry from a rural perspective. West Criminol Rev 7(2): 32-47.
-
Ohadike C (n.d.) The effect of maternal anthropometry on newborn size and body composition. Doctoral dissertation, University of Oxford.
-
Ahmed AA (n.d.) Socio-demographic and prenatal predictors of preterm birth, low birth weight and caesarean section and the impact on child feeding practices, perinatal and early years health. Doctoral dissertation, University of Sunderland.
-
Watkins DA, Yamey G, Schäferhoff M, Adeyi O, Alleyne G, et al. (2018) Alma-Ata at 40 years: reflections from the Lancet Commission on Investing in Health. Lancet 392(10156): 1434-1460.
-
Zeng H, Zhang R, Jin B, Chen L (2015) Type 1 regulatory T cells: a new mechanism of peripheral immune tolerance. Cell Mol Immunol 12(5): 566-571.
-
Andreoli L, Chighizola CB, Iaccarino L, Botta A, Gerosa M, et al. (2023) Immunology of pregnancy and reproductive health in autoimmune rheumatic diseases. Autoimmun Rev 22(3): 103259.
-
Zeinelabdeen Y, Abaza T, Yasser MB, Elemam NM, Youness RA (2024) MIAT lncRNA: a multifunctional key player in non-oncological pathological conditions. Non- coding RNA Res 9(2): 447-462.
-
Morita K, Okamura T, Sumitomo S, Iwasaki Y, Fujio K, Yamamoto K (2016) Emerging roles of Egr2 and Egr3 in the control of systemic autoimmunity. Rheumatology 55(suppl_2): ii76-ii81.
-
George JL, Mok S, Moses D, Wilkins S, Bush AI, et al. (2009) Targeting the progression of Parkinson’s disease. Curr Neuropharmacol 7(1): 9-36.
-
Hediger ML, Scholl TO, Schall JI, Miller LW, Fischer RL (1995) Fetal growth and the etiology of preterm delivery. Obstet Gynecol 85(2): 175-182.
-
Wilcox AJ (2001) On the importance and the unimportance of birth weight. Int J Epidemiol 30(6): 1233-1241.
-
Rosa-Mangeret F, Benski AC, Golaz A, Zala PZ, Kyokan M, et al. (2022) 2.5 million annual deaths are neonates in low- and middle-income countries too small to be seen? Trop Med Infect Dis 7(5): 64.
-
Bartholomew DC, Biu OE, Enegesele D (2022) Impact of maternal education and age on weight of child at birth: use of multinomial logistic model. Asian J Probab Stat 18(2): 46-59.
-
Adeyinka DA (n.d.) Social determinants and child survival in Nigeria in the era of Sustainable Development Goals: progress, challenges and opportunities. Doctoral dissertation, University of Saskatchewan.
-
Blencowe H (n.d.) Counting the smallest: data to estimate global stillbirth, preterm birth and low birth weight rates. Doctoral dissertation, London School of Hygiene & Tropical Medicine.
-
Padilla CM, Kihal-Talantikit W, Perez S, Deguen S (2016) Use of geographic indicators of healthcare, environment and socioeconomic factors to characterize environmental health disparities. Environ Health 15: 82.
-
Manjesh KA (n.d.) Study of clinical profile and outcome of small for gestational age neonates admitted in NICU of tertiary care hospital. Doctoral dissertation, Rajiv Gandhi University of Health Sciences (India).
-
Fleiss B, Wong F, Brownfoot F, Shearer IK, Baud O, et al. (2019) Knowledge gaps and emerging research areas in intrauterine growth restriction-associated brain injury. Front Endocrinol 10: 188.
-
Delnord M, Blondel B, Prunet C, Zeitlin J (2018) Are risk factors for preterm and early-term live singleton birth the same? A population-based study in France. BMJ Open 8(1): e018745.
-
He Z, Bishwajit G, Yaya S, Cheng Z, Zou D, et al. (2018) Prevalence of low birth weight and its association with maternal body weight status in selected countries in Africa: a cross-sectional study. BMJ Open 8(8): e020410.
-
Woolhouse H, Gartland D, Mensah F, Brown SJ (2015) Maternal depression from early pregnancy to 4 years postpartum in a prospective pregnancy cohort study: implications for primary health care. BJOG 122(3): 312- 321.
-
Chang KJ, Seow KM, Chen KH (2023) Preeclampsia: recent advances in predicting, preventing, and managing the maternal and fetal life-threatening condition. Int J Environ Res Public Health 20(4): 2994.
-
Heitkamp A, Meulenbroek A, van Roosmalen J, Gebhardt S, Vollmer L, et al. (2021) Maternal mortality: near-miss events in middle-income countries, a systematic review. Bull World Health Organ 99(10): 693-707.
-
Shenoy S, Sharma P, Rao A, Aparna N, Adenikinju D, et al. (2023) Evidence-based interventions to reduce maternal malnutrition in low and middle-income countries: a systematic review. Front Health Serv 3: 1140247.
-
Bhutta ZA, Darmstadt GL, Hasan BS, Haws RA (2005) Community-based interventions for improving perinatal and neonatal health outcomes in developing countries: a review of the evidence. Pediatrics 115(Suppl_2): 519- 617.
-
Sharma M, Mishra S (2013) Maternal risk factors and consequences of low birth weight in infants. IOSR J Humanit Soc Sci 13(4): 39-45.
-
Alam DS (2009) Prevention of low birth weight. In: Emerging societies—coexistence of childhood malnutrition and obesity, vol. 63. Karger Publishers, pp: 209-225.
-
Koivu AM, Haapaniemi T, Askari S, Bhandari N, Black RE, et al. (2023) What more can be done? Prioritizing the most promising antenatal interventions to improve birth weight. Am J Clin Nutr 117(Suppl_1): S107-S117.
-
David R, Evans R, Fraser HS (2021) Modelling prenatal care pathways at a central hospital in Zimbabwe. Health Serv Insights 14: 11786329211062742.
-
De Masi S, Bucagu M, Tunçalp Ö, Peña-Rosas JP, Lawrie T, et al. (2017) Integrated person-centered health care for all women during pregnancy: implementing World Health Organization recommendations on antenatal care for a positive pregnancy experience. Glob Health Sci Pract 5(2): 197-201.
-
Alberts B, Johnson A, Lewis J, Raff M, Roberts K, et al. (2002) Studying gene expression and function. In: Molecular biology of the cell. 4th edition. Garland Science.
-
Gheorghe CP, Goyal R, Mittal A, Longo LD (2010) Gene expression in the placenta: maternal stress and epigenetic responses. Int J Dev Biol 54(2-3): 507-523.
-
Gao H, Zhang L, Wang L, Liu X, Hou X, et al. (2020) Liver transcriptome profiling and functional analysis of intrauterine growth restriction (IUGR) piglets reveals a genetic correction and sexual-dimorphic gene expression during postnatal development. BMC Genomics 21: 326.
-
Morita K, Okamura T, Sumitomo S, Iwasaki Y, Fujio K, et al. (2016) Emerging roles of Egr2 and Egr3 in the control of systemic autoimmunity. Rheumatology 55(suppl_2): ii76-ii81.
-
Crespo J, Sun H, Welling TH, Tian Z, Zou W (2013) T cell anergy, exhaustion, senescence, and stemness in the tumor microenvironment. Curr Opin Immunol 25(2): 214-221.
-
Boyle KB, Hadaschik D, Virtue S, Cawthorn WP, Ridley SH, et al. (2009) The transcription factors Egr1 and Egr2 have opposing influences on adipocyte differentiation. Cell Death Differ 16(5): 782-789.
-
Martinez-Moreno M, O’Shea TM, Zepecki JP, Olaru A, Ness JK, et al. (2017) Regulation of peripheral myelination through transcriptional buffering of Egr2 by an antisense long non-coding RNA. Cell Rep 20(8): 1950-1963.
-
Duclot F, Kabbaj M (2017) The role of early growth response 1 (EGR1) in brain plasticity and neuropsychiatric disorders. Front Behav Neurosci 11: 35.
-
Wu W, Zhang J, Chen Y, Chen Q, Liu Q, et al. (2024) Genes in axonal regeneration. Mol Neurobiol 61: 1193-1199.
-
Gebhardt T, Park SL, Parish IA (2023) Stem-like exhausted and memory CD8+ T cells in cancer. Nat Rev Cancer 23(11): 780-798.
-
Thimmulappa RK, Lee H, Rangasamy T, Reddy SP, Yamamoto M, et al. (2006) Nrf2 is a critical regulator of the innate immune response and survival during experimental sepsis. J Clin Invest 116(4): 984-995.
-
Orlov AP, Orlova MA, Trofimova TP, Kalmykov SN, Kuznetsov DA (2018) The role of zinc and its compounds in leukemia. J Biol Inorg Chem 23: 347-362.
-
Bose S, Saha S, Goswami H, Shanmugam G, Sarkar K (2023) Involvement of CCCTC-binding factor in epigenetic regulation of cancer. Mol Biol Rep 50(12): 10383-10398.
-
Affar M, Bottardi S, Quansah N, Lemarié M, Ramón AC, et al. (2023) IKAROS: from chromatin organization to transcriptional elongation control. Cell Death Differ 31: 1-9.
-
Rao S, Jim B (2018) Acute kidney injury in pregnancy: the changing landscape for the 21st century. Kidney Int Rep 3(2): 247-257.
-
Zemmour D, Zilionis R, Kiner E, Klein AM, Mathis D, et al. (2018) Single-cell gene expression reveals a landscape of regulatory T cell phenotypes shaped by the TCR. Nat Immunol 19(3): 291-301.
-
Taefehshokr N (n.d.) Regulation of Egr2 expression in T cells and Egr2/3 function in tumour infiltrating T cells. Doctoral dissertation, Brunel University London.
-
Fanzo J, Davis C (2021) Global food systems, diets, and nutrition. Springer International Publishing, Switzerland.
-
Saxena R (2014) Bedside obstetrics & gynecology. JP Medical Ltd, London.
-
Drag MH, Kilpeläinen TO (2021) Cell-free DNA and RNA- measurement and applications in clinical diagnostics with focus on metabolic disorders. Physiol Genomics 53(1): 33-46.
-
Khan I, Khare BK (2024) Exploring the potential of machine learning in gynecological care: a review. Arch Gynecol Obstet 309: 1291-1300.
-
Bekri S (2016) The role of metabolomics in precision medicine. Expert Rev Precis Med Drug Dev 1(6): 517-532.
-
Xiao C, Wang Y, Fan Y (2022) Bioinformatics analysis identifies potential related genes in the pathogenesis of intrauterine fetal growth retardation. Evol Bioinform 18: 11769343221112780.
-
Li S, Yan B, Li TK, Lu J, Gu Y, et al. (2023) Ultra-low- coverage genome-wide association study—insights into gestational age using 17,844 embryo samples with preimplantation genetic testing. Genome Med 15(1): 10.
-
Sampino S, Stankiewicz AM, Zacchini F, Goscik J, Szostak A, et al. (2017) Pregnancy at advanced maternal age affects behavior and hippocampal gene expression in mouse offspring. J Gerontol A Biol Sci Med Sci 72(11): 1465-1473.
-
Cho HY, Van Houten B, Wang X, Miller-DeGraff L, Fostel J, et al. (2012) Targeted deletion of nrf2 impairs lung development and oxidant injury in neonatal mice. Antioxid Redox Signal 17(8): 1066-1085.
-
Ayuso M, Fernandez A, Nunez Y, Benitez R, Isabel B, et al. (2015) Comparative analysis of muscle transcriptome between pig genotypes identifies genes and regulatory mechanisms associated to growth, fatness and metabolism. PLoS One 10(12): e0145162.
-
Kantake M, Yoshitake H, Ishikawa H, Araki Y, Shimizu T (2014) Postnatal epigenetic modification of glucocorticoid receptor gene in preterm infants: a prospective cohort study. BMJ Open 4(7): e005318.
-
Bhattacharya S, Mereness JA, Baran AM, Misra RS, Peterson DR, et al. (2021) Lymphocyte-specific biomarkers associated with preterm birth and broncho pulmonary dysplasia. Front Immunol 11: 563473.
-
Gao H, Zhang L, Wang L, Liu X, Hou X, et al. (2020) Liver transcriptome profiling and functional analysis of intrauterine growth restriction (IUGR) piglets reveals a genetic correction and sexual-dimorphic gene expression during postnatal development. BMC Genomics 21: 326.
-
Twisselmann N, Pagel J, Künstner A, Weckmann M, Hartz A, et al. (2021) Hyperoxia/Hypoxia exposure primes a sustained pro-inflammatory profile of preterm infant macrophages upon LPS stimulation. Front Immunol 12: 762-789.
-
Przybycien-Szymanska MM, Rao YS, Prins SA, Pak TR (2014) Parental binge alcohol abuse alters F1 generation hypothalamic gene expression in the absence of direct fetal alcohol exposure. PLoS One 9(2): e89320.
-
Chermuła B, Jeseta M, Sujka-Kordowska P, Konwerska A, Jankowski M, et al. (2020) Genes regulating hormone stimulus and response to protein signaling revealed differential expression pattern during porcine oocyte in vitro maturation, confirmed by lipid concentration. Histochem Cell Biol 154(1): 77-95.
-
Morita K, Okamura T, Inoue M, Komai T, Teruya S, et al. (2016) Egr2 and Egr3 in regulatory T cells cooperatively control systemic autoimmunity through Ltbp3-mediated TGF-β3 production. Proc Natl Acad Sci U S A 113(50): E8131-E8140.
-
Gomez-Lopez N, Garcia-Flores V, Chin PY, Groome HM, Bijland MT, et al. (2021) Macrophages exert homeostatic actions in pregnancy to protect against preterm birth and fetal inflammatory injury. JCI Insight 6(19): e149886.
-
Welfley H, Kylat R, Zaghloul N, Halonen M, Martinez FD, et al. (2022) Mapping fetal myeloid differentiation in airway samples from premature neonates with single- cell profiling. bioRxiv 2022:2022.07.10.499404.
-
Dupré N, Derambure C, Le Dieu-Lugon B, Hauchecorne M, Detroussel Y, et al. (2020) Hypoxia-Ischemia induced age-dependent gene transcription effects at two development stages in the neonate mouse brain. Front Mol Neurosci 13: 587815.
-
Welfley H, Kylat R, Zaghloul N, Halonen M, Martinez FD, et al. (2023) Single-cell profiling of premature neonate airways reveals a continuum of myeloid differentiation. Am J Respir Cell Mol Biol 69(6): 689-697.
-
Li Q, Canosa S, Flynn K, Michaud M, Krauthammer M, et al. (2013) Modeling the neurovascular niche: unbiased transcriptome analysis of the murine subventricular zone in response to hypoxic insult. PLoS One 8(10): e76265.
-
Bouchoucha YX, Charnay P, Gilardi-Hebenstreit P (2013) Ablation of Egr2-positive cells in male mouse anterior pituitary leads to atypical isolated GH deficiency. Endocrinology 154(1): 270-282.
-
Albert M, Schmitz SU, Kooistra SM, Malatesta M, Morales Torres C, et al. (2013) The histone demethylase Jarid1b ensures faithful mouse development by protecting developmental genes from aberrant H3K4me3. PLoS Genet 9(4): e1003461.
-
Maeda N, Kawakami S, Ohmoto M, le Coutre J, Vinyes- Pares G, et al. (2013) Differential expression analysis throughout the weaning period in the mouse cerebral cortex. Biochem Biophys Res Commun 431(3): 437-443.
-
Nguyen HD, Kim MS (2023) The effects of a mixture of cadmium, lead, and mercury on metabolic syndrome and its components, as well as cognitive impairment: genes, MicroRNAs, transcription factors, and sponge relationships. Biol Trace Elem Res 201(5): 2200-2221.
-
Rosengauer E, Hartwich H, Hartmann AM, Rudnicki A, Satheesh SV, et al. (2012) Egr2::cre mediated conditional ablation of dicer disrupts histogenesis of mammalian central auditory nuclei. PLoS One 7(11): e49503.
-
Ng SF, Lin RC, Maloney CA, Youngson NA, Owens JA, et al. (2014) Paternal high-fat diet consumption induces common changes in the transcriptomes of retroperitoneal adipose and pancreatic islet tissues in female rat offspring. FASEB J 28(4): 1830-1841.
-
Hadley KB, Ryan AS, Forsyth S, Gautier S, Salem N Jr (2016) The essentiality of arachidonic acid in infant development. Nutrients 8(4): 216.
-
Hadziselimovic F, Gegenschatz-Schmid K, Verkauskas G, Demougin P, Bilius V, et al. (2017) GnRHa treatment of cryptorchid boys affects genes involved in hormonal control of the HPG axis and fertility. Sex Dev 11(3): 126- 136.
-
Somm E, Vauthay DM, Guérardel A, Toulotte A, Cettour-Rose P, et al. (2012) Early metabolic defects in dexamethasone-exposed and undernourished intrauterine growth restricted rats. PLoS One 7(11): e50131.
-
World Health Organization, UNICEF (2004) Low birthweight: country, regional and global estimates. WHO, Geneva.
-
United Nations Children’s Fund (2019) Low birthweight. UNICEF dataset.
-
Gupta M, Rao C, Lakshmi PV, Prinja S, Kumar R (2016) Estimating mortality using data from civil registration: a cross-sectional study in India. Bull World Health Organ 94(1): 10-21.
-
Yadav H, Lee N (2013) Maternal factors in predicting low birth weight babies. Med J Malaysia 68(1): 44-47.
-
Park K (2000) Preventive medicine in obstetrics, paediatrics and geriatrics. In: Park’s textbook of preventive and social medicine. Banarsidas Bhanot, Jabalpur, India, pp:605.
-
Devaguru A, Gada S, Potpalle D, Eshwar MD, Purwar D (2023) The Prevalence of Low Birth Weight Among Newborn Babies and Its Associated Maternal Risk Factors: A Hospital-Based Cross-Sectional Study. Cureus 15(5): e38587.
-
Begum K, Islam MN, Hossain MA, Ali MA, Islam MK, et al. (2017) Risk Factors and Immediate Outcome of Very Low Birth Weight Babies (Appropriate for Gestational Age) In Newly Established SCANU, Mymensingh Medical College Hospital. Mymensingh Med J 26(3): 477-482.
-
Maruoka K, Yagi M, Akazawa K, Kinukawa N, Ueda K, et al. (1998) Risk factors for low birth weight in Japanese infants. Acta Paediatr 87(3): 304-309.
-
Miller HC, Jekel JF (1989) Epidemiology of spontaneous premature rupture of membranes: factors in pre-term births. Yale J Biol Med 62(3): 241.
-
Najmi RS (2000) Distribution of birth weights of hospital born Pakistani infants. J Pak Med Assoc 50(4): 121.
-
Alsamae AA, Elzilal HA, Alzahrani E, Abo-Dief HM, Sultan MA (2023) A Comparative Cross-sectional Study on Prevalence of Low Birth Weight and its Anticipated Risk Factors. Global Pediatric Health 10: 2333794X231203857.
-
Salgado CM, Jardim PC, Teles FB, Nunes MC (2009) Low birth weight as a marker of changes in ambulatory blood pressure monitoring. Arq Bras Cardiol 92: 113-121.
-
Shortland DB, Evans DH, Levene MI (1988) Blood pressure measurements in very low birth weight infants over the first week of life. J Perinat Med 16(2): 93-98.
-
Sutan R, Mohtar M, Mahat AN, Tamil AM (2014) Determinant of low-birth-weight infants: A matched case control study. Open J Prev Med 2014.
- Postpartum Maternal Mental Health - A Narrative Review
- Beta HCG in Cervico-Vaginal Secretion as a Predictor of Preterm Delivery
- Successful Management of Mid Trimester Foetal Death with Major Placenta Previa by Expectant Management Followed by Induction of Labour
- Impact of Maternal Obesity on Maternal and Foetal Outcomes: A Prospective Cohort Study from Northern India
- ‘’Benefit of Pulsatile GnRH Therapy in Treatment of Functional Hypothalamic Amenorrhea (FHA) and Congenital Hypogonadotropic Hypogonadism(CHH) in Infertile Patients Over Canonical Gonadotropins with IVF –A Short Communication’’
- Clinical Study to Determine the Effectiveness of Pulsatilla Nigricans in the Management of Hypothyroidism with PCOD