What Percentage of Mortality were Medically Certified among Total Registered Mortality in 36 States & UTs of India During 2018-2020 and COVID-19 Mortality Age-Sex Distribution Pattern in India: A Cross Sectional Observational Research Study
The most significant event of birth and death must be certified medically / non-medically to prove or support the evidence of existence of birth and death of a particular person legal existence between the certified date / timings of birth and death. Apart from this legal significance, footage of births and mortality is central basic data required for policy and planning about a population group / country such as provisioning of fundamental requirements like food, cloth, housing, health care, transportation, education etc. The national / state programmes planning, management, implementation can be effectual and triumphant only if this statistical information of birth and death is specific, reliable, timely and correct. Hence, the certification / registration of births and mortality are significant as well as necessity of modern era. We aimed to assess percentage of mortality medically certified among total registered mortality in 36 States & UTs of India during 2018-2020 and COVID-19 mortality age-sex distribution pattern in India during 2020 medically certified due to pandemic in India with available data resources. The mortality data for this cross sectional retrospective observational study were obtained through Civil Registration System of India under the RBD Act, 1969. The data available were obtained on medically certified cause of deaths from States/UTs has been collected, tabulated, analysed in compliance with the ICD - Tenth Revision (1993). The total registered death during 2018 was 6911197 for 2019 it was 7596849 and in 2020 8062070. The figure increased continuously during successive years but there is a question mark on this data. The total RD increased by 685652 numbers in 2019 compared to 2018 whereas despite the COVID-19 PANDEMIC impact the increase in figures during 2020 was 240148 only which are highly questionable? The researcher found that this controversy is also raised by several global highly accredited international organizations like WHO etc. This research study revealed that Bihar which is second most populous state in India ranked lowest in medical certification of cause of death, 2020 which is amazing. Bihar ranked lowest with only 3.4 percent medically certified deaths during 2020 the COVID-19 pandemic era. Hence a large number of mortality during COVID-19 era remains uncertified till date in states like Bihar. This observational research study revealed that the majority of COVID-19 mortality was found in the age group of 45 years and above accounting for 82.7 per cent of total deaths in the group. The percentage of female mortality aged 34 years and below as well as for 55-64 years age group and 65-69 years age group, to total female deaths are greater in comparison to corresponding age groups mortality for male while in other groups male mortality were more than females. Particularly in poor states like Bihar in India the lower socio-economic strata of population may be more affected by low MCCD which is chiefly due to failure of Public Health Management related largely to corruption, posting and other scams. Bihar ranked lowest with only 3.4 percent medically certified deaths during 2020 the COVID-19 pandemic era. Hence a large number of mortality during COVID-19 era remains uncertified till date in states like Bihar. The researcher has found that in states like Bihar the total registered deaths have increased continuously during study period while MCCD decreased continuously during the study period which is due to failure of public health management and corruption, posting scams etc., by which such states are putting highly incapable / untrained person on state programme officer etc vital posts. These irregularities or ignorance have put India’s data credibility in doubt at international level bringing shame to the nation
Introduction
Background/Rationale
The most significant event of birth and death must be certified medically / non-medically to prove or support the evidence of existence of birth and death of a particular person legal existence between the certified date / timings of birth and death. Apart from this legal significance, footage of births and mortality is central basic data required for policy and planning about a population group / country such as provisioning of fundamental requirements like food, cloth, housing, health care, transportation, education etc as per Universal Declaration of Human Rights (UDHR) [1]. The national / state programmes planning, management, implementation can be effectual and triumphant only if this statistical information of birth and death is specific, reliable, timely and correct. Hence, the certification / registration of births and mortality are significant as well as necessity of modern era [2]. Not only the registration of birth and death, but also its growth and cause are equally significant [2A]. Statistical data analysis of causes of mortality forms an important morbidity & mortality statistics for National Health Policy and Planning. Medical Certification of Cause of Death (MCCD) serves dual purpose, firstly legal document of mortality for getting insurance benefits etc. such as in several countries and also in India during coronavirus disease-2019 (COVID-19) the Government of India and state governments are providing compensation for COVID-19 deaths provided the deceased death is certified properly [3, 4]. Secondly mortality statistics play an important role in medical research to improve diagnosis and treatment protocols [3]. Registration of Births and Deaths Act ((Act No. 18 of 1969)) in India was passed in the year 1969 making registration of these events mandatory [5]. The Registrar General of India is the highest official who compiles and provides the necessary information about mortality and births arriving in progression from registrars & sub-registrars of district level, Municipal, and Military Cantonments [5]. WHO (World Health Organization), have raised a question mark on the current birth and death registration systems in India, as well as on several global countries, for under reporting of COVID-19 mortality [6, 7]. The researchers pre-print is also available on Impact of Civil Authorities Faulty Mortality Registration on COVID-19 Mortality Count and the researcher quest to know more about the real scenario of birth and death have raised the titled mentioned research question elaborated and explained in this paper [8]. A lack of dedicated public health management cadre as well as corruption and posting scams in some states like Bihar may be responsible for such faulty reporting [9]. The Section 10(2) of the Registration of Births and Deaths Act empowers the State Govt. to put into effect the prerequisite relating to medical certification of cause of mortality in specified areas while Section 10(3) of the Act provides for making a certificate of the cause of mortality by the medical practitioner who has treated / attended the deceased at the time of mortality. In India at present, all the hospitals are not part of the scheme [4]. The Medical Certification of Cause of Death (MCCD) is of enormous use to several key stakeholders of health and other sectors like health planners, policy makers / implementers, researchers and epidemiologists for data -based management with regard to resource distribution, monitoring of indicators for performance / output etc., identifying the top priorities for state / national health or other programs such as Ayushman Bharat Yojna and other interrelated activities in the area of research / Public Health / other sectors like insurance. COVID-19 mortality age-sex distribution pattern in India are important indicators for evidence-based monitoring of COVID-19 in the population. The Conference on Vital Statistics in 1961 had recommended the scheme of MCCD which evolved in three phases with first phase in the teaching hospitals of the State including field areas attached to them, missionary hospitals etc., second phase extended to District & Sub-division hospitals, specialized hospitals, private hospitals and third phase added private and other public hospitals & Primary Health Units, private physicians practicing modern medicine [5]. Legally RBD is statutory backed under sections 10(2), 10(3), 17(1) (b) and 23(3) of the Registration of Births &Deaths (RBD) Act, 1969. World Health Organization (WHO) at regular intervals reviews the arrangement of International Classification of Diseases (ICD); tenth amendment of the ICD (ICD-10) was certified by the 43rd World Health Assembly (WHA) in May 1990 and adopted in the ORGI (Office of the Registrar General & Census Commissioner, India) for categorization of causes of deaths since 1999 report on MCCD. The latest ICD-11 was adopted by the 72nd WHA in 2019 effective from 1st January 2022 [10, 9]. In the year 2020, as per recommendation of WHO the Indian Council of Medical Research (ICMR), recommended codes for covering Covid 19 related mortality (U07.1 and U07.2) as a separate major cause group. Covid 19 related mortality contributed for 8.9 per cent in total medically certified deaths with shares of 9.8 % and 7.1 % of males and females respectively [5, 11].
Objectives
The States & UTs of India has been harshly affected by the COVID-19 pandemic which has not resolved till date; although the new cases and new mortality is greatly reduced in India as well as on global basis. The certified mortality and mortality associated with COVID-19 is still under controversy as mentioned above in the background. This research study aimed to assess percentage of (including COVID-19) mortality medically certified among total registered deaths in 36 States & UTs of India for the period 2018-2020 as well as trends of COVID-19 mortality age-sex distribution pattern in India during 2020 which are medically certified due to COVID-19 pandemic in India with available data resources.
Methods
Study Design
The mortality figures for this novel cross sectional retrospective observational research study were obtained through CRS (Civil Registration System) of India established under the RBD Act, 1969. The data available were obtained on medically certified cause of deaths from States/UTs has been collected, tabulated, analysed in compliance with the ICD - Tenth Revision (1993). Deaths due to Covid-19 (U07.1 and U07.2) were added as mentioned above. The statistics on percentage of mortality medically certified among total registered mortality in 36 States & UTs of India during 2018- 2020 and COVID-19 mortality age-sex distribution pattern in India were derived with the use of Microsoft office and stata software and presented, cross tabulating them by indicators of the deceased. The time series data analysis of MCCD by major cause groups for different years will be added in next version.
Setting
The necessary data for the title mentioned research question were collected from CRS (civil registration system) for different states and UTs (union territories) for the title mentioned period and analyzed for specificity, measurability, credibility, reproducibility, and timeliness -see Table-1, 2, 3,
| S.No. | State / Union Territory | Total Registered Deaths | Medically Certified Deaths (Total) | Percentage Of Medically Certified Deaths To Total Registered Deaths | ||||||
|---|---|---|---|---|---|---|---|---|---|---|
| 2018 | 2019 | 2020 | 2018 | 2019 | 2020 | 2018 | 2019 | 2020 | ||
| 1 | Andhra Pradesh | 375777 | 401472 | 455000 | 55933 | 51659 | 101353 | 14.9 | 12.9 | 22.3 |
| 2 | A & N Islands | 2237 | 2616 | 2951 | 1331 | 1573 | 1871 | 59.5 | 60.1 | 63.4 |
| 3 | Arunachal Pradesh | 3860 | 3490 | 3475 | 1271 | 1166 | 1160 | 32.9 | 33.4 | 33.4 |
| 4 | Assam | 142605 | 163057 | 187085 | 17118 | 28048 | 36785 | 12 | 17.2 | 19.7 |
| 5 | Bihar | 213989 | 359349 | 425047 | 29112 | 18233 | 14591 | 13.6 | 5.1 | 3.4 |
| 6 | Chandigarh | 23330 | 23592 | 18370 | 16757 | 17564 | 12200 | 71.8 | 74.4 | 66.4 |
| 7 | Chhattisgarh | 177549 | 188211 | 191938 | 35149 | 40208 | 41358 | 19.8 | 21.4 | 21.5 |
| 8 | Dadra & Nagar Haveli and Daman & Diu | 2174 | 2705 | 3414 | 1175 | 1255 | 2269 | 54 | 46.4 | 66.5 |
| Daman & Diu** | 1169 | 1162 | ---- | 1062 | 629 | ---- | 90.8 | 54.1 | ----- | |
| 9 | Delhi | 145533 | 145284 | 142789 | 90701 | 89668 | 80866 | 62.3 | 61.7 | 56.6 |
| 10 | Goa | 13072 | 13851 | 14601 | 13071 | 13851 | 14601 | 100 | 100 | 100 |
| 11 | Gujarat | 433256 | 462284 | 523892 | 101166 | 98563 | 107983 | 23.4 | 21.3 | 20.6 |
| 12 | Haryana | 185842 | 188910 | 212238 | 37819 | 36641 | 29699 | 20.4 | 19.4 | 14 |
| 13 | Himachal Pradesh | 41833 | 43633 | 44449 | 6289 | 5688 | 6445 | 15 | 13 | 14.5 |
| 14 | Jammu & Kashmir * | 39410 | 44227 | 53070 | NA | NA | NA | NA | NA | NA |
| 15 | Jharkhand | 102729 | 119374 | 119037 | 4709 | 6911 | 7313 | 4.6 | 5.8 | 6.1 |
| 16 | Karnataka | 483511 | 508584 | 551808 | 150415 | 154526 | 158603 | 31.1 | 30.4 | 28.7 |
| 17 | Kerala | 258530 | 270567 | 250983 | 30894 | 31511 | 28192 | 11.9 | 11.6 | 11.2 |
| 18 | Laddakh | ---- | ---- | 742 | ---- | ---- | NA | ---- | ---- | ---- |
| 19 | Lakshadweep | 314 | 336 | 342 | 298 | 322 | 341 | 94.9 | 95.8 | 99.7 |
| 20 | Madhya Pradesh | 424257 | 493328 | 524454 | 44467 | 44915 | 35105 | 10.5 | 9.1 | 6.7 |
| 21 | Maharashtra | 667900 | 693800 | 808783 | 232416 | 265132 | 345760 | 34.8 | 38.2 | 42.8 |
| 22 | Manipur | 4476 | 2990 | 2230 | 2299 | 2013 | 2266 | 51.4 | 67.3 | 100 |
| 23 | Meghalaya | 14779 | 18298 | 19191 | 6370 | 6023 | 4566 | 43.1 | 32.9 | 23.8 |
| 24 | Mizoram | 5525 | 6606 | 6703 | 3254 | 3428 | 3329 | 58.9 | 51.9 | 49.7 |
| 25 | Nagaland | 828 | 2266 | 2509 | 238 | 273 | 191 | 28.7 | 12 | 7.6 |
| 26 | Odisha | 328799 | 342947 | 362982 | 36407 | 43191 | 59296 | 11.1 | 12.6 | 16.3 |
| 27 | Puducherry | 12839 | 13255 | 12923 | 9499 | 9455 | 10231 | 74 | 71.3 | 79.2 |
| 28 | Punjab | 213234 | 215045 | 229846 | 36448 | 37607 | 39621 | 17.1 | 17.5 | 17.2 |
| 29 | Rajasthan | 443173 | 451315 | 477151 | 58145 | 62782 | 77626 | 13.1 | 13.9 | 16.3 |
| 30 | Sikkim | 3386 | 3308 | 3543 | 1438 | 1510 | 1648 | 42.5 | 45.6 | 46.5 |
| 31 | Tamil Nadu | 574006 | 633897 | 687212 | 258259 | 278887 | 295539 | 45 | 44 | 43 |
| 32 | Telangana | 136528 | 228294 | 203127 | 51068 | 63236 | 62796 | 37.4 | 27.7 | 30.9 |
| 33 | Tripura | 29080 | 30419 | 31645 | 6481 | 10258 | 11160 | 22.3 | 33.7 | 35.3 |
| 34 | Uttarakhand | 47894 | 66313 | 62219 | 5318 | 5876 | 7305 | 11.1 | 8.9 | 11.7 |
| 35 | Uttar Pradesh | 906653 | 944596 | 873419 | 46310 | 61335 | 109688 | 5.1 | 6.5 | 12.6 |
| 36 | West Bengal | 490530 | 551695 | 606714 | 63336 | 77603 | 99931 | 12.9 | 14.1 | 16.5 |
| Total | 6950607 | 7641076 | 8115882 | … | … | … | … | … | … | |
| Total MCCD Reporting State/UTs | 6911197 | 7596849 | 8062070 | 1456023 | 1571540 | 1811688 | 21.1 | 20.7 | 22.5 |
Table 1: Percentage of Medical Certification in States/UTs during 2018-2020. Note: - NA: Data Not Available,*Includes figures of
| Age Group (in Years) | COVID Deaths Virus identified -Male | COVID Deaths Virus Identified-Female | COVID Deaths Virus not-identified Male | COVID Deaths Virus not-identified Female | Total Covid Deaths Male | Total Covid Deaths Female | Total | |
|---|---|---|---|---|---|---|---|---|
| 1 | <1 | 145 | 61 | 21 | 14 | 166 | 75 | 241 |
| 2 | 4-Jan | 59 | 44 | 59 | 39 | 118 | 83 | 201 |
| 3 | 14-May | 169 | 122 | 332 | 255 | 501 | 377 | 878 |
| 4 | 15-24 | 810 | 566 | 1162 | 626 | 1972 | 1192 | 3164 |
| 5 | 25-34 | 2572 | 1068 | 1749 | 860 | 4321 | 1928 | 6249 |
| 6 | 35-44 | 6630 | 2383 | 1832 | 802 | 8462 | 3185 | 11647 |
| 7 | 45-54 | 14621 | 5695 | 2517 | 1089 | 17138 | 6784 | 23922 |
| 8 | 55-64 | 24282 | 9783 | 2918 | 1462 | 27200 | 11245 | 38445 |
| 9 | 65-69 | 14937 | 6259 | 1421 | 631 | 16358 | 6890 | 23248 |
| 10 | 70 Years or above | 31374 | 12133 | 2622 | 1163 | 33996 | 13296 | 47292 |
| 11 | Age Not Stated | 3728 | 1272 | 257 | 74 | 3985 | 1346 | 5331 |
| TOTAL | 99327 | 39386 | 14890 | 7015 | 114217 | 46401 | 160618 |
Table 2: Age distribution of deaths due to COVID 19 (Codes for Special Purposes) under MCCD-202
| S.No. | Age Group (in Years) | Male | Female | Total | |||
|---|---|---|---|---|---|---|---|
| Number | Percentage | Number | Percentage | Number | Percentage | ||
| 1 | <1 | 166 | 0.1 | 75 | 0.2 | 241 | 0.2 |
| 2 | 4-Jan | 118 | 0.1 | 83 | 0.2 | 201 | 0.1 |
| 3 | 14-May | 501 | 0.4 | 377 | 0.8 | 878 | 0.5 |
| 4 | 15-24 | 1972 | 1.7 | 1192 | 2.6 | 3164 | 2 |
| 5 | 25-34 | 4321 | 3.8 | 1928 | 4.2 | 6249 | 3.9 |
| 6 | 35-44 | 8462 | 7.4 | 3185 | 6.9 | 11647 | 7.3 |
| 7 | 45-54 | 17138 | 15 | 6784 | 14.6 | 23922 | 14.9 |
| 8 | 55-64 | 27200 | 23.8 | 11245 | 24.2 | 38445 | 23.9 |
| 9 | 65-69 | 16358 | 14.3 | 6890 | 14.8 | 23248 | 14.5 |
| 10 | 70 Years or above | 33996 | 29.8 | 13296 | 28.7 | 47292 | 29.4 |
| 11 Age Not Stated | 3985 | 3.5 | 1346 | 2.9 | 5331 | 3.3 | |
| TOTAL | 114217 | 100 | 46401 | 100 | 160618 | 100 |
Table 3: Age distribution of deaths due to COVID 19 in percentage (Codes for Special Purposes) under MCCD-2020.
Participants
Participants were all states and union territories of India reporting as per above mentioned guidelines. The selections of participants were purely on the basis of available data of MCCD.
Variables
All the variables are mentioned in tables 1-5. Data sources/measurement Source: CRS Report 2018-2019-2020 available at - https:// crsorgi.gov.in/mccd-reports.html Statistical analysis of COVID-19 mortality With more data in next version we will discuss statistical analysis and inferences.
| Var-Obs-age groups | Mean | Std. Dev. | Min | Max | Std. Err. | [95% Conf. Interval] | |
|---|---|---|---|---|---|---|---|
| COVID Deaths Virus identified -Male | 11 | 9029.727 | 10858.7 | 59 | 31374 | 3274.022 | 1734.751 -16324.7 |
| COVID Deaths Virus Identified- Female | 11 | 3580.545 | 4269.423 | 44 | 12133 | 1287.279 | 712.3082 -6448.783 |
| COVID Deaths Virus not- identified- Male | 11 | 1353.636 | 1073.972 | 21 | 2918 | 323.8147 | 632.1322 -2075.141 |
| COVID Deaths Virus not- identified- Female | 11 | 637.7273 | 494.7056 | 14 | 1462 | 149.1593 | 305.3795 -970.075 |
| Total Covid Deaths Male | 11 | 10383.36 | 11752.64 | 118 | 33996 | 3543.553 | 2487.835- 18278.89 |
| Total Covid Deaths- Female | 11 | 4218.273 | 4671.669 | 75 | 13296 | 1408.561 | 1079.802 -7356.743 |
Results
It is a well-established fact that a very few percentage of death in India is registered [8]. Out of this few percentage of mortality registered the MCCD is also only a few percent of mortality registered. Hence for COVID-19 deaths it is evident from this study that only a few percentages were certified as mortality due to Covid-19. This research study revealed that during the year 2020, MCCD to total RD (registered deaths) has increased by 1.8 percent as compared to 2019 (last year).
![Figure 1: Total RD and MCCD for 2018-2019-2020. This increase was chiefly due to two reasons; first and most important was COVID-19 and secondly improvement in MCCD by some states leading to gross improvement at national level – see tables 1-5 and figures 1-5 for better understanding of the scenario and issues. The total registered death during 2018 was 6911197 for 2019 it was 7596849 and in 2020 8062070. The figure increased continuously during successive years but there is a question mark on this data. The total RD increased by 685652 numbers in 2019 compared to 2018 whereas despite the COVID-19 PANDEMIC impact the increase in figures during 2020 was 240148 only which are highly questionable? The researcher found that this controversy is also raised by several global highly accredited international organizations like WHO etc [8]. The total MCCD during 2018 was 1456023 for 2019 it was 1571540 and in 2020 1811688, see table-1 and figure-1. The figure increased continuously during successive years and The total MCCD increased by 115517 numbers in 2019 compared to 2018 whereas despite the COVID-19 PANDEMIC impact the increase in figures during 2020 was 240148 only which are highly questionable? The researcher found that this controversy is also raised by several global highly accredited international organizations like WHO etc [8].](/fulltextimages/9273/fig_1.png)
Figure 1: Total RD and MCCD for 2018-2019-2020. This increase was chiefly due to two reasons; first and most important was COVID-19 and secondly improvement in MCCD by some states leading to gross improvement at national level – see tables 1-5 and figures 1-5 for better understanding of the scenario and issues. The total registered death during 2018 was 6911197 for 2019 it was 7596849 and in 2020 8062070. The figure increased continuously during successive years but there is a question mark on this data. The total RD increased by 685652 numbers in 2019 compared to 2018 whereas despite the COVID-19 PANDEMIC impact the increase in figures during 2020 was 240148 only which are highly questionable? The researcher found that this controversy is also raised by several global highly accredited international organizations like WHO etc [8]. The total MCCD during 2018 was 1456023 for 2019 it was 1571540 and in 2020 1811688, see table-1 and figure-1. The figure increased continuously during successive years and The total MCCD increased by 115517 numbers in 2019 compared to 2018 whereas despite the COVID-19 PANDEMIC impact the increase in figures during 2020 was 240148 only which are highly questionable? The researcher found that this controversy is also raised by several global highly accredited international organizations like WHO etc [8].
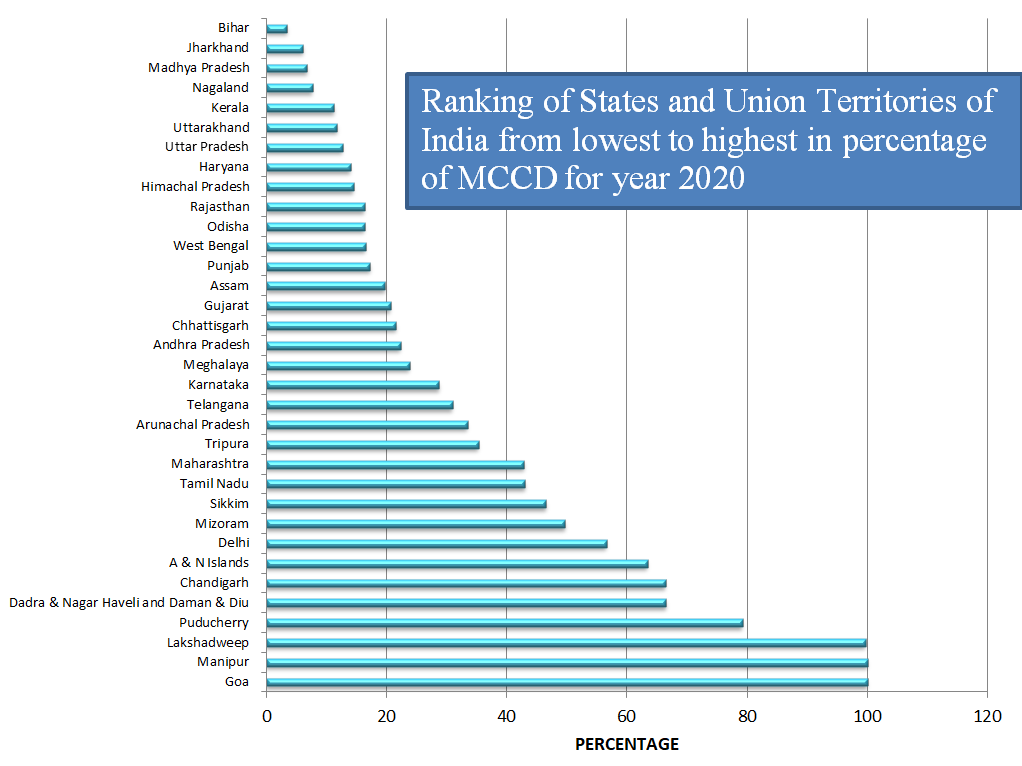
This research study revealed that MCCD declined in 11 States/UTs in 2020 compared to the previous year 2019. These states were Arunachal Pradesh, Bihar, Chandigarh, Delhi, Haryana, Kerala, Madhya Pradesh, Meghalaya, Mizoram, Nagaland and Telangana. This research study revealed that Bihar which is second most populous state in India ranked lowest in medical certification of cause of death, 2020 which is amazing see- Table 5 and Figure 5.
| State/Union Territory | Total Registered Deaths | Total Medically Certified Deaths | Percentage of Medically Certified Deaths to Total Registered Deaths | Rank of State/ Union Territory |
|---|---|---|---|---|
| Goa | 14601 | 14601 | 100 | 1 |
| Manipur | 2230 | 2266 | 100 | 2 |
| Lakshadweep | 342 | 341 | 99.7 | 3 |
| Puducherry | 12923 | 10231 | 79.2 | 4 |
| Dadra & Nagar Haveli and Daman & Diu | 3414 | 2269 | 66.5 | 5 |
| Chandigarh | 18370 | 12200 | 66.4 | 6 |
| A & N Islands | 2951 | 1871 | 63.4 | 7 |
| Delhi | 142789 | 80866 | 56.6 | 8 |
| Mizoram | 6703 | 3329 | 49.7 | 9 |
| Sikkim | 3543 | 1648 | 46.5 | 10 |
| Tamil Nadu | 687212 | 295539 | 43 | 11 |
| Maharashtra | 808783 | 345760 | 42.8 | 12 |
| Tripura | 31645 | 11160 | 35.3 | 13 |
| Arunachal Pradesh | 3475 | 1160 | 33.4 | 14 |
| Telangana | 203127 | 62796 | 30.9 | 15 |
| Karnataka | 551808 | 158603 | 28.7 | 16 |
| Meghalaya | 19191 | 4566 | 23.8 | 17 |
| Andhra Pradesh | 455000 | 101353 | 22.3 | 18 |
| Chhattisgarh | 191938 | 41358 | 21.5 | 19 |
| Gujarat | 523892 | 107983 | 20.6 | 20 |
| Assam | 187085 | 36785 | 19.7 | 21 |
| Punjab | 229846 | 39621 | 17.2 | 22 |
| West Bengal | 606714 | 99931 | 16.5 | 23 |
| Odisha | 362982 | 59296 | 16.3 | 24 |
| Rajasthan | 477151 | 77626 | 16.3 | 25 |
| Himachal Pradesh | 44449 | 6445 | 14.5 | 26 |
| Haryana | 212238 | 29699 | 14 | 27 |
| Uttar Pradesh | 873419 | 109688 | 12.6 | 28 |
| Uttarakhand | 62219 | 7305 | 11.7 | 29 |
| Kerala | 250983 | 28192 | 11.2 | 30 |
| Nagaland | 2509 | 191 | 7.6 | 31 |
| Madhya Pradesh | 524454 | 35105 | 6.7 | 32 |
| Jharkhand | 119037 | 7313 | 6.1 | 33 |
| Bihar | 425047 | 14591 | 3.4 | 34 |
| Total | 8062070 | 1811688 | 22.5 |
Table 5: Ranking of States/UTs of India in medical certification of cause of death, 2020.
The MCCD data of UTs of J&K and Laddakh were not available. During the years 2018-2020, Daman & Diu, A & N Islands, Chandigarh, Dadra & Nagar Haveli and Manipur and Puducherry had issued MCCD for more than 50 percent of registered deaths. The percentage of MCCD increased in Rajasthan, Sikkim, Tripura, Uttar Pradesh, A & N Islands, Assam, Chhattisgarh, Lakshadweep, Maharashtra, Manipur, Odisha, and West Bengal during 2018-2020 periods. Manipur and Goa has 100 percent MCCD during 2020 –See Table-5- Figure-2. Bihar ranked lowest with only 3.4 percent medically certified deaths during 2020 the COVID-19 pandemic era. Hence a large number of mortality during COVID-19 era remains uncertified till date in states like Bihar. In 2020 there were 18, 11,688, in 2018 it was 1456023 and in 2019 1571540 total medically certified deaths. The actual the number of registered mortality at National level is 81, 15,882 and figure 80, 62,070 comes after excluding the figures of registered deaths from Jammu & Kashmir and Laddakh as per Vital Statistics of India based on CRS (Civil Registration System), 2020. MCCD in the year 2020 accounted for 22.5 per cent of total registered deaths while for the year 2018-21.1% and 20.7% for 2019 at National level (including figures of 34 States/UTs).
The ranking of States/UTs on the basis of percentage of MCCD to total registered deaths for the year 2020 shows that Manipur & Goa are top rankers with cent per cent registered deaths medically certified, followed by Lakshadweep with 99.7 per cent MCCD, 79.2 per cent in Puducherry, 66.5 per cent in D & N Haveli and Daman & Diu, 66.4 per cent in Chandigarh, 63.4 per cent in A & N Islands, 56.6 per cent in Delhi. Amongst bigger States, Tamil Nadu MCCD were 43.0 per cent followed by Maharashtra 42.8 per cent, Telangana 30.9 per cent, Karnataka 28.7 per cent, Andhra Pradesh 22.3 per cent and Gujarat 20.6 per cent see table-5 and figure-5. Bihar ranked lowest with only 3.4% MCCD followed by Jharkhand – 6.1%, Madhya Pradesh-6.7% and Nagaland-7.6%.
Deaths Reported under Covid 19
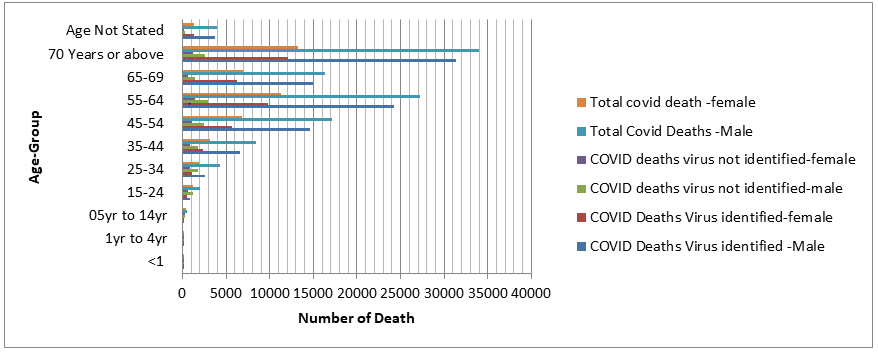
COVID-19 associated mortality were leading cause group accounting for 8.9 per cent of total medically certified deaths at national level. Gender analysis revealed that 9.8 per cent of male and 7.1 per cent of female were medically certified as COVID-19 mortality at national level. The age distribution and statistical analysis of medically certified deaths due to Covid 19 for the cases of virus identified and not identified i.e. U07.1 & U07.2 were presented in Table 2, 3, 4 and figure 3, 4 and 5. More description and analysis will be discussed in next version with more data. In MCCD, as discussed earlier an urgent situation ICD-10 code of ‘U07.1 COVID 19, virus identified’ is imparted to diagnosis of COVID-19 which was definite by laboratory testing whereas ICD-10 code of ‘U07.2 COVID-19, virus not identified’ is imparted to a clinical or epidemiological diagnosis of COVID-19 in the circumstances where laboratory verification is unconvincing or not available. Both these codes U07.1 and U07.2 were used by the States/UTs for COVID-19 mortality coding as the cause of mortality. Table-2 shows that out of total 1,60, 618 COVID-19 associated mortality the virus was acknowledged in 1, 38,713
deceased whereas it was not confirmed in 21,905 cases.
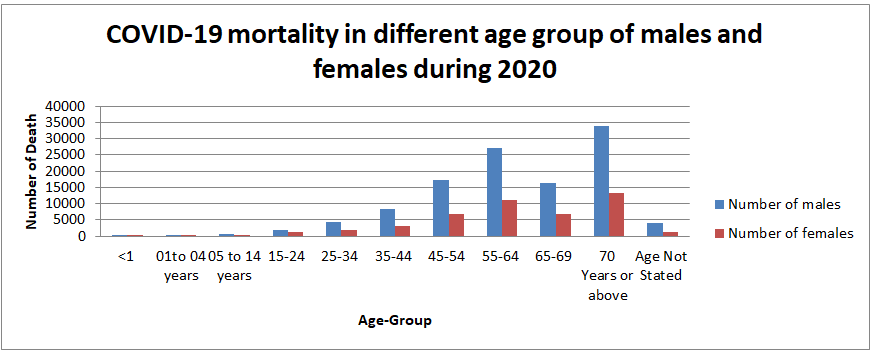
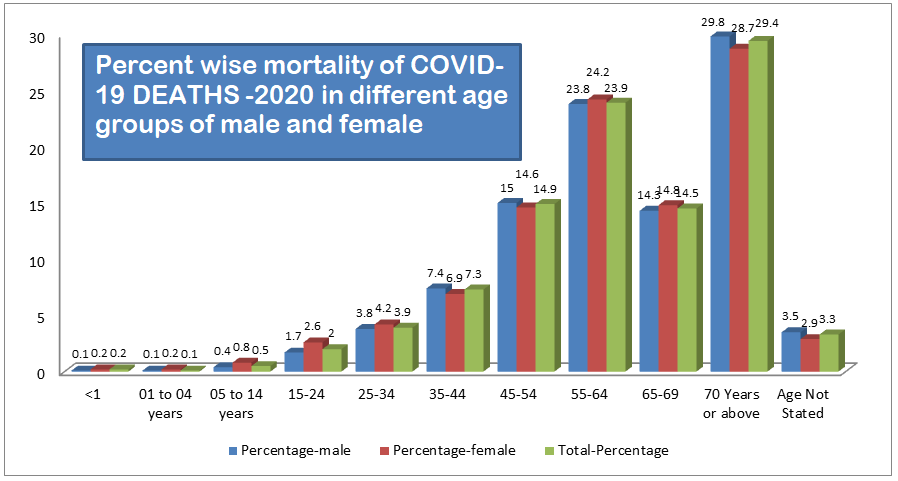
Table 3 and Figure 5 shows that, the maximum percentage of death of 29.4 % was in the age group of 70 years or above followed by 55-64 years age group accounting for 23.9 % while the age group of 65-69, with class interval of only 5 years accounted for significant 14.5 per cent of COVID-19 mortality. This observational research study revealed that the majority of COVID-19 mortality was found in the age group of 45 years and above accounting for 82.7 per cent of total deaths in the group. The percentage of female mortality aged 34 years and below as well as for 55-64 years age group and 65-69 years age group, to total female deaths are greater in comparison to corresponding age groups mortality for male while in other groups male mortality were more than females. Out of the total 1, 60,618 MCCD as COVID-19 deaths; 1, 14,217 male and 46,401 female died due to COVID-19, which indicates that COVID-19 is more detrimental for males. The age and sex wise allocation of COVID-19 mortality is shown in table-2, 3, 4 and figures 3, 4, 5.
Discussion & Conclusion
The States/UTs of India differs widely in MCCD ranging from 3.4 percent in Bihar to cent per cent registered deaths medically certified in Goa and Manipur. This research study revealed that very few COVID-19 deaths were certified as mortality due to Covid-19. In LMICs (Low and middle income countries) like India where a great majority of people are living below poverty line such low rate of MCCD may affect badly the poor socio-economic strata from receiving compensations and insurances money [4]. Particularly in poor states like Bihar in India the lower socio-economic strata of population may be more affected by low MCCD which is chiefly due to failure of Public Health Management related largely to corruption, posting and other scams [7, 8]. Bihar ranked lowest with only 3.4 percent medically certified deaths during 2020 the COVID-19 pandemic era. Hence a large number of mortality during COVID-19 era remains uncertified till date in states like Bihar.
The researcher has found that in states like Bihar the total registered deaths have increased continuously during study period while MCCD decreased continuously during the study period which is due to failure of public health management and corruption, posting scams etc., by which such states are putting highly incapable / untrained person on state programme officer etc vital posts [9]. These irregularities or ignorance have put India’s data credibility in doubt at international level bringing shame to the nation. Here it is important to mention that birth rate / numbers and death rate/numbers are vital indicators of wellbeing of a nation as well as it takes a long time to change these parameters through public health management. Abrupt changes can occur due to natural or manmade calamities like war, COVID-19 pandemic etc. Despite COVID-19 situation the trends in RD and MCCD had not shown any big change which has raised questions as elaborated earlier. The states and UTs of India should have a robust framework for more dynamic implementation of the provisions on MCCD in future for providing specific, measurable, accurate, reliable and timely data to reduce the time gap in availability of significant information necessary for enormous use to several key stakeholders of health and other sectors like health planners, policy makers / implementers, researchers and epidemiologists for data -based management with regard to resource distribution, monitoring of indicators for performance / output etc., identifying the top priorities for state / national health or other programs such as Ayushman Bharat Yojna and other interrelated activities in the area of research / Public Health / other sectors like insurance [12]. The coverage of medical certification should include all type of hospitals uniformly across the States/UTs of India. All the States and UTs medical colleges and specialized hospitals, district hospitals and Primary Health Centres (PHCs) should be brought under MCCD scope. In order to implement the scheme of MCCD in the country, the Registrar General, India must enforce upon all the States/UTs to bring all public / private hospitals as well as private medical practitioners under provision of MCCD, both in rural as well as urban areas.
Strength and Limitations
This is a novel cross sectional research study with peculiar research question in the context of India. The key limitation is availability of data.
Declarations
- Other information: This is the first version of this work and more versions will evolve in future with more information and analysis.
- Ethics approval and consent to participate: Not applicable. This study has not involved any human or animals in real or for experiments. The submitted work does not contain any identifiable patient/participant information.
- Consent for publication: The author provides consent for publication.
- Availability of data and materials: Electronic records from, Civil Registration System, National Family Health Survey, India, HMIS (health management information system) of MoHFW (ministry of health and family welfare), Government of India, NITI Aayog, NHSRC etc.
- Conflicts of Interest/ Competing Interest: There are no conflicts / competing of interest
- Funding: Self sponsored. No aid taken from individual or agency etc.
- Authors’ contributions: The whole work is done by the Author - Dr Piyush Kumar, M.B.B.S., E.M.O.C., P.G.D.P.H.M., -Senior General Medical Officer- Bihar Health Services- Health Department- Government of Bihar, India and Advocate Anupama-Senior Lawyer, Bar Council, Patna.
- Acknowledgements: I am thankful to Advocate Anupama my wife and daughters Aathmika-Atheeva for cooperation.
References
-
United Nations-Universal Declaration of Human.
-
WHO (2014) Civil registration: why counting births and deaths is important. World Health Organization.
-
UNDP (2015) Why birth and death registration really are “vital” statistics for development. United Nations Development Programme.
-
WHO (1979) Medical certification-of cause of death. World Health Organization.
-
(2021) Government of India National Disaster Management Authority Guidelines for Ex Gratia Assistance to next of kin of the Deceased by Covid-19.
-
(1969) The Registration of Births and Deaths Act, 1969.
-
WHO, The true death toll of COVID-19: estimating global excess mortality. World Health Organization.
-
WHO (2022) Estimating global and country-specific excess mortality during the COVID-19 pandemic. World Health Organization.
-
Piyush K, Anupama (2022) What Can Be Impact of Civil Authorities Faulty Mortality Registration on COVID-19 Mortality Count in the State of Bihar, India- Evidence from NFHS-5. SSRN.
-
Piyush K, Anupama (2022) Establishment of Public Health Management Cadre in India and guidelines for implementation-2022.
-
WHO, International Statistical Classification of Diseases and Related Health Problems (ICD). World Health Organization.
-
(2019) International Statistical Classification of Diseases and Related Health Problems 10th Revision (ICD-10)- WHO Version for; 2019-covid-expanded. Chapter XXII- Codes for special purposes-(U00-U85).
- Intersecting Epidemics and Climate Vulnerabilities in Conflict- Driven Displacement: Epidemiology, Systemic Challenges, and One Health Gaps in South Sudan
- Advancing Domestic Health Financing for Community Health System Sustainability in South Sudan: The Boma Health Initiative Model (2025–2035)
- Prevalence and Correlates of Post-Exposure Prophylaxis Uptake among Men Who Have Sex with Men in Kisumu County, Kenya
- Medical, Ethical, and Legal Conflicts Surrounding Euthanasia in Argentina. Its Global Implications
- Knowledge and Attitude on Menstrual Hygiene among Adolescent Girls Studying in Secondary Level in Public Schools of Chitwan District, Nepal
- Biological Efficacy of an Adulticide Mixture (clothianidin + deltamethrin) as an Indoor Residual Spray against Adult Anopheles flavirostris in Palawan, the Philippines