What are the Impact of Season and Temperature Variations in India on the Number of Adolescent/Adult Mortality Due to Heart Disease / Hypertension – A Cross-Sectional Research Study?
One of the researcher of this study who is also a medical doctor with experience of 18 years have suspected that there are season and temperature variations in India on the number of adolescent/adult mortality due to Heart disease / Hypertension. During regular duties at various Government hospitals, the researcher felt some trends in the title-mentioned research question. Hence the researcher decided to investigate the query mentioned in the title with proper evidence and accredited data. The key purpose is to alert the policy-makers, caregivers, medical doctors, patients, decision-makers, researchers, and citizens of India, etc through evidence-based study to take proper care during the seasonal and temperature variations which may harm persons with Heart disease / Hypertension. There are several research studies done on the impact of season and temperature on hypertension and related mortality which established that a relationship exists between them. Despite being the secondmost populous country of the world with wide variations of seasons/temperature, the researcher has not found any adequate broad country-based study conducted in India for evaluating the impact of temperature / seasonal variation on the number of adolescent/adult mortality due to Heart disease / Hypertension in the general population. CVDs (Heart Diseases) are the most important cause of death accounting for 17.9 million people's mortality globally in 2019, representing 32% of all global mortalities; of which 85% were caused by heart attack and stroke. Hypertension is a serious medical condition of elevated blood pressure that increases the risks of heart diseases; 1.28 billion adults globally have HTN and two-thirds (66%) of these are living in low- and middle-income countries (LMICs) like India. This is a novel cross-sectional research study with the key objective to analyze the impact of season and temperature variations on the mortality trends of adolescents/adults due to Heart disease / Hypertension with the utilization of time-bound accredited data. The title mentioned research question is not well understood to date and this research study tries to find an answer through one factor only i.e. mortality data. This research study was a Country / HMIS (MoHFW) accredited data-based retrospective cross-sectional study conducted across all HMIS registered public/private/rural and urban health facilities of 36 states and UTs (union territories). The study population for this novel research study consisted of any adolescent (10 to 19) / adult (19 and above) of both sexes. The three years of study when combined shows that the Heart disease / Hypertension mortalities were highest in January with 89417 mortalities ([95% CONF. INTERVAL] 84795.48 - 94038.52 ; STD. ERR.-1074.109; MEAN-29805.67; STD. DEV.-620.1374; MIN29346; MAX-30511 followed by September-85633 (95% CONF. INTERVAL- 57391.89 - 113874.1)and December-83682 (95%CONF. INTERVAL -73045.63 - 94318.37) while lowest mortalities were found in April – 66116 (95% CONF. INTERVAL- 49641.4 - 82590.6 ). The mean seasonal mortality for Heart disease / Hypertension mortalities was highest in the Winter Season JanFeb (mean temperature 20.91 C) having mean mortality of 28322.33 followed by post-monsoon (mean temperature 23.59 C) with mean mortality of 27458.33, monsoon (mean temperature 28.44 C) with mean mortality 26197.83 and pre-monsoon (mean temperature 27.91 C) having lowest mean mortality 23302.22.
Introduction
Background/Rationale
One of the researchers of this study who is also a medical doctor with experience of 18 years has suspected that there are season and temperature variations in India on the number of adolescent/adult mortality due to Heart disease / Hypertension. During regular duties at various Government hospitals, the researcher felt some trends in the title-mentioned research question. Hence the researcher decided to investigate the query mentioned in the title with proper evidence and accredited data. The key purpose is to alert the policy-makers, caregivers, medical doctors, patients, decision-makers, researchers, and citizens of India, etc through evidence-based study to take proper care during the seasonal and temperature variations which may harm persons suffering from Heart disease / Hypertension.
There are several research studies done on the impact of season and temperature on hypertension and related mortality which established that a relationship exists between them. For example, a cross-sectional analytic research study on the impacts of seasonal differences on blood pressure extents in children, adolescents, and young adults prepared by Miersch A, et al. [1] found a noteworthy seasonal variation in blood pressure (BP) measurements. This research study found that the mean increase in systolic/ diastolic blood pressure during the winter season was 4.45/2.42 mmHg respectively. This research study also found that an important correlation exists between outdoor temperature and systolic BP [1]. These studies have also prompted the researcher to investigate the title-mentioned research question. Climatic conditions are now a well-known factor that can influence cardiovascular health established through several research studies [2]. Some research studies had also revealed that cardiovascular disease-related morbidity and mortality usually increase during winter which is attributed to several physiological alterations during winter necessary for protecting the body from cold such as a rise in sympathetic activity, change in the blood coagulation profile, endothelial dysfunction, and rise in blood pressure (BP) [3]. Few research studies have shown that BP increases with a decrease in temperature [4]. The climatic conditions are considerably different in different geographical locations, and this is also influencing other diseases such as COVID-19 in India [5, 6]. Several population-based research studies were done about factors affecting seasonal variations in BP such as one done by Goyal A, et al. [7]. One review paper on seasonal patterns of twelve cardiovascular diseases found that there is a seasonal trend in cardiovascular disease (CVD) incidence with the highest numbers of cases in the colder winter months, in many countries [8]. Another research study done by Sinha P ET alia found that the prevalence of hypertension (HTN) in summer is lower in comparison to winter months [9]. Continuous ongoing changes in the global climate can also affect the epidemiology of HTN and also the epidemiology of CVD. One multicenter research study in central China done on the impact of temperature on life loss per death from CVD found that both cold and hot temperatures can cause premature death from CVDs [10].
Despite being the second-most populous country of the world with wide variations of seasons/temperature, the researcher has not found any adequate broad country- based study conducted in India for evaluating the impact of temperature / seasonal variation on the number of adolescent/adult mortality due to Heart disease / Hypertension in the general population. In the light of the above-mentioned truths and facts, we conducted an HMIS (health management information system) -based cross sectional observational research study with accredited data from 36 states and union territories of India including mortalities from all public/private/rural and urban health facilities of India registered with HMIS of MoHFW (Ministry of Health and Family Welfare) [11].
CVDs (Heart Diseases) are the most important cause of death accounting for 17.9 million people’s mortality globally in 2019, representing 32% of all global mortalities; of which 85% were caused by heart attack and stroke [12]. Hypertension is a serious medical condition of elevated blood pressure that increases the risks of heart diseases; 1.28 billion adults globally have HTN and two-thirds (66%) of these are living in low- and middle-income countries (LMICs) like India [13]. According to WHO (World Health Organization), HTN is diagnosed if, when it is observed on two different days that the systolic blood pressure (SBP) measurement on both days is ≥140 mmHg and/or the diastolic blood pressure (DBP) readings on both days is ≥90 mmHg.
Objectives
This is a novel cross-sectional research study with the key objective to analyze the impact of season and temperature variations on the mortality trends of adolescents/adults due to Heart disease / Hypertension with the utilization of time- bound accredited data. The title mentioned research question is not well understood to date and this research study tries to find an answer through one factor only i.e. mortality data. Of course, there are many/several confounders as felt by the researcher such as rural, urban, altitude, latitude, longitude, rainfall, snowfall, diet, stage of disease, exact age, type of facilities where treated, genetics, family history, socioeconomic factors, economic status, education, beliefs, regular/interrupted / no treatments, etc. For a deep understanding and outcome research with a primary survey will be better as felt by the researchers. The primary survey is beyond the reach of researchers due to a lack of funds and support; hence the researcher is analyzing only one factor. In the future if possible this research will be carried out with a primary survey by the researchers.
The key aim of this research study is to determine the impact of season and temperature variations on the mortality trends of adolescents/adults due to Heart disease / Hypertension across 36 states and union territories of India on a cumulative basis from the accredited data source of HMIS. In the next version, the researcher will divide the country state and UTs into different geographical regions according to temperature ranges as the researcher feels that India is having a wide fluctuation in temperature across various regions, for example, Leh-Laddakh is extremely cold compared to coastal areas of India where the temperature variations are less in different seasons compared to plain areas, etc. The researcher had done research earlier by dividing India into different geographical regions to find out the impact of COVID-19 as mentioned above. There are also season and temperature variations across rural and urban areas.
Methods
Study Design
This research study was a Country / HMIS (MoHFW) accredited data-based retrospective cross-sectional study conducted across all HMIS registered public/private/rural and urban health facilities of 36 states and UTs (union territories). The Geographical latitude and longitude division according to temperature/season and analysis of the impact of season and temperature variations on the mortality trends of adolescents/adults due to Heart disease / Hypertension across 36 states and union territories of India will be performed in the next versions.
Enlistment of the HMIS registered public/private/ rural and urban health facilities mortality across 36 states and union territories of India were started in January 2018 Winter season (January - February) and were followed for 4 seasons: Winter Season Jan-Feb, Pre-Monsoon Season Mar-May, Monsoon Season Jun-Sep, Post-Monsoon Season Oct-Dec(°C). These divisions of the season - months were based on observed temperature/season variation in different months in India according to the apex body Indian Meteorological Department (IMD) established for this purpose in the country. On an average temperature basis, the coldest months were Winter Season Jan-Feb, whereas Monsoon Season June to September was registered as the hottest months of the year according to the IMD data.
Setting
This research study evaluated the impact of season and temperature on the prevalence of mortality of adolescents/ adults due to Heart disease / Hypertension across 36 states and union territories of India during the study period i.e. 1st January 2018 to 31st December 2020. This research study examined/investigated a total of 941153 mortality of adolescents/adults due to Heart disease / Hypertension across 36 states and union territories of India during 36 continuous months of study from 1st January 2018 to 31st December 2020. Microsoft office and Stata15.1 software were used for data collection and analysis from HMIS of MoHFW. The researcher feels that more years’ data should be utilized for such studies and this will be available in the next version with 10 plus years of data analysis research.
Participants
Eligible participants were any adolescent/adult who died due to Heart disease / Hypertension in any public/ private/rural/urban health facilities registered on the HMIS database of MoHFW across 36 states and union territories of India during the study period i.e. 1st January 2018 to 31st December 2020. A total of 941153 eligible subjects’ mortalities were included in this research study on an all- India basis. The study population for this novel research study consisted of any adolescent (10 to 19) / adult (19 and above) mortality due to Heart disease / Hypertension across 36 states and union territories of India of both the sexes.
Ethical Considerations
Ethical approval was not applicable as this research study has not done any human or animal trials etc. or involved them in such a way that requires ethical approvals. Added
Meteorological Data
to this, the data utilized is available to the public and we had not disclosed any hidden or secret data. The purpose of this research study is well explained above, and ethical approval is not applicable for such studies in India based on data available in the public domain. The researcher is a medical doctor working for the government of Bihar, India and this research study is a part of the author’s independent self- financed research.
Variables
The key variables for this research study were the meteorological variables data from IMD and mortality data from HMIS which are enlisted below in Tables-1, 2, 3, and 4.
| Year | Winter Season Jan-Feb (°C) | Pre-Monsoon Season Mar-May(°C) | Monsoon Season Jun-Sep(°C) | Post-Monsoon Season Oct-Dec(°C) | |||
|---|---|---|---|---|---|---|---|
| 2020 | 20.79 | 27.58 | 28.45 | 23.75 | |||
| 2019 | 20.71 | 28 | 28.6 | 23.49 | |||
| 2018 | 21.24 | 28.16 | 28.28 | 23.55 | |||
| Statistical analysis of temperature data | |||||||
| Variable | Obs | Mean | Std. Dev. | [95% Conf. Interval] | Std. Err. | Min | Max |
| Winter Season Jan-Feb (°C) | 3Year | 20.91 | 0.29 | 20.20 - 21.62 | 0.16 | 20.71 | 21.24 |
| Pre-Monsoon Season Mar-May(°C) | 3 Year | 27.91 | 0.3 | 27.17 - 28.66 | 0.17 | 27.58 | 28.16 |
| Monsoon Season Jun-Sep(°C) | 3Year | 28.44 | 0.16 | 28.05 -28.84 | 0.09 | 28.28 | 28.6 |
| Post-Monsoon Season Oct- Dec(°C) | 3 Year | 23.59 | 0.14 | 23.26 - 23.93 | 0.08 | 23.49 | 23.75 |
Table1: All India Mean Seasonal Temperature (°C) and statistical analysis of temperature data.
Mortality Data
| Month-Year | Total Number of Adolescent / Adult deaths due to Heart disease/ Hypertension | Month- Year | Total Number of Adolescent / Adult deaths due to Heart disease/Hypertension | Month-Year | Total Number of Adolescent / Adult deaths due to Heart disease/ Hypertension |
|---|---|---|---|---|---|
| 18-Jan | 29346 | 19-Jan | 30511 | 20-Jan | 29560 |
| 18-Feb | 27581 | 19-Feb | 26725 | 20-Feb | 26211 |
| 18-Mar | 25351 | 19-Mar | 25090 | 20-Mar | 22054 |
| 18-Apr | 22365 | 19-Apr | 24068 | 20-Apr | 19683 |
| 18-May | 23535 | 19-May | 25379 | 20-May | 22195 |
| 18-Jun | 24438 | 19-Jun | 25636 | 20-Jun | 23057 |
| 18-Jul | 23840 | 19-Jul | 24770 | 20-Jul | 25758 |
| 18-Aug | 24517 | 19-Aug | 26730 | 20-Aug | 29995 |
| 18-Sep | 24941 | 19-Sep | 28196 | 20-Sep | 32496 |
| 18-Oct | 25881 | 19-Oct | 26666 | 20-Oct | 29275 | |||
|---|---|---|---|---|---|---|---|---|
| 18-Nov | 26863 | 19-Nov | 26137 | 20-Nov | 28621 | |||
| 18-Dec | 27467 | 19-Dec | 26729 | 20-Dec | 29486 | |||
| Total - 2018 | 306125 | Total-2019 | 316637 | Total-2020 | 318391 | |||
| Mean- 2018 | 25510.42 | Mean-2019 | 26386.42 | Mean-2020 | 26532.58 | |||
| Max - 2018 | 29346 | Max-2019 | 30511 | Max-2020 | 32496 | |||
| Min – 2018 | 22365 | Min-2019 | 24068 | Min-2020 | 19683 | |||
| No. of Obs-2018 | 12 | No. of Obs- 2019 | 12 | No. of Obs | 12 | |||
| All three Years Calculation - Number of Adolescent / Adult deaths due to Heart disease/Hypertension related | ||||||||
| Total Number of Adolescent / Adult deaths due to Heart disease/Hypertension related | 941153 | |||||||
| Mean Number of Adolescent / Adult deaths due to Heart disease/Hypertension related | 26143.14 | |||||||
| Max/month Number of Adolescent / Adult deaths due to Heart disease/ Hypertension related | 32496 | |||||||
| Min/month Number of Adolescent / Adult deaths due to Heart disease/ Hypertension related | 19683 | |||||||
| No. of Obs | 36 | |||||||
| Variable | Obs | Total | STD. ERR. | [95% CONF. INTERVAL] | Mean | Std. Dev. | Min | Max |
| Adolescent / Adult deaths due to Heart disease/ Hypertension related | 36 | 941153 | 16325.48 | 908010.5- 974295.5 | 26143.14 | 2720.914 | 19683 | 32496 |
| CONF. INTERVAL of Mean, | ||||||||
| Variable | Obs | Mean | Std. Err. | [95% Conf. Interval] | ||||
| Adolescent / Adult deaths due to Heart disease/Hypertension related | 36 | 26143.14 | 453.4856 | 25222.51 - 27063.76 |
Table2: Number and statistical analysis of total Adolescent / Adult deaths due to Heart disease / Hypertension related in different months and years.
Data Sources/Measurement
Temperature data were collected from IMD whereas the mortality data were collected from HMIS. Measurements were done with the help of Microsoft Office and Stata15.1 software to find out the impact of season and temperature on the prevalence of mortality of adolescents/adults due to Heart disease / Hypertension across 36 states and union territories of India.
Bias
Data from consecutive three years were utilized to reduce the bias. Further, mean temperature for different seasons and mean for other variables were compared for bias reduction. In the next version, more years will be studied for bias reduction and generalizability.
Study Size
A total of 941153 eligible subjects’ mortalities were included in this research study on an all-India basis, see table-2 for details.
Quantitative Variables
See Tables – 1, 2, 3, and 4.
Statistical Analysis
The data was analyzed by Microsoft Office and Stata15.1 statistical software. Data were calculated as mean ± standard deviation as well as 95% C. I (confidence interval) and standard errors etc. were also calculated with the help of original data, see tables-1, 2, 3, 4, and 5 for quantitative variables. Comparisons of mortalities among the four seasons with different mean temperatures were done and results are described in words and charts, see charts – 1, 2, 3, 4, and 5.
| Variable | Obs | Mean | Std. Dev. | Min | Max |
|---|---|---|---|---|---|
| Jan | 3 | 29805.67 | 620.1374 | 29346 | 30511 |
| Feb | 3 | 26839 | 692.078 | 26211 | 27581 |
| Mar | 3 | 24165 | 1832.831 | 22054 | 25351 |
| Apr | 3 | 22038.67 | 2210.639 | 19683 | 24068 |
| May | 3 | 23703 | 1598.634 | 22195 | 25379 |
| Jun | 3 | 24377 | 1290.582 | 23057 | 25636 |
| Jul | 3 | 24789.33 | 959.1461 | 23840 | 25758 |
| Aug | 3 | 27080.67 | 2755.784 | 24517 | 29995 |
| Sep | 3 | 28544.33 | 3789.526 | 24941 | 32496 |
| Oct | 3 | 27274 | 1776.811 | 25881 | 29275 |
| Nov | 3 | 27207 | 1277.23 | 26137 | 28621 |
| Dec | 3 | 27894 | 1427.238 | 26729 | 29486 |
| Total Monthly Estimation For All Three Years-Number Of Obs =3 For Each Month (3 Years) | |||||
| Month | Total | Std. Err. | [95% Conf. Interval] | ||
| Jan | 89417 | 1074.109 | 84795.48 - 94038.52 | ||
| Feb | 80517 | 1198.714 | 75359.35 - 85674.65 | ||
| Mar | 72495 | 3174.557 | 58835.98 - 86154.02 | ||
| Apr | 66116 | 3828.94 | 49641.4 - 82590.6 | ||
| May | 71109 | 2768.916 | 59195.32 - 83022.68 | ||
| Jun | 73131 | 2235.353 | 63513.05 - 82748.95 | ||
| Jul | 74368 | 1661.29 | 67220.05 - 81515.95 | ||
| Aug | 81242 | 4773.158 | 60704.76 - 101779.2 | ||
| Sep | 85633 | 6563.652 | 57391.89 - 113874.1 | ||
| Oct | 81822 | 3077.527 | 68580.47 - 95063.53 | ||
| Nov | 81621 | 2212.227 | 72102.56 - 91139.44 | ||
| Dec | 83682 | 2472.049 | 73045.63 - 94318.37 |
Table 4: Statistical analysis of cumulative monthly data of total Adolescents/Adults deaths due to Heart disease/Hypertension rel
Results
Meteorological Data Analysis Results
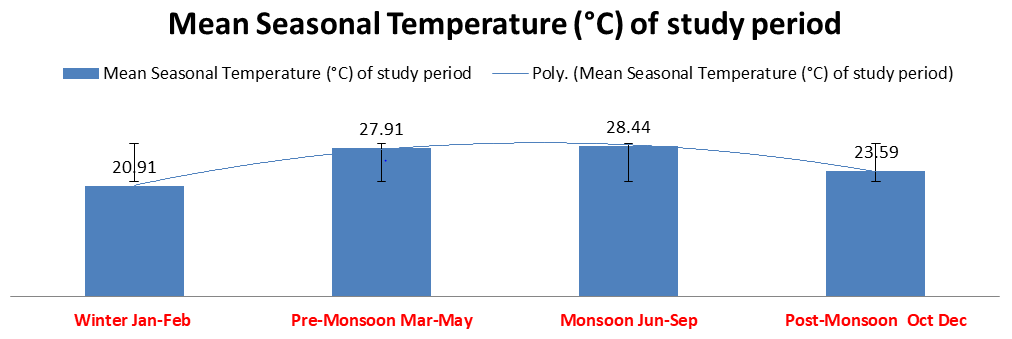
The mean temperature (degree Celsius) ± standard deviation recorded in Winter Season Jan-Feb (°C), were 20.91 ± .29, with 95% Conf. Interval 20.20 - 21.62, Std. Err. .16, Min 20.71, and Max 21.24; The mean temperature (degree Celsius) ± standard deviation recorded in Pre-Monsoon Season Mar-May(°C), were 27.91 ± .30,, with 95% Conf. Interval 27.17 - 28.66, Std. Err. .17, Min 27.58, and Max 28.16; The mean temperature (degree Celsius) ± standard deviation recorded in Monsoon Season Jun-Sep(°C), were 28.44 ± .16,, with 95% Conf. Interval 28.05 -28.84, Std. Err. .09, Min 28.28, and Max 28.6; The mean temperature (degree Celsius) ± standard deviation recorded in Post-Monsoon Season Oct-
Dec(°C) were 23.59 ± .14,, with 95% Conf. Interval 23.26 - 23.93, Std. Err. .08, Min 23.49 and Max 23.75 see Table-1 and Figure-1.
| 18-Jan | 29346 | 19-Jan | 30511 | 20-Jan | 29560 | Winter – Mean temp-20.91 |
|---|---|---|---|---|---|---|
| 18-Feb | 27581 | 19-Feb | 26725 | 20-Feb | 26211 | Total |
| Total | 56927 | 57236 | 55771 | 169934 | ||
| Mean | 28463.5 | 28618 | 27885.5 | 28322.33 | ||
| Max | 29346 | 30511 | 29560 | 29805.67 | ||
| Min | 27581 | 26725 | 26211 | 26839 | ||
| Obs | 2 | 2 | 2 | 6 | ||
| 18-Mar | 25351 | 19-Mar | 25090 | 20-Mar | 22054 | Pre-Monsoon - Mean temp- 27.91 |
| 18-Apr | 22365 | 19-Apr | 24068 | 20-Apr | 19683 | Total |
| 18-May | 23535 | 19-May | 25379 | 20-May | 22195 | |
| Total | 71251 | 74537 | 63932 | 209720 | ||
| Mean | 23750.33 | 24845.67 | 21310.67 | 23302.22 | ||
| Max | 25351 | 25379 | 22195 | 24308.33 | ||
| Min | 22365 | 24068 | 19683 | 22038.67 | ||
| Obs | 3 | 3 | 3 | 9 | ||
| 18-Jun | 24438 | 19-Jun | 25636 | 20-Jun | 23057 | Monsoon - Mean temp- 28.44 |
| 18-Jul | 23840 | 19-Jul | 24770 | 20-Jul | 25758 | |
| 18-Aug | 24517 | 19-Aug | 26730 | 20-Aug | 29995 | |
| 18-Sep | 24941 | 19-Sep | 28196 | 20-Sep | 32496 | |
| Total | 97736 | 105332 | 111306 | 314374 | ||
| Mean | 24434 | 26333 | 27826.5 | 26197.83 | ||
| Max | 24941 | 28196 | 32496 | 28544.33 | ||
| Min | 23840 | 24770 | 23057 | 23889 | ||
| Obs | 4 | 4 | 4 | 12 | ||
| 18-Oct | 25881 | 19-Oct | 26666 | 20-Oct | 29275 | Post-Monsoon - Mean temp- 23.59 |
| 18-Nov | 26863 | 19-Nov | 26137 | 20-Nov | 28621 | |
| 18-Dec | 27467 | 19-Dec | 26729 | 20-Dec | 29486 | |
| Total | 80211 | 79532 | 87382 | 247125 | ||
| Mean | 26737 | 26510.67 | 29127.33 | 27458.33 | ||
| Max | 27467 | 26729 | 29486 | 27894 | ||
| Min | 25881 | 26137 | 28621 | 26879.67 | ||
| Obs | 3 | 3 | 3 | 12 |
Table 5: Analysis of total Adolescent / Adult deaths due to Heart disease / Hypertension related in different Seasons.
Total Adolescent / Adult Deaths Due to Heart Disease / Hypertension Related In Different Months and Years Analysis Results
A total of 941153 eligible subject’s mortalities that died due to Heart disease / Hypertension related causes were analyzed during the 36 month observational study period. The analysis of monthly variations of eligible subject’s mortalities that died due to Heart disease / Hypertension are shown for different months of different years and combined all years in Table-2 and Figure5.
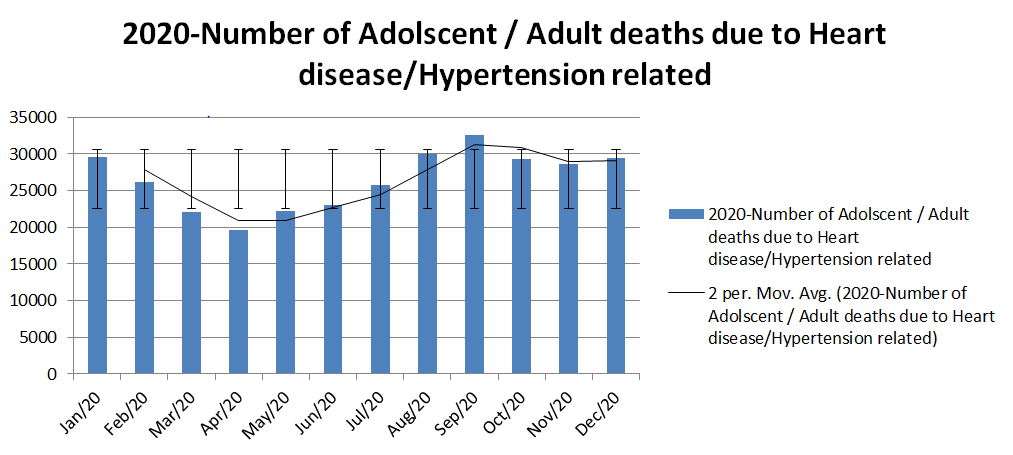
2020 – Monthly /Seasonally Analysis of Mortalities of Adolescent /Adult Deaths Due to Heart Disease / Hypertension
The total number of mortalities observed during 12 months of 2020 from Heart disease / Hypertension were 318391; Mean- 26532.58;Max / month – 32496; Min / month – 19683 and no. of Obs-12. Heart disease / Hypertension mortalities were highest in Sep-20(32496) followed by Aug- 20-(29995) and Jan-20(29560) while lowest mortalities were found in Apr-20 (19683). The mean seasonal mortality for Heart disease / Hypertension mortalities were highest in post monsoon (mean temperature 23.75°C) having mean mortality 29127.33followed by Winter Season Jan-Feb (mean temperature 20.79°C) with mean mortality 27885.5 , monsoon (mean temperature 28.45°C) with mean mortality 27826.5 and pre monsoon (mean temperature 27.58°C) having lowest mean mortality 21310.67See table-1, 2, and 4; figure-2. The change may be due to COVID-19 impact which is found to be having negative impact on Heart disease / Hypertension.
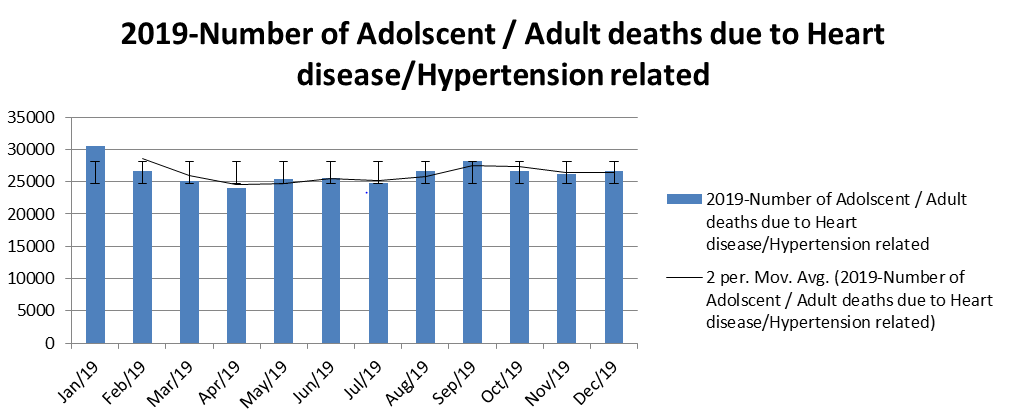
2019 – Monthly /Seasonally Analysis of Mortalities of Adolescent /Adult Deaths Due To Heart Disease / Hypertension
The total number of mortalities observed during 12 months of 2019 from Heart disease / Hypertension were
316637; Mean- 26386.42;Max / month – 30511; Min / month – 24068 and no. of Obs-12. Heart disease / Hypertension mortalities were highest in Jan-19(30511) followed by Sep- 19-(28196) and Aug-19(26730) while lowest mortalities were found in Apr-19 (24068). The mean seasonal mortality for Heart disease / Hypertension mortalities were highest in Winter Season Jan-Feb (mean temperature 20.71°C)
having mean mortality 28618 followed by post monsoon (mean temperature 23.49°C) with mean mortality 26510.67, monsoon (mean temperature 28.6°C) with mean mortality
26333 and pre monsoon (mean temperature 28°C) having lowest mean mortality 24845.67. See tables 1, 2, and 4; figure 3.
2018 – Monthly /Seasonally Analysis of Mortalities of Adolescent /Adult Deaths Due to Heart Disease / Hypertension
The total number of mortalities observed during 12 months of 2018 from Heart disease / Hypertension were 306125; Mean- 25510.42;Max / month – 29346; Min / month – 22365 and no. of Obs-12.Heart disease / Hypertension mortalities were highest in Jan-18(29346) followed by Feb-
18-(27581) and Dec-18(27467) while lowest mortalities were found in Apr-18 (22365). The mean seasonal mortality for Heart disease / Hypertension mortalities were highest in Winter Season Jan-Feb (mean temperature 21.24°C) having mean mortality 28463.5 followed by post monsoon (mean temperature 23.55°C) with mean mortality 26737, monsoon (mean temperature 28.28°C) with mean mortality 24434 and pre monsoon (mean temperature 28.16°C) having lowest mean mortality 23750.33 See tables 1, 2, and 4; figure 4.
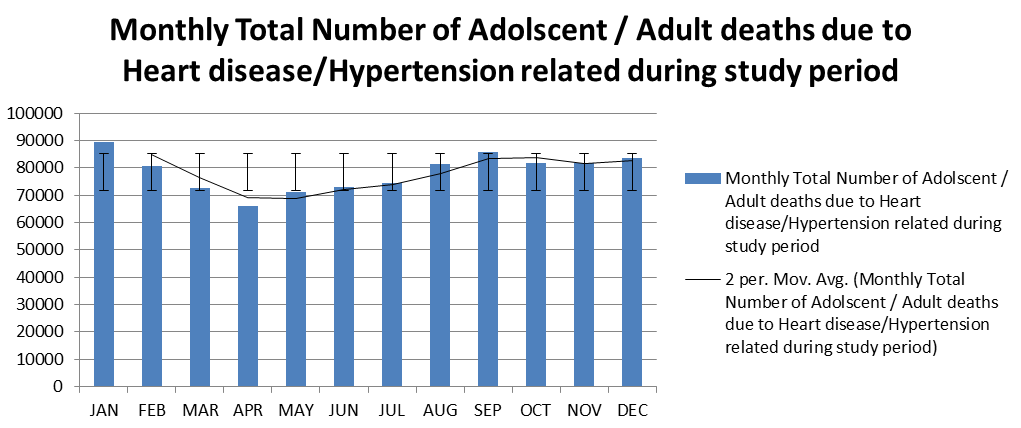
![Figure 4: Monthly mortalities of Adolescent /Adult deaths due to Heart disease / Hypertension. 2018-2019-2020-Combined –Analysis of Mortalities of Adolescent /Adult Deaths Due to Heart Disease / Hypertension Combined 2018-2019-2020 - Monthly / seasonally-The three years of study when combined together shows that the Heart disease / Hypertension mortalities were highest in January with 89417 mortalities ([95% CONF. INTERVAL] 84795.48 - 94038.52 ; STD. ERR.-1074.109; MEAN- 29805.67; STD. DEV.-620.1374; MIN-29346; MAX-30511 followed by September-85633 (95% CONF. INTERVAL- 57391.89 - 113874.1)and December-83682 (95% CONF. INTERVAL -73045.63 - 94318.37) while lowest mortalities were found in April – 66116 (95% CONF. INTERVAL- 49641.4 - 82590.6 ). The mean seasonal mortality for Heart disease / Hypertension mortalities were highest in Winter Season Jan-Feb (mean temperature 20.91°C) having mean mortality 28322.33 followed by post monsoon (mean temperature 23.59°C) with mean mortality 27458.33, monsoon (mean temperature 28.44°C) with mean mortality 26197.83 and pre monsoon (mean temperature 27.91°C) having lowest mean mortality 23302.22, See tables 1, 3, and 4; figures 5 and 6.](/fulltextimages/9583/fig_4.png)
Figure 4: Monthly mortalities of Adolescent /Adult deaths due to Heart disease / Hypertension. 2018-2019-2020-Combined –Analysis of Mortalities of Adolescent /Adult Deaths Due to Heart Disease / Hypertension Combined 2018-2019-2020 - Monthly / seasonally-The three years of study when combined together shows that the Heart disease / Hypertension mortalities were highest in January with 89417 mortalities ([95% CONF. INTERVAL] 84795.48 - 94038.52 ; STD. ERR.-1074.109; MEAN- 29805.67; STD. DEV.-620.1374; MIN-29346; MAX-30511 followed by September-85633 (95% CONF. INTERVAL- 57391.89 - 113874.1)and December-83682 (95% CONF. INTERVAL -73045.63 - 94318.37) while lowest mortalities were found in April – 66116 (95% CONF. INTERVAL- 49641.4 - 82590.6 ). The mean seasonal mortality for Heart disease / Hypertension mortalities were highest in Winter Season Jan-Feb (mean temperature 20.91°C) having mean mortality 28322.33 followed by post monsoon (mean temperature 23.59°C) with mean mortality 27458.33, monsoon (mean temperature 28.44°C) with mean mortality 26197.83 and pre monsoon (mean temperature 27.91°C) having lowest mean mortality 23302.22, See tables 1, 3, and 4; figures 5 and 6.
![Figure 6: Combined mean mortality of study period in different seasons. The total numbers of observations of mortality due to Heart disease / Hypertension were thirty six (36- one per month; 12 per year) and 12 for mean temperatures during different seasons, see tables 1, and 2. The total numbers of mortalities observed were 941153 (STD. ERR.-16325.48; [95% CONF. INTERVAL] 908010.5- 974295.5; Mean 26143.14; Std. Dev.-2720.914; Min 19683; Max 32496). The 95% confidence interval of total data mean was [95% Conf. Interval] 25222.51 - 27063.76 with standard error 453.4856.](/fulltextimages/9583/fig_6.png)
Figure 6: Combined mean mortality of study period in different seasons. The total numbers of observations of mortality due to Heart disease / Hypertension were thirty six (36- one per month; 12 per year) and 12 for mean temperatures during different seasons, see tables 1, and 2. The total numbers of mortalities observed were 941153 (STD. ERR.-16325.48; [95% CONF. INTERVAL] 908010.5- 974295.5; Mean 26143.14; Std. Dev.-2720.914; Min 19683; Max 32496). The 95% confidence interval of total data mean was [95% Conf. Interval] 25222.51 - 27063.76 with standard error 453.4856.
Discussion
This research study revealed that the mean mortality of adolescent/adult due to Heart disease / Hypertension were highest in January and increases significantly during the Jan- Feb winter season as compared to other seasons. At the same time, this study also found that mortality of adolescent/adult due to Heart disease / Hypertension were lowest in April continuously during all the three years of the study period and decreases significantly during March-May pre-monsoon season as compared to other seasons.
This temperature and seasonal variation in mortality of adolescents/adults due to Heart disease / Hypertension revealed by this research study will help epidemiologists who are researching mortality of adolescents/adults due to Heart disease / Hypertension as well as medical doctors, patients, policymakers, decision-makers, caregivers for better understanding and management of CVD / HTN according to temperature and seasons. Indirectly this study is also alerting the concerned people to be more careful during the seasons having negative impacts on the mortality i.e. seasons in which mortality is increased.
Strength and Limitations
There are no descriptive crosses sectional country- based epidemiological studies on the impact of season and temperature variations on the mortality trends of adolescents/adults due to Heart disease / Hypertension across 36 states and union territories of India on a cumulative basis from the accredited data source of HMIS. This novel research study investigated data from HMIS (secondary data). HMIS-MoHFW data is accredited worldwide as well as the biggest authentic database in India which is reliable specific, measurable, time-bound, and encompasses records of all deaths for research questions in the country. A thorough deep research study with primary data per month of climatic parameters such as temperature, wind speed, relative humidity, rainfall, frost, and sunshine, relation to title mentioned question is not possible by the researcher due to lack of funds and support from Government or any other agencies. Hence the researcher decided to do this study with available resources.
Conclusion
This novel research study revealed that in winter there is a notable increase in mortality from Heart disease / Hypertension among adolescents/adults in a large HMIS data sample collected through purposive sampling. The data analysis indicates that temperature and seasonal factors may have a significant role in the triggering of Heart disease / Hypertension and in predicting/determining their outcome. Hence a better understanding of the prospective role of seasonal risk factors and human body physiological adjustments responsible for these impacts may provide concerned persons like medical doctors, and researchers a novel avenues for undertaking research in the treatment/ prevention of CVD / HTN. The Government can issue season-specific guidelines to the patients and caregivers of Heart disease / Hypertension for a better outcome. There may be negative impacts on humans suffering from Heart disease / Hypertension and who are continuously living at low temperatures in air-conditioned rooms for long hours which is a matter of further research in the Indian settings. The researcher has also found that most of the intensive care units (ICU) treating the CVD/HTN patients have no guidelines about temperature control and usually the ICU units are chilled due to a lack of knowledge and misbelief that the cooler the better. Different Geographical locations may have different outcomes due to several factors like race, ethnicity, heredity, etc. on a global basis.
References
-
Miersch A, Vogel M, Gausche R, Siekmeyer W, Pfaffle R, et al. (2013) Influence of seasonal variation on blood pressure measurements in children, adolescents and young adults. Pediatr Nephrol 28: 2343-2349.
-
Abrignani MG, Lombardo A, Braschi A, Renda N, Abrignani V (2022) Climatic influences on cardiovascular diseases. World J Cardiol 14(3): 152-169.
-
Pell JP, Cobbe SM (1999) Seasonal variations in coronary heart disease, QJM: an International Journal of Medicine 92(12): 689-696.
-
Barnett AG, Sans S, Salomaa V, Kuulasmaa K, Dobson AJ, et al. (2007) The effect of temperature on systolic blood pressure. Blood pressure monitoring 12(3): 195-203.
-
Kumar P (2022) What Impacts Have Geographical Locations On The Cases And Deaths From Covid-19/ SarsCov-2 Pandemic In 36 States And Union Territories Of India:-Observational Analysis In India. J Mari Scie Res Ocean 5(1): 1-7.
-
Kumar P (2022) What Impacts have Geographical Locations on the Cases and Deaths from COVID-19/ SARS-CoV-2 Pandemic in 36 States and Union Territories of India:- Observational Analysis in India -V2. J Trop Dis 10: 1-310.
-
Goyal A, Aslam N, Kaur S, Soni RK, Midha V, et al. (2018) Factors affecting seasonal changes in blood pressure in North India: A population based four-season study. IHJ 70(3): 360-367.
-
Fares A (2013) Winter cardiovascular diseases phenomenon. N Am J Med Sci 5(4): 266-279.
-
Sinha P, Taneja DK, Singh NP, Saha R (2010) Seasonal variation in prevalence of hypertension: Implications for interpretation. Indian J Public Health 54: 7-10.
-
Ling SLV, Zhou CL, Jin DH, Ma WJ, Liu T, et al. (2022) Impact of ambient temperature on life loss per death from cardiovascular diseases: a multicenter study in central China. Environ Sci Pollut Res 29: 15791-15799.
-
Health management information system - Ministry of Health and Family Welfare – Government of India.
-
World Health Organization-Home/Newsroom/Fact sheets/Detail/Cardiovascular diseases (CVDs).
-
World Health Organization- Home/Newsroom/Fact sheets/Detail/Hypertension.
- Intersecting Epidemics and Climate Vulnerabilities in Conflict- Driven Displacement: Epidemiology, Systemic Challenges, and One Health Gaps in South Sudan
- Advancing Domestic Health Financing for Community Health System Sustainability in South Sudan: The Boma Health Initiative Model (2025–2035)
- Prevalence and Correlates of Post-Exposure Prophylaxis Uptake among Men Who Have Sex with Men in Kisumu County, Kenya
- Medical, Ethical, and Legal Conflicts Surrounding Euthanasia in Argentina. Its Global Implications
- Knowledge and Attitude on Menstrual Hygiene among Adolescent Girls Studying in Secondary Level in Public Schools of Chitwan District, Nepal
- Biological Efficacy of an Adulticide Mixture (clothianidin + deltamethrin) as an Indoor Residual Spray against Adult Anopheles flavirostris in Palawan, the Philippines