Survival Prediction Model for Esophageal Squamous Cell Carcinoma Patients with Lymph Node Metastasis who had Surgery: Based on SEER Database
Objective: To establish a nomogram model for predicting the overall survival (OS) of esophageal squamous cell carcinoma (ESCC) patients with lymph nodes metastasis (LNM) who had surgery. Methods: ESCC patients with LNM who received surgery from 2004 to 2015 in the Surveillance, Epidemiology, and Final Results (SEER) database were selected. The whole cohort (n=468) was randomly divided into training (n=328) and validation group(n=140). The Cox regression models were applied to identify the related prognostic factors for the nomogram. The performance of the nomogram was evaluated by Harrell’s concordance index (C-index), the area under the time-dependent receiver operating characteristics curve (AUC), the net reclassification improvement (NRI), integrated discrimination improvement (IDI), decision curve analysis (DCA), and calibration curve. Results: Surgery prime site, T status, M status, radiation sequence with surgery, age, race, and gender were incorporated in the nomogram. The better discrimination performance, more accurate prediction, and superior clinical usage of nomogram can be observed according to C-index, AUC, NRI, IDI, and DCA when compared to the traditional staging system in both cohorts. The excellent consistency was shown from calibration plots in 2 cohorts. Conclusion: The nomogram was developed and validated to predict OS for targeted ESCC patients.
Abbreviations
EC: Esophageal Cancer; ESCC: Esophageal Squamous Cell Carcinoma; LNM: Lymph Node Metastasis; AJCC: The American Joint Committee on Cancer; ROC: Receiver Operating Characteristic; AUC: Area under the Curve; NRI: Net Reclassification Index; IDI: Integrated Discrimination Improvement Index; DCA: Decision-Curve Analysis.
Introduction
Esophageal cancer (EC) ranked in 7th place for incidence (604,000 new cases) and was the sixth leading cause of death of cancer (544,000 deaths) in 2020 [1]. Esophageal squamous cell carcinoma (ESCC) is one common subtype of EC, accounting for about 90% of incident EC each year [2]. ESCC patients were often diagnosed at the advanced stage and had lymph node metastasis, which seriously affects the prognosis of patients [3, 4, 5]. The 5-year survival probability was 15%- 25% for patients with ESCC [6, 7]. The common characteristics of ESCC including extensive lymph node networks and specific anatomical location near the aortic arch which makes it hard to clear the lymph node metastasis of ESCC might lead to a poor prognosis [8, 9, 10]. Surgery remains the standard therapy, however, the prognosis of patients with ESCC who had lymph node metastasis (LNM) remains unfavorable even after surgery [4, 11, 12]. Therefore, it is necessary to search for prognostic evidence for ESCC patients with LNM after having surgery therapy.
The American Joint Committee on Cancer (AJCC) staging system served as the valuation criteria in the United States since 1959 and is the most common cancer-related prognosis assessment system. It defines the stage of cancer mainly based on anatomical information of the size of the primary tumor, regional lymph nodes, and distant metastases. However, they are not taking personal factors such as demographic factors (e.g., gender, age, and race) and clinical treatments into consideration in predicting cancer prognosis which was significant for the prognosis of cancer. That might explain the patients in the same cancer stage have different progress and survival times [10]. Therefore, a comprehensive prediction model should be developed for patients with cancers.
Recently, nomograms be applied to predict the prognosis status of cancer patients [13, 14]. As an integrated model it can combine demographical and clinical variables which drives the prediction model to be more comprehensive and personalized [15]. In the current study, the ESCC cohort in the SEER database was applied to search prognostic factors for patients with LNM who had surgery and then establish a predictive nomogram model for the targeted population.
Materials and Methods
Data Source
The data in the present study were from the SEER database (https://seer.cancer.gov), which collects cancer incidence data from US population-based cancer registries. The SEER registries collect data on patient demographics, pathological stage, treatments, follow-up time as well as vital status, etc. The specific dataset with radiotherapy and chemotherapy - “SEER 18 Regs Custom Data (with additional treatment fields), Nov 2018 Sub,” was entitled to use in the present study. As a public dataset with identified data, there was no need to access local ethics committee approval for applying the data.
Patient Selection
Patients diagnosed as EC were firstly selected in the SEER database, by using the SEER*Stat 8.35. Then, the data were sifted by the followed included criteria: [1] pathological diagnosis of ESCC according to positive histology: the Code of International Classification of Diseases, 3rd edition (ICD-O-3) defined as 8070-8075; [2] American Joint Committee on Cancer (AJCC) (7th Edition) N stage was N1-N4; [3] received surgery; [4] complete data of vital status and survival months.
The qualified data were randomly stratified into a training cohort and a validation cohort in the ratio of 7:3 by the R function “createDataPartition” to ensure that data were distributed without a bias between the two cohorts.
Variable Selection
The complete data were selected in the present study including demographic data which were age at diagnosis; race; gender; marital status, stage groups which were primary site; grade; summary; T stage; M stage, clinical treatments which were surgery status; radiotherapy status; chemotherapy status, and other clinical factors, as regional nodes examined, regional nodes positive, and number of malignant tumors. Stage groups were determined by the American Joint Committee on Cancer (AJCC) staging system. Data on duration of follow-up, vital status, and survival months were also extracted from the database to assess overall survival (OS) which represented the primary endpoints of the study. For the analysis of OS, the definition of vital status was as follow: till the end of follow-up time, death was considered as complete data (defined as “0”) and alive as censored data (defined as “1”) and the duration of survival time was in months.
Statistical Analysis
The class variables were described as frequencies and percentages. The student’s t-test was performed to compare continuous variables, and a chi-square test was used for categorical variables. Univariate and multivariate Cox regression analysis was performed to identify the factors related to prognosis. The significant variables of the univariate analysis were screened out to construct the multivariate Cox regression model. Integrated the variables from Cox multivariate regression analyses into the nomogram to predict 3- and 5-year OS probabilities.
Then the established model was validated by several indicators. The discrimination capability of the model was evaluated by the concordance index (C-index) and the receiver operating characteristic (ROC) curves with area under the curve (AUC) which ranged from 0.5 to 1.0. The nomogram would provide a reasonable estimation if the C-index and AUC were over 0.7. The net reclassification index (NRI) quantifies the ability of a new model to reclassify subjects as compared to an old model, while the integrated discrimination improvement index (IDI) can be used to assess the whole predicted improvement of the model. NRI and IDI were both employed to compare the discriminative usage between the present nomogram and the 7th AJCC staging system (The period of the dataset applied in the present study was till 2016 when the 8th AJCC staging system was not released. The present data was staged by the 7th system, so it was the suitable system to be compared to. Besides that, 7th and 8th AJCC staging existing similar power in predicting the disease prognosis for ESCC) [10]. The probability of accurate prediction for the new model is higher than the old model for prediction if NRI>0 or IDI>0. The clinical validity of the nomogram was evaluated by Decision-curve analysis (DCA) by quantifying the net benefit compared to the 7th AJCC staging system. Calibration plots were applied to assess the consistency between the observed probabilities and the predicted outcomes. All statistical data were analyzed by R version 4.1.1 (www.r-project.org), with a
2-sided significance level set at p <.05.
Results
Patient Characteristics
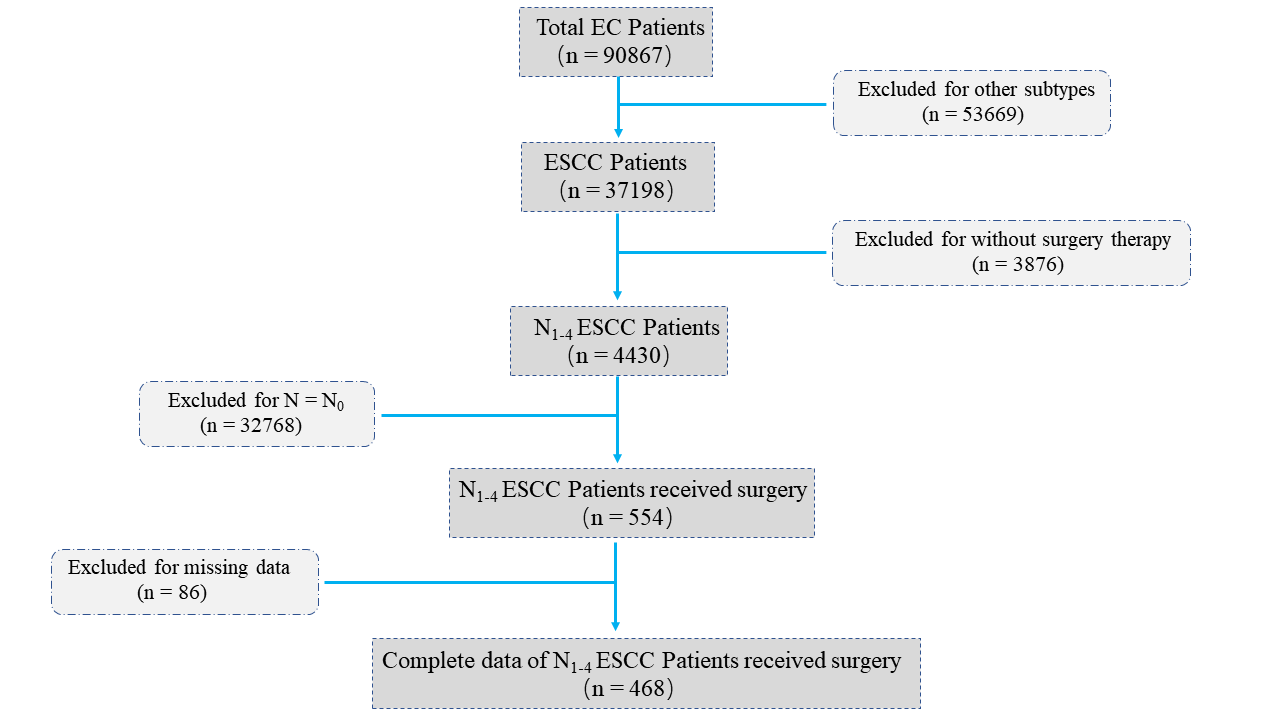
A total of 468 ESCC patients with LNM who had surgery from 2004 to 2015 were identified (Figure 1). The mean age of the targeted patients was 62.25±8.89 years. White (73.50%), male (58.97%), and married status (65.17%) were majority of patients. The most common Grade was Grade II (50.43%), the summary stage was regional (80.13%), the T stage was the T2 stage (59.19%), and the M stage the was M0 stage (89.74%). For clinical treatments, over half of the patients had radical resection (73.93%); 81.20% of patients received radiotherapy after surgery, while 93.80% had chemotherapy. The mean duration of follow-up was 29.72±6.10 months. The demographic and clinical characteristics of these patients are summarized in Table 1.
| Variable | Whole cohort [n = 468] | Training cohort [n = 328] | Validation cohort [n = 140] | P-value |
|---|---|---|---|---|
| Age, n (%) | 0.37 | |||
| 25-44 years | 10 (2.14%) | 6 (1.83%) | 4 (2.86%) | |
| 45-64 years | 266 (56.84%) | 183 (55.79%) | 83 (59.29%) | |
| 65-84 years | 171 (36.54%) | 121 (36.89%) | 50 (35.71%) | |
| ≥85years | 21 (4.49%) | 18 (5.49%) | 3 (2.14%) | |
| Follow-up time(months), mean±SD | 29.72±6.10 | 30.15±6.41 | 28.68±5.40 | 0.47 |
| Race, n (%) | 0.29 | |||
| White | 344 (73.50%) | 236 (71.95%) | 108 (77.14%) | |
| Black | 79 (16.88%) | 56 (17.07%) | 23 (16.43%) | |
| Others | 45 (9.62%) | 36 (10.98%) | 9 (6.43%) | |
| Gender, n (%) | 0.03 | |||
| Male | 276 (58.97%) | 204 (62.20%) | 72 (51.43%) | |
| Female | 192 (41.03%) | 124 (37.80%) | 68 (48.57%) | |
| Martial, n (%) | 0.49 | |||
| Married | 305 (65.17%) | 217 (66.16%) | 88 (62.86%) | |
| Not married | 163 (34.83%) | 111 (33.84%) | 52 (37.14%) | |
| Primary site, n (%) | 0.21 | |||
| C15.0-Cervical esophagus and C15.3- Upper third of esophagus | 40 (8.55%) | 24 (7.32%) | 16 (11.43%) | |
| C15.4-Middle third of esophagus | 213 (45.51%) | 156 (47.56%) | 57 (40.71%) | |
| C15.5-Lower third of esophagus | 215 (45.94%) | 148 (45.12%) | 67 (47.86%) | |
| Grade, n (%) | 0.09 | |||
| Well differentiated; Grade I | 27 (5.77%) | 21 (6.40%) | 6 (4.29%) | |
| Moderately differentiated; Grade II | 236 (50.43%) | 153 (46.65%) | 83 (59.29%) | |
| Poorly differentiated; Grade III | 199 (42.52%) | 149 (45.43%) | 50 (35.71%) | |
| Undifferentiated; anaplastic; Grade IV | 6 (1.28%) | 5 (1.52%) | 1 (0.71%) | |
| Sumarry, n (%) | 0.65 | |||
| Localized | 2 (0.43%) | 2 (0.61%) | 0 (0.00%) | |
| Regional | 375 (80.13%) | 262 (79.88%) | 113 (80.71%) | |
| Distant | 91 (19.44%) | 64 (19.51%) | 27 (19.29%) | |
| T Stage, n (%) | 0.31 | |||
| T1 | 55 (11.75%) | 36 (10.98%) | 19 (13.57%) | |
| T2 | 78 (16.67%) | 49 (14.94%) | 29 (20.71%) | |
| T3 | 277 (59.19%) | 200 (60.98%) | 77 (55.00%) | |
| T4 | 58 (12.39%) | 43 (13.11%) | 15 (10.71%) | |
| M Stage, n (%) | 0.59 | |||
| M0 | 420 (89.74%) | 296 (90.24%) | 124 (88.57%) | |
| M1 | 48 (10.26%) | 32 (9.76%) | 16 (11.43%) | |
| Regional nodes examined, n (%) | ||||
| 0 | 47(10.04%) | 29(8.84%) | 18(12.86%) | 0.19 |
| 20-Jan | 309(66.03%) | 229(69.82%) | 80(57.14%) | |
| 21-40 | 80(17.09%) | 50(15.24%) | 30(21.43%) | |
| 41-60 | 11(2.35%) | 7(2.13%) | 4(2.86%) | |
| ≥61 | 21(4.48%) | 13(3.96%) | 8(5.71%) | |
| Regional nodes positive, n (%) | 0.76 | |||
| 0 | 201(42.95%) | 143(43.60%) | 58(41.43%) | |
| 9-Jan | 204(43.59%) | 139(42.38%) | 65(46.42%) | |
| ≥10 | 63(13.46%) | 46(14.02%) | 17(12.14%) | |
| Number of malignant tumors, n (%) | ||||
| 1 | 363(77.56%) | 254(77.44%) | 109(77.85%) | 0.88 |
| 2 | 73(15.60%) | 50(15.24%) | 23(16.43%) | |
| 3 | 27(5.77%) | 20(6.10%) | 7(5.00%) | |
| 4 | 3(0.64%) | 2(0.61%) | 1(0.71%) | |
| 5 | 2(0.43%) | 2(0.61%) | 0(0.00%) | |
| Surgery prime site, n (%) | 0.17 | |||
| S1 | 4 (0.86%) | 1 (0.31%) | 3 (2.14%) | |
| S2 | 17 (3.63%) | 9 (2.74%) | 8 (5.71%) | |
| S3 | 54 (11.54%) | 40 (12.19%) | 14 (10.00%) | |
| S4 | 47 (10.04%) | 31 (9.45%) | 16 (11.43%) | |
| S5 | 346 (73.93%) | 247 (75.31%) | 99 (70.71%) | |
| Radiation sequence with surgery, n (%) | 0.34 | |||
| Before surgery | 88 (18.80%) | 58 (17.68%) | 30 (21.43%) | |
| After surgery | 380 (81.20%) | 270 (82.32%) | 110 (78.57%) | |
| Radiation recode | 0.25 | |||
| Beam radiation | 456(97.44%) | 317(96.65%) | 139(99.29%) | |
| Radiation, NOS | 11(2.35%) | 10(3.04%) | 1(0.71%) | |
| Radioisotopes | 1(0.21%) | 1(0.31%) | 0(0.00%) | |
| Chemotherapy, n (%) | 0.12 | |||
| Yes | 439 (93.80%) | 304 (92.68%) | 135 (96.43%) | |
| No/Unknown | 29 (6.20%) | 24 (7.32%) | 5 (3.57%) |
Surg Prime Site S1=Local tumor destruction; S2=Local tumor excision; S3=Less than total resection; S4=Total resection; S5=Radical resection Regional nodes examined: 95-98= Regional lymph node was removed, but the number of nodes is unknown/not stated Regional nodes positive: 95-97= Positive nodes are documented, but number is unspecified; 98= No nodes were examined. Table1: Demographic and clinical characteristics of ESCC patients with LNM who had surgery.
Identifying Variables for the Nomogram
16 variables were analyzed by the Cox univariate regression analysis (Table 2). Ten of them were integrated into the Cox multivariate analysis and 7 factors served as independent prognostic factors associated with OS (p < 0.05) $$
\begin{array}{l l l l l l l} \text {=} & \text {U nivariate analysis} & \text {p - value} & \text {Multivariate analysis} & \text {p - value} \\ & \mathrm {H R} & 95 \% \mathrm {C I} & \mathrm {H R} & 95 \% \mathrm {C I} \\ \mathrm {A g e} & & & & & \\ 2 5 - 4 4 \mathrm {years} & 1 & - & - & 1 & - \\ 4 5 - 6 4 \mathrm {years} & 0. 6 6 9 & 0. 2 1 0 - 2. 1 3 2 & 0. 4 9 6 &
16 variables were analyzed by the Cox univariate regression analysis (Table 2). Ten of them were integrated into the Cox multivariate analysis and 7 factors served as independent prognostic factors associated with OS (p < 0.05) $$ \begin{array}{l l l l l l l} \text {=} & \text {U nivariate analysis} & \text {p - value} & \text {Multivariate analysis} & \text {p - value} \\ & \mathrm {H R} & 95 \% \mathrm {C I} & \mathrm {H R} & 95 \% \mathrm {C I} \\ \mathrm {A g e} & & & & & \\ 2 5 - 4 4 \mathrm {years} & 1 & - & - & 1 & - \\ 4 5 - 6 4 \mathrm {years} & 0. 6 6 9 & 0. 2 1 0 - 2. 1 3 2 & 0. 4 9 6 & 1. 0 9 8 & 0. 3 1 7 - 3. 8 0 1 \\ 6 5 - 8 4 \mathrm {years} & 0. 9 6 8 & 0. 3 0 2 - 3. 1 0 3 & 0. 9 5 7 & 1. 7 7 3 & 0. 5 0 2 - 6. 2 5 6 \\ \geq 8 5 \mathrm {years} & 1. 4 9 9 & 1. 1 1 5 - 2. 0 6 4 & 0. 0 4 5 & 2. 0 1 8 & 1. 6 0 3 - 2. 7 0 2 \\ \mathrm {R a c e} & & & & & \\ \end{array} $$
American Indian/Asian/Pacific Islander
1 - - 1 - - Black 0.924 0.490-1.742 0.808 0.589 0.287-1.208 0.148 White 0.646 0.392-0.906 0.046 0.455 0.256-0.806 0.007 Gender Female 1 - - 1 - - (Table 2). These factors were surgery prime site, T status, M status, radiation sequence with surgery, age, race, and gender. The Cox multivariate analysis indicated that ≥85 years, male, local tumor destruction, and radiation after surgery were related to the deterioration of OS. For white, the T2 stage, and M0 stage acted as the protective factor for OS.
| Male | 1.443 | 1.075-2.077 | 0.013 | 1.645 | 1.152-2.348 | 0.006 |
|---|---|---|---|---|---|---|
| Martial status | ||||||
| Married | 1 | - | - | - | - | |
| Not married | 1.399 | 0.754-2.917 | 0.413 | - | - | - |
| Primarysite | ||||||
| C15.0-Cervical esophagus/ C15.3-Upper third of esophagus | 1 | - | - | 1 | - | - |
| PrimarySiteC15.4-Middle third of esophagus | 1.868 | 1.265-2.717 | 0.037 | 1.42 | 0.879-1.184 | 0.102 |
| PrimarySiteC15.5-Lower third of esophagus | 0.896 | 0.474-1.694 | 0.735 | 0.567 | 0.242-1.324 | 0.19 |
| Grade | ||||||
| Moderately differentiated; Grade II | 1 | - | - | - | - | - |
| Poorly differentiated; Grade III | 0.857 | 0.611-1.201 | 0.37 | - | - | - |
| Undifferentiated; anaplastic; Grade IV | 1.123 | 0.275-4.593 | 0.871 | - | - | - |
| Well differentiated; Grade I | 1.24 | 0.675-2.279 | 0.489 | - | - | - |
| Summary | ||||||
| Distant | 1 | - | - | - | - | - |
| Localized | 0 | 0.000-Inf | 0.996 | - | - | - |
| Regional | 1.66 | 0.813-2.720 | 0.344 | - | - | - |
| T Stage | ||||||
| T1 | 1 | - | - | 1 | - | - |
| T2 | 0.911 | 0.525-1.582 | 0.741 | 0.835 | 0.467-1.493 | 0.543 |
| T3 | 1.08 | 0.665-1.754 | 0.755 | 1.093 | 0.655-1.821 | 0.734 |
| T4 | 0.341 | 0.116-1.000 | 0.05 | 0.293 | 0.095-0.904 | 0.033 |
| M Stage | ||||||
| M0 | 1 | - | - | 1 | - | - |
| M1 | 0.32 | 0.149-0.686 | 0.003 | 0.279 | 0.125-0.619 | 0.002 |
| Regional nodes examined | ||||||
| 0 | 1 | - | - | - | - | - |
| 20-Jan | 0.839 | 0.500-1.409 | 0.507 | - | - | - |
| 21-40 | 0.811 | 0.447-1.474 | 0.493 | - | - | - |
| 41-60 | 1.289 | 0.169-9.795 | 0.806 | - | - | - |
| ≥61 | 0.987 | 0.472-1.529 | 0.516 | - | - | - |
| Regional nodes positive | ||||||
| 0 | 1 | - | - | - | - | - |
| 9-Jan | 0.563 | 0.390-0.813 | 0.913 | - | - | |
| ≥10 | 1.013 | 0.243-1.656 | 0.391 | - | - | - |
| Number of malignant tumors | ||||||
| 1 | 1 | - | - | - | - | - |
| 2 | 0.11 | 0.738-1.665 | 0.002 | 0.676 | 0.451-1.114 | 0.061 |
| 3 | 0.893 | 0.000-inf | 0.995 | 0 | 0.000-Inf | 0.994 |
| 4 | 0.603 | 0.614-4.587 | 0.313 | 1.628 | 0.578-4.584 | 0.356 |
| 5 | 0 | 0.364-1.344 | 0.283 | 0.606 | 0.278-1.317 | 0.206 |
| Surgery prime site | ||||||
| S5 | 1 | - | - | 1 | - | - |
| S1 | 4.959 | 0.587-41.918 | 0.142 | 10.88 | 1.117-10.607 | 0.04 |
| S2 | 0.844 | 0.101-7.047 | 0.876 | 1.693 | 0.177-16.170 | 0.648 |
| S3 | 2.639 | 1.053-6.613 | 0.038 | 2.094 | 0.808-5.425 | 0.128 |
| S4 | 2.075 | 0.831-5.179 | 0.118 | 1.992 | 0.779-5.095 | 0.15 |
| Radiation sequence with surgery | ||||||
| Before surgery | 1 | - | - | 1 | - | - |
| After surgery | 2.251 | 1.217-4.166 | 0.01 | 3.346 | 1.608-6.963 | 0.001 |
| Radiationcode | ||||||
| Beam radiation | 1 | - | - | - | - | - |
| Radiation, NOS method or source not specified | 0.715 | 0.228-2.248 | 0.566 | - | - | - |
| Radioisotopes (1988+) | 0 | 0.000-Inf | 0.995 | - | - | - |
| Chemotherapy | ||||||
| No/Unknown | 1 | - | - | - | - | - |
| Yes | 2.706 | 0.377-19.400 | 0.322 | - | - | - |
Table 2: Univariate and multivariate Cox analyses for screening factors related to overall survival of ESCC patients with LNM
Surg Prime Site: S1=Local tumor destruction; S2=Local tumor excision; S3=Less than total resection; S4=Total resection; S5=Radical resection Regional nodes examined: 95-98= Regional lymph node was removed, but the number of nodes is unknown/not stated Regional nodes positive: 95-97= Positive nodes are documented, but number is unspecified; 98= No nodes were examine. Table 2: Univariate and multivariate Cox analyses for screening factors related to overall survival of ESCC patients with LNM who had surgery.
Establishment of the Nomogram
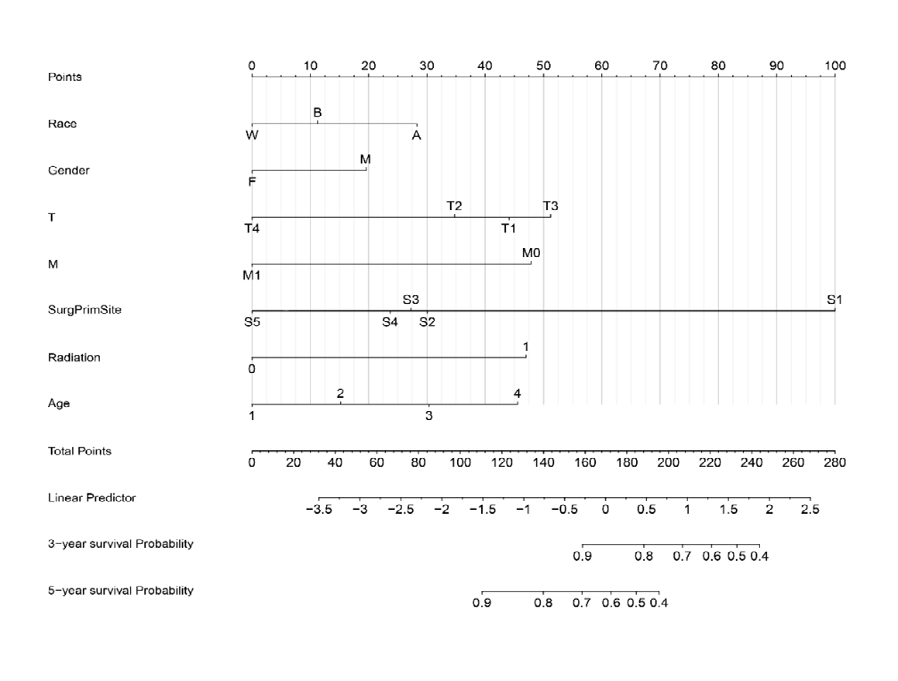
The nomogram for predicting 3 and 5-year OS was established by incorporating the seven factors from Cox multivariate analysis. Among these factors, the surgery prime site was the most contributed factor for forecasting OS probability, then the T stage, M stage, and radiation sequence with surgery (Figure 2).
Validation of the Nomogram
C-index and ROC-related AUC were employed to evaluate the discrimination ability of the nomogram. The C‐index was 0.709 (95% CI = 0.661‐0.760) in the training cohort and 0.775 (95% CI = 0.708‐0.860) in the validation cohort. Both figures were significantly higher than those of the 7th AJCC stage (p < 0.001), which achieved a score of 0.607 (95% CI = 0.544- 0.670) and 0.683 (95% CI = 0.597-0.769), respectively (Table 3). The AUCs > 0.7 for the prediction of 3- and 5- year OS in both the training (0.712 and 0.716) and validation cohorts (0.725 vs. 0.857), indicating favorable discrimination usage by the nomogram compared to that of the 7th AJCC staging system (Figure 3).
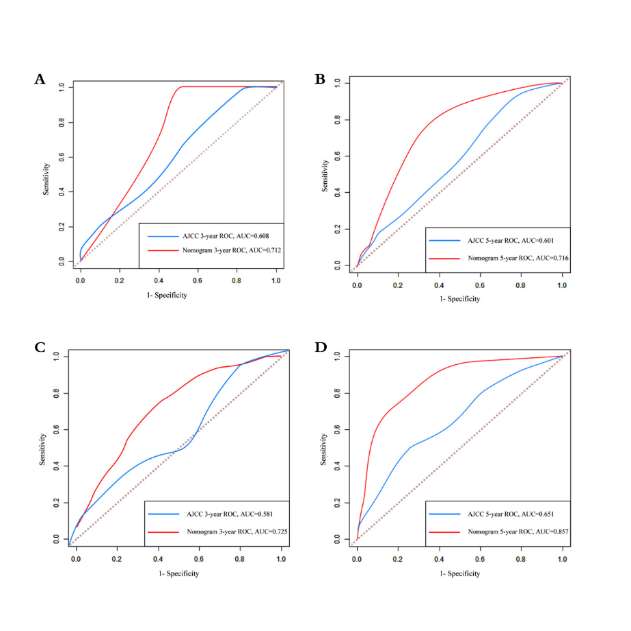
Figure 3: ROC Curves of the nomogram and 7th AJCC staging system to predict 3-year and 5-year OS for ESCC patients with LNM who had surgery in the training cohort (A-B) and the validation cohort (C-D). The red curve was for the nomogram and the blue one was for the AJCC staging system. The larger the AUC, the better discrimination of the model would be.
NRI and IDI were applied to evaluate the accuracy of the nomogram, the NRI for the 3‐ and 5‐year OS probabilities were 0.307 (95% CI: 0.054-0.560) and 0.291 (95% CI: 0.078- 0.526) in the training group, and the IDI for 3‐ and 5‐year OS probabilities were 0.079 (95% CI: 0.017-0.222) and 0.129 (95% CI: 0.046-0.242) (Table 3). These results were validated in the validation cohort (Table 3). These results indicated that the nomogram predicted 3‐ and 5‐year prognosis with superior accuracy than the 7th AJCC staging system.
| Index | Training cohort | P-value | Validation cohort | P-value | ||
|---|---|---|---|---|---|---|
| Estimate | 95%CI | Estimate | 95%CI | |||
| NRI versus AJCC system | ||||||
| For 3-year OS | 0.307 | 0.054-0.560 | 0.013 | 0.297 | 0.040-0.575 | 0.027 |
| For 5-year OS | 0.291 | 0.078-0.526 | 0.007 | 0.545 | 0.228-0.785 | 0.007 |
| IDI versus AJCC system | ||||||
| For 3-year OS | 0.079 | 0.017-0.222 | 0.02 | 0.167 | 0.036-0.342 | 0.02 |
| For 5-year OS | 0.129 | 0.046-0.242 | 0.007 | 0.328 | 0.150-0.439 | <0.001 |
| C-index | ||||||
| Nomogram | 0.709 | 0.661-0.760 | <0.001 | 0.775 | 0.708-0.860 | <0.001 |
| AJCC system | 0.607 | 0.544-0.670 | 0.683 | 0.597-0.769 | <0.001 |
Table 3: The validation of the nomogram versus the 7th AJCC staging system by NRI, IDI, and C-index.
DCA was performed to compare the clinical usage of the nomogram to the 7th AJCC staging system. In both the training cohort and the validation cohort, compared to the
7th AJCC stage system the nomogram added more net clinical benefits, as shown in Supplementary Figure 4.
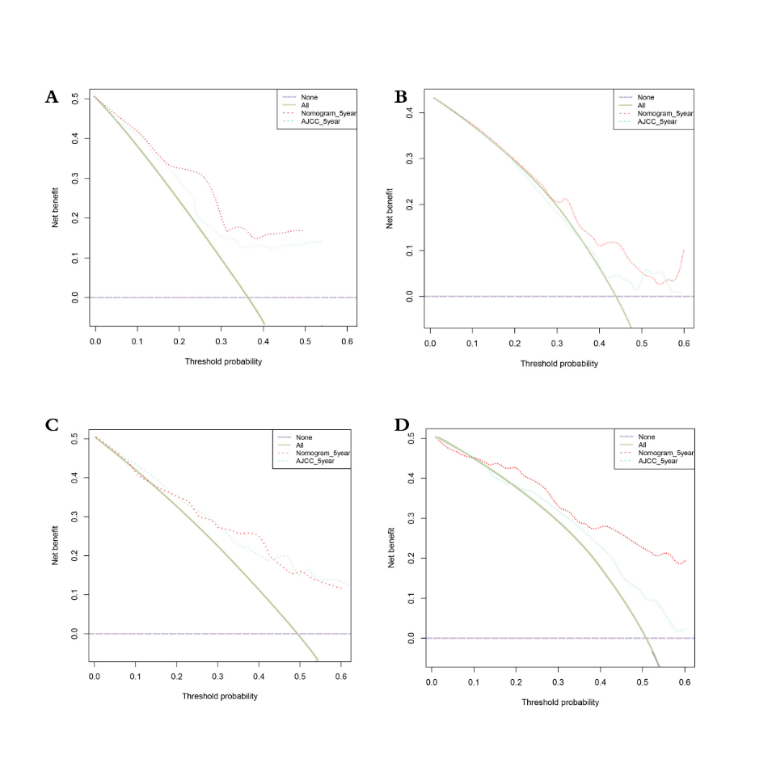
The red dashed lines represent the DCA of the nomogram, and the mint green dashed lines represent the AJCC staging system. The green solid line assumes that all patients were alive, while the purple dashed line assumes that all patients were deceased.
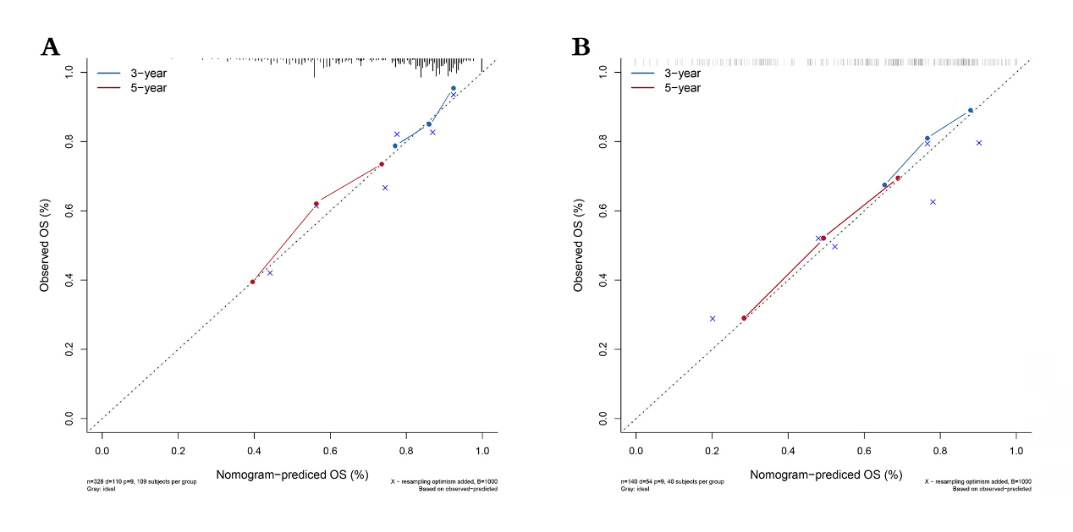
Calibration plots of the nomogram indicated that the uniformity was favorable between the predicted and observed survival probability for 3-year and 5-year in the training and validation cohorts (Figure 5).
Discussion
To evaluate the prognosis for ESCC patients with positive lymph nodes who had surgery, a nomogram that integrates various variables to predict the related factors to 3- and 5-year OS for the targeted ESCC patients was constructed. The validation of the nomogram indicated that it owned favorable discrimination, accuracy, clinical usage, and calibration. The most contributed factor in the model for predicting OS probability was the surgery prime site. Patients who received radical resection had better performance in the prognosis than other surgery treatments. It might dissect tumor tissue, regional lymph nodes, and metastatic lymph nodes more thoroughly making surgical procedure outcomes favorable [16]. Radiation as adjuvant therapy plays an essential role in treating ESCC patients. In this study, radiation sequence with surgery was determined as an independent prognostic factor and entered the nomogram model. T stage and M stage were integrated into the nomogram model as well. The patients in the T4 stage who had surgery showed a worse prognosis than T1-3 who had surgery. It is similar to the results of the study by TY Kam, et al. [17]. For the patients in early stage who received adjuvant therapy and surgery, leading to satisfaction survival outcomes. Based on this result, the early T-stage patients would have favorable survival outcomes if they received reasonable clinical treatments. In terms of M status, the study of Kuang TK, et al. [18] showed that metastasis patients had a worse prognosis than the ones not metastasis, patients in the present study had a similar prognosis to the former study. Even though the patients with lymph nodes metastasis had unfavorable survival time, some studies concluded that survival benefits would be given to specific subgroups such as patients with positive lymph nodes when they received suitable adjuvant therapy [19]. The prognostic related demographic variables, including age, race, and gender were entered into the nomogram model. Race as a prognosis factor was analyzed in several studies Lu T, et al. [20, 21, 22, 23], similar to these studies Zhu C, et al. [24, 25, 26], the white patients with LNM who had surgery alongside radiation might have better prognosis than black and American Indian/ Asian/Pacific Islander people in the present study. For the age group, the older, the worse their prognosis would be, which was identical to the previous studies [27, 28, 29]. Identical to Guan X, et al. [30], and Lu T, et al. [31], gender was identified as the independent prognostic factor for the prediction which might be related to that male as the known risk factor for ESCC patients around the world [32, 33, 34].
Although the nomogram did perform well, it had several limitations. The data from SEER was based on the American population, which may not fit the people of other countries. Besides that, external validation was not constructed in the present study. The ESCC patients from Chifeng municipal hospital and Chifeng oncology hospital, China, were collecting to evaluate the external utility of this nomogram and served as the complement to the present study.
Conclusion
Seven variables: surgery prime site, T status, M status, radiation sequence with surgery, age, race, and gender were integrated into the present nomogram. The surgery prime site served as the most significant predictive variable among these OS-related factors, followed by the T status, M status and radiation sequence with surgery. The present nomogram with its advantage in predicting 3-year and 5-year OS compare to the traditional system. It might be used to predict survival time for ESCC patients with LNM who had surgery.
Funding
There was no funding from the public, commercial, or not-for-profit sectors for the present study.
Acknowledgments
The authors would like to express our gratitude to Haibo Yu for making the language more fluent and Haili Jin for assistance with data analysis and comments that improved the manuscript substantially.
References
-
Sung H, Ferlay J, Siegel RL, Laversanne M, Soerjomataram I, t al. (2021) Global Cancer Statistics 2020: GLOBOCAN Estimates of Incidence and Mortality Worldwide for 36 Cancers in 185 Countries. CA cancer journal for clinicians 71(3): 209-249.
-
Abnet CC, Arnold M, Wei WQ (2018) Epidemiology of Esophageal Squamous Cell Carcinoma. Gastroenterology 154(2): 360-373.
-
Chu LY, Peng YH, Weng XF, Xie JJ, Xu YW (2020) Blood-based biomarkers for early detection of esophageal squamous cell carcinoma. World journal of gastroenterology 26(15): 1708-1725.
-
Zhang W, Wang P, Pang Q (2020) Immune checkpoint inhibitors for esophageal squamous cell carcinoma: a narrative review. Annals of translational medicine 8(18): 1193.
-
Song Y, Li L, Ou Y, Gao Z, Li E, et al. (2014) Identification of genomic alterations in oesophageal squamous cell cancer. Nature 509(7498): 91-95.
-
Baba Y, Nomoto D, Okadome K, Ishimoto T, Iwatsuki M, et al. (2020) Tumor immune microenvironment and immune checkpoint inhibitors in esophageal squamous cell carcinoma. Cancer science 111(9): 3132-3141.
-
Ohashi S, Miyamoto S, Kikuchi O, Goto T, Amanuma Y, et al. (2015) Recent Advances from Basic and Clinical Studies of Esophageal Squamous Cell Carcinoma. Gastroenterology 149(7): 1700-1715.
-
Lin DC, Hao JJ, Nagata Y, Xu L, Li S, et al. (2014) Genomic and molecular characterization of esophageal squamous cell carcinoma. Nature genetics 46(5): 467-473.
-
Wu SG, Sun JY, Yang LC, Zhou J, Li FY, et al (2015) Prognosis of patients with esophageal squamous cell carcinoma after esophagectomy using the log odds of positive lymph nodes. Oncotarget 6(34): 36911-36922.
-
Zhang Y, Hong YK, Zhuang DW, He XJ, Lin ME (2019) Bladder cancer survival nomogram: Development and validation of a prediction tool, using the SEER and TCGA databases. Medicine 98(44): e17725.
-
Saeki H, Sohda M, Sakai M, Sano A, Shirabe K (2020) Role of surgery in multidisciplinary treatment strategies for locally advanced esophageal squamous cell carcinoma. Annals of gastroenterological surgery 4(5): 490-497.
-
Naoya O, Fujii S, Takeo F, Jun K, Takashi K, et al. (2016) The prognostic significance of the positive circumferential resection margin in pathologic T3 squamous cell carcinoma of the esophagus with or without neoadjuvant chemotherapy. Surgery 159(2): 441-450.
-
Iasonos A, Schrag D, Raj GV, Panageas KS (2008) How to build and interpret a nomogram for cancer prognosis. J Clin Oncol 26(8): 1364-1370.
-
Cantinotti M, Kutty S, Franchi E, Paterni M, Scalese M, et al. (2017) Pediatric echocardiographic nomograms: What has been done and what still needs to be done. Trends in cardiovascular medicine 27(5): 336-349.
-
Morlacco A, Modonutti D, Motterle G, Martino F, Moro F, et al. (2021) Nomograms in Urologic Oncology: Lights and Shadows. J clin med 10(5): 980.
-
Igaki H, Tachimori Y, Kato H (2004) Improved survival for patients with upper and/or middle mediastinal lymph node metastasis of squamous cell carcinoma of the lower thoracic esophagus treated with 3-field dissection. Ann Surg 239(4): 483-490.
-
Kam TY, Kountouri M, Roth A, Frossard JL, Huber O, et al. (2018) Endoscopic resection with adjuvant chemo- radiotherapy for superficial esophageal squamous cell carcinoma: A critical review. Crit Rev Oncol Hematol 124: 61-65.
-
Kuo KT, Chou TY, Hsu HS, Chen WL, Wang LS (2012) Prognostic significance of NBS1 and Snail expression in esophageal squamous cell carcinoma. Ann Surg Oncol 19(3): 549-557.
-
Malthaner RA, Wong RK, Rumble RB, Zuraw L (2004) Neoadjuvant or adjuvant therapy for resectable esophageal cancer: a systematic review and meta- analysis. BMC med 2: 35.
-
Lu T, Xu R, Li Q, Peng B, Zhang H, et al. (2021) Systematic profiling of ferroptosis gene signatures predicts prognostic factors in esophageal squamous cell carcinoma. Mol Ther Oncolytics 21: 134-143.
-
Wang CY, Yang J, Zi H, Zheng ZL, Li BH, et al. (2020) Nomogram for predicting the survival of gastric adenocarcinoma patients who receive surgery and chemotherapy. BMC cancer 20(1): 10.
-
Li C, Yang J, Zheng S, Xu F, Han D, et al. (2020) Establishment and Validation of a Nomogram for Tonsil Squamous Cell Carcinoma: A Retrospective Study Based on the SEER Database. Cancer control 27(1): 1073274820960481.
-
Li C, Yang J, Xu F, Han D, Zheng S, et al. (2020) A prognostic nomogram for the cancer-specific survival of patients with upper-tract urothelial carcinoma based on the Surveillance, Epidemiology, and End Results Database. BMC cancer 20(1): 534.
-
Zhu C, You Y, Liu S, Ji Y, Yu J (2020) A Nomogram to Predict Distant Metastasis for Patients with Esophageal Cancer. Oncology research and treatment 43(1-2): 2-9.
-
Zhang J, Pan Z, Yang J, Yan X, Li Y, et al. (2019) A nomogram for determining the disease-specific survival in Ewing sarcoma: a population study. BMC cancer 19: 667.
-
Chung CS, Lee YC, Wu MS (2015) Prevention strategies for esophageal cancer: Perspectives of the East vs. West. Best practice research Clinical gastroenterology 29(6): 869-883.
-
Shang QX, Yang YS, Xu LY, Yang H, Li Y, et al. (2021) Prognostic impact of lymph node harvest for patients with node-negative esophageal squamous cell carcinoma: a large-scale multicenter study. Journal of gastrointestinal oncology 12(5): 1951-1962.
-
Song J, Liu Y, Guan X, Zhang X, Yu W, et al. (2021) A Novel Ferroptosis-Related Biomarker Signature to Predict Overall Survival of Esophageal Squamous Cell Carcinoma. Frontiers in molecular biosciences 8: 675193.
-
Li W, Liu J, Zhao H (2020) Identification of a nomogram based on long non-coding RNA to improve prognosis prediction of esophageal squamous cell carcinoma. Aging 12(2): 1512-1526.
-
Guan X, Liu C, Zhou T, Ma Z, Zhang C, et al. (2020) Survival and prognostic factors of patients with esophageal fistula in advanced esophageal squamous cell carcinoma. Biosci Rep 40(1): BSR20193379.
-
Hu N, Wang K, Zhang L, Liu ZJ, Jin Z, et al. (2021) Epidemiological and clinical features of functional dyspepsia in a region with a high incidence of esophageal cancer in China. Chin Med J 134(12): 1422-1430.
-
Abbaszadegan MR, Taghehchian N, Aarabi A, Akbari F, Saburi E, et al. (2021) MAEL as a diagnostic marker for the early detection of esophageal squamous cell carcinoma. Diagn Pathol 16(1): 36.
-
Abnet CC, Arnold M, Wei W-Q (2018) Epidemiology of Esophageal Squamous Cell Carcinoma. Gastroenterology 154(2): 360-373.
- Measuring What Matters: Data Gaps, Certificate of Need Reform, and Pediatric Psychiatric Inpatient Capacity in North Carolina
- Intersecting Epidemics and Climate Vulnerabilities in Conflict- Driven Displacement: Epidemiology, Systemic Challenges, and One Health Gaps in South Sudan
- Advancing Domestic Health Financing for Community Health System Sustainability in South Sudan: The Boma Health Initiative Model (2025–2035)
- Prevalence and Correlates of Post-Exposure Prophylaxis Uptake among Men Who Have Sex with Men in Kisumu County, Kenya
- Medical, Ethical, and Legal Conflicts Surrounding Euthanasia in Argentina. Its Global Implications
- Knowledge and Attitude on Menstrual Hygiene among Adolescent Girls Studying in Secondary Level in Public Schools of Chitwan District, Nepal