A comparative Study to Assess Behaviour Pattern of Single Child and Child with Siblings between the Age Group of 6-12 Years in Nadiad City, Gujarat
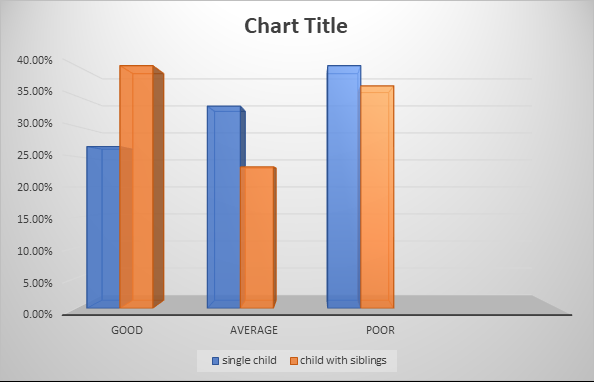
Context: The comparison of behavior patterns between single children and those with siblings within the age group of 6-12 years explores how family structure influences developmental outcomes during this crucial period of growth. Aims: This study aims to compare the behaviour pattern of single and child with sibling between the age group of 6-12 years in Nadiad city, Gujrat. Settings and Design: Study setting was nadiad city, gujrat Methods and Material: A comparative research design was adopted. Samples were single child and child with siblings between age group of 6-12 years. Tool was administered to 60 children in which 30 were single child and 30 were child with sibling were randomly selected. Demographic data and Modified behaviour checklist used to collect the data. Statistical analysis used: The collected data were entered into Microsoft excel application software package and checked for entry error. Frequency distribution, descriptive statistics, percentage, chi- squared test were applied to analyze the data. Results: Findings revealed, out of 60 children, single child shows that 26.66% child have good behaviour pattern, 33.32% child have average behaviour pattern, 40% single have poor behaviour pattern and among child with siblings' shows that 40% have good behaviour pattern, 23.32% have average behaviour pattern, 36.66% have poor behaviour pattern. It shows that the behaviour pattern of child with sibling is good compared to single child. Conclusions: single child benefit from focused attention and greater independence, while children with siblings gain valuable social skills and experience complex emotional dynamics. Each situation provides unique developmental advantages.
Introduction
Children’s upbringing is shaped by various factors including their physical surroundings, social interactions, cultural norms, economic conditions, and historical context, all of which influence their behaviour during childhood. Research underscores that a child’s socio-cultural environment significantly impacts their development. Cultural differences across societies can lead to distinct patterns in children’s growth and behaviors [1]. Furthermore, studies indicate that children who lack nurturing from a primary caregiver often face challenges later in life, stemming from disrupted early attachment experiences [2].
Subjects and Methods
The study utilized a quantitative and comparative research approach to analyze the behavior patterns of single children versus those with siblings in Nadiad City, Gujarat. The research involved a sample of approximately 60 children, split evenly between single children and those with siblings. Data collection was carried out through a door-to-door survey, with a convenient sampling technique employed to select participants. The research tools were
Results
developed based on existing literature, specifically adapting Achenbach’s behavioral checklist. The tool comprised two sections: Section A gathered demographic information such as the mother’s age, education, and occupation, and the child’s details; Section B used a modified 30-item behavioral checklist with a 3-point scale to assess behavior. Scores from Section B were categorized into three behavior patterns: good (0-20), average (21-40), and poor (41-60), with a maximum possible score of 60.
Statement “to assess the behaviour pattern of single child and child with siblings between the age group of 6- 12 years”
| Demographic variables | Components | Frequency | Percentage | ||
|---|---|---|---|---|---|
| Single | Siblings | Single | Siblings | ||
| Mother’s age | 18 – 23 years | 2 | 4 | 6.66% | 13.32% |
| 24 -27 years | 3 | 5 | 10% | 16.66% | |
| 28 – 31 years | 3 | 6 | 10% | 20% | |
| Above 32 years | 22 | 15 | 73.32% | 50% | |
| Educational status | Illiterate | 2 | 5 | 6.66% | 16.66% |
| Primary | 2 | 4 | 6.66% | 6.66% | |
| Secondary | 3 | 9 | 10% | 30% | |
| Higher secondary | 8 | 5 | 26.66% | 16.66% | |
| Graduate | 15 | 7 | 50% | 23.32% | |
| Occupation | Housewife | 17 | 13 | 56.66% | 43.32% |
| Government job | 5 | 7 | 16.66% | 23.32% | |
| Private job | 5 | 5 | 16.66% | 16.66% | |
| Any other | 3 | 5 | 10% | 16.66% | |
| Monthly income | 5000-10,000 | 3 | 2 | 13.32% | 6.66% |
| 10,000-20,000 | 4 | 6 | 13.32% | 20% | |
| 20,000-30,000 | 13 | 8 | 43.32% | 26.66% | |
| >30,000 | 10 | 14 | 33.32% | 46.66% | |
| Child’s Age | 6 – 8 Years | 8 | 8 | 26.66% | 26.66% |
| 9 – 11 Years | 15 | 13 | 50% | 43.32% | |
| 12 Years | 7 | 9 | 23.32% | 30% | |
| Gender | Male | 17 | 12 | 56.66% | 40% |
| Female | 13 | 18 | 43.32% | 60% | |
| Educational Status | 1st Standard | 2 | 5 | 6.66% | 16.66% |
| 2nd Standard | 2 | 2 | 6.66% | 6.66% | |
| 3rd Standard | 6 | 1 | 0% | 3.32% | |
| 4th and above | 20 | 22 | 66.66% | 73.32% | |
| Type of family | Joint family | 20 | 21 | 66.66% | 70% |
| Nuclear family | 10 | 9 | 33.32% | 30% |
Table 1: Frequency and percentage wise distribution of demographic variables of the sample.
Table no.1 Shows that Among the 30 single child sample according to age of mother of child 6.66% were in the age group of 18-23 years,10% were in the age group of 24-27 years, 10% were in the age group of 28-31 years,72.32% were in the age group of above 32 years. Among the 30 child with siblings, the mother of child 13.32% were in the age group of 18-23 years, 16.66% were in the age group of 24-27 years, 20% were in the age group of 28-31 years, 50% were in the age group of above 32 years.
Among the 30 single child according to educational status of mother of child 6.66% were illiterate, 6.66% were primary education ,10% were secondary education, 26.66% were higher secondary education, 50% were graduate. Among the 30 child with siblings 16.66% were illiterate, 13.32% were primary education, 30% were secondary education, 16.66% were higher secondary education, 23.32% were graduate.
Among the 30 single child according to occupation of mother of child 56.66% were housewife, 16.66% were government job, 16.66% were private job, 10% were any other. Among the 30 child with siblings to occupation of mother of child 43.32% were housewife, 23.32% were government job, 16.66% were private job, 16.66% were any other.
Among the 30 single child according to monthly income 13.32% were 5000-10000, 13.32% were 10001-20000, 43.32% were 20001-30000, 33.32% were >30000. Among the 30 child with siblings according to monthly income 6.66% were 5000-10000, 20% were 10001-20000, 26.66% were 20001-30000, 46.64% were >30000.
Among the 30 single child according to child’s age 26.66% were 6-8 years, 50% were 9-11, 23.32% were 12 years. Among the 30 child with siblings according to child’s age 26.66% were 6-8 years, 43.32% were 9-11 years, 30% were 12 years.
Among the 30 single child according to gender 56.66% were male, 43.32% were female. Among the 30 child with siblings according to gender 40% were male, 60% were female.
Among the 30 single child according to educational status 6.66% were 1st standard, 6.66% were 2nd standard, 20% were 3rd standard, 66.66% were 4th standard and above. Among the 30 child with siblings according to educational status 16.66% were 1st standard, 6.66% were 2nd standard, 3.32% were 3rd standard, 73.32% were 4th standard and above.
Among the 30 single child according to type of family 66.66% were joint family, 33.32% were nuclear family.
Among 30 child with siblings according to type of family 70% were joint family, 30% were nuclear family. Analysis and Interpretation of Comparison of Behaviour Pattern of Single Child and Child with Sibling in Nadiad
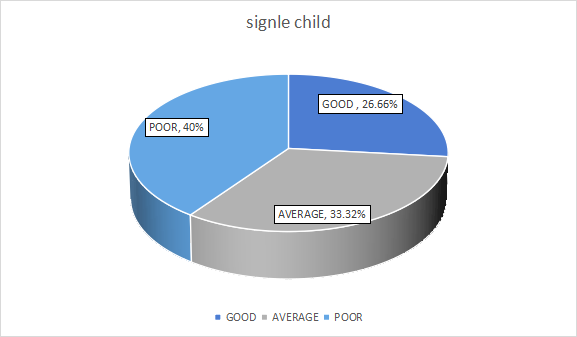
| Score | Single | Single |
|---|---|---|
| Good | 8 | 26.66% |
| Average | 10 | 33.32% |
| Poor | 12 | 40% |
| Total | 30 | 100% |
Table 2: Analysis and interpretation of behaviour pattern of single child. Table 2 show behaviour pattern of single child shows t
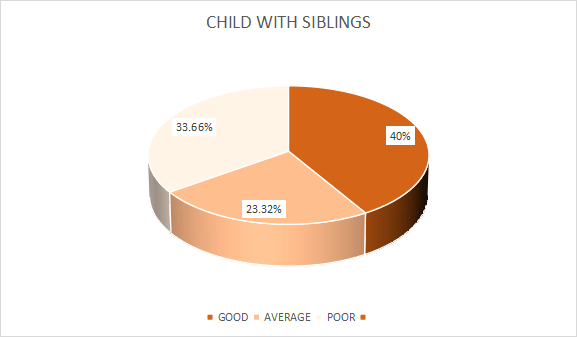
| Score | Siblings | Siblings |
|---|---|---|
| Good | 12 | 40% |
| Average | 7 | 23.32% |
| Poor | 11 | 36.66% |
| Total | 30 | 100% |
Table 3: Analysis and interpretation of behaviour pattern of child with siblings. Table 3 behaviour pattern of child with sibling
| Sr. No | Group | Mean | Standard deviation |
|---|---|---|---|
| 1 | Single Child | 59.44 | 13.44 |
| 2 | Child with siblings | 41.56 | 14.70 |
Table 4: ** Mean score and standard deviation of comparison of behavior pattern of single child and child with sibling.
(30 = single child, 30 = child with siblings). Table 4: Mean score and standard deviation of comparison of behavior pattern of single child and child with sibling.
Table 4 shows that the population wise analysis of mean, percentage and SD of comparison of behaviour pattern of single child and child with siblings, the mean score of single child is 59.44 (SD=13.44229) whereas the mean score of child with sibling is 41.56 (SD=14.70557). The finding revealed that single child have high mean percentage score (59.44) and child with siblings have low mean percentage score (41.56) in the area of behaviour pattern.
- Analysis and Interpretention of Data Related to Associatiation of Behavioural Pattern with Selected
- Demographic Variable
- Sr. No
- Demographic Variable
- Knowledge score
- Chi square value (χ2) df
- Association
- G
- A
- P
- 18-23 years
- 0
- 0
- 2
- 7.394
- 6
- Not Significant
- 24-27 years
- 0
- 1
- 2
- 1
- Mother Age
- 28-31 years
- 0
- 1
- 2
- 32 years and above
- 8
- 8
- 6
- Illiterate
- 0
- 1
- 1
- Primary
- 0
- 0
- 2
- 2
- Educational status
- 13.95
- 8
- Not Significant
- Secondary
- 0
- 1
- 2
- Higher secondary
- 0
- 3
- 5
- Graduate
- 7
- 6
- 2
- Housewife
- 3
- 6
- 8
- 6.092
- 6
- Not Significant
- Government Job
- 3
- 1
- 1
- 3
- Occupation
- Private Job
- 2
- 1
- 2
- Any other
- 1
- 2
- 0
- 5000-10,000
- 0
- 2
- 1
- 7.129
- 6
- Not Significant
- 10,000-20,000
- 0
- 3
- 1
- 4
- Monthly Income
- 20,000-30,000
- 5
- 3
- 5
- 30,000 above
- 3
- 2
- 5
- 6-8 years
- 1
- 2
- 5
- 5
- Child’s age
- 2.628
- 4
- Not Significant
- 9-11years
- 5
- 5
- 5
- 12 years above
- 2
- 3
- 2
- 6
- Gender
- Male
- 7
- 8
- 2
- 13.133
- 2
- Significant
- Female
- 1
- 2
- 10
- 1st Standard
- 0
- 0
- 2
- 5.142
- 6
- Not Significant
- 2nd Standard
- 1
- 0
- 1
- 7
- Educational Status
- 3rd Standard
- 1
- 3
- 2
- 4th and above
- 6
- 7
- 7
- 8
- Type of family
- Joint
- 6
- 8
- 6
- 2.55
- 2
- Significant
- Nuclear
- 2
- 2
- 6
Table 5: Analysis and interpretension of association of behaviour pattern of single child with selected demographic variable.
Regarding mother’s age chi square is 7.394; the probability value is 0.286 which is Not significant. Regarding mother’s educational status chi square is 13.95; the probability value is 0.083 which is Not significant. Regarding mother’s occupation chi square is 6.092; the probability value is 0.413 which is not significant. Regarding monthly income chi square is 7.129; the probability value is 0.3091 which is not significant. Regarding child’s age chi square is 2.628; the probability value is 0.2687 which is Not significant. Regarding gender chi square is 13.133; the probability value is 0.0014 which is significant. Regarding educational status chi square is 5.142; the probability value is 0.567 which is not significant. Regarding type of family chi square is 2.55; the probability value is 0.279 which is significant.
- Sr. No
- Demographic Variable
- Knowledge score
- Chi square value (χ2) df
- Association
- G
- A
- P
- 18-23 years
- 1
- 1
- 2
- 1.915
- 6
- Not Significant
- 24-27 years
- 3
- 1
- 1
- 1
- Mother Age
- 28-31 years
- 2
- 1
- 3
- 32 years and above
- 6
- 4
- 5
- Illiterate
- 1
- 2
- 2
- Primary
- 1
- 2
- 1
- 2
- Educational status
- 12
- 8
- Not Significant
- Secondary
- 7
- 1
- 1
- Higher secondary
- 2
- 1
- 1
- Graduate
- 1
- 1
- 5
- Housewife
- 8
- 4
- 1
- 15.812
- 6
- Significant
- Government Job
- 3
- 4
- 0
- 3
- Occupation
- Private Job
- 0
- 1
- 4
- Any other
- 1
- 2
- 2
- 5000-10,000
- 0
- 1
- 1
- 6.428
- 6
- Not Significant
- 10,000-20,000
- 2
- 2
- 2
- 4
- Monthly Income
- 20,000-30,000
- 3
- 0
- 5
- 30,000 above
- 6
- 5
- 3
- 6-8 years
- 5
- 1
- 2
- 5
- Child’s age
- 1.533
- 4
- Not Significant
- 9-11years
- 5
- 2
- 6
- 12 years above
- 4
- 2
- 3
- 6
- Gender
- Male
- 3
- 5
- 4
- 4.065
- 2
- Not Significant
- Female
- 9
- 2
- 7
- 1st Standard
- 3
- 2
- 0
- 10.032
- 6
- Not Significant
- 2nd Standard
- 0
- 0
- 2
- 7
- Educational Status
- 3rd Standard
- 0
- 1
- 0
- 4th and above
- 9
- 4
- 9
- 8
- Type of family
- Joint
- 12
- 5
- 4
- 11.076
- 2
- Significant
- Nuclear
- 0
- 2
- 7
Table 6: Analysis and interpretension of association of behaviour pattern of child with siblings with selected demographic
Regarding mother’s age chi square is 1.915; the probability value is 0.927 which is not significant. Regarding mother’s educational status chi square is 12.00; the probability value is 0.151 which is Not significant. Regarding mother’s occupation chi square is 15.812; the probability Discussion The implications of these findings are significant. Children with siblings benefit from ongoing social engagement, which enhances their social skills through shared activities and cooperative play. This environment supports behavioral development and fosters qualities such as empathy and cooperation. Single children, while receiving focused parental attention, might face pressures and expectations that could contribute to stress and poor behavior if not balanced with sufficient peer interactions. Family dynamics also play a crucial role. Single children might miss out on the interpersonal skills practice and diverse social experiences that siblings provide, potentially impacting their behavior negatively. Conversely, children with siblings navigate complex relationships that help them develop essential social competencies Statistical analysis showed that single children had a higher average behavior score (35.83) compared to children with siblings (32.56). This indicates that while a greater proportion of single children exhibited poor behavior, those who did exhibit good behavior had relatively high scores. In conclusion, the study suggests that children with siblings generally display better behavior patterns than single children, likely due to the benefits of sibling interactions and the social learning they provide. Single children may face unique challenges related to reduced peer interaction and heightened parental expectations. Future research should further explore these dynamics, focusing on the specifics of sibling relationships, parenting styles, and other influencing factors to gain a deeper understanding of their effects on behavior.
Conflicts of Interest
No
References
-
Trent K, Spitze GD (2011) Growing up without siblings and adult sociability behaviors. J fam 32(9): 1178-1204.
-
Montgomery H (2008) An Introduction to Childhood: Anthropological Perspectives on Children’s Lives. Blackwell Publishing.
-
Bowlby J (1969) Attachment and Loss. Attachment. Attachment and Loss. New York: Basic Books 1.
-
Bank SP, Kahn MD (1997) Sibling relationships and children’s development. In: McElroy SE (Ed.), Handbook of Child Psychology, Wiley, pp: 175-204.
-
Dunn J, Plomin R (1990) Separate Lives: Why Siblings Are So Different. Basic Books.
-
Whiteman SD, McHale SM, Soli A (2011) Theoretical Perspectives on Sibling Relationships. J Fam Theory Rev.
- Occupational Stress and Mental Health Outcomes Among Police Officers: A Mini Review
- The Experience of Counterproductive Leadership on Mental Health and Impact on Retention in U.S. Marines: A Phenomenological Study
- Nomophobia in the Digital Age: A Study on College and University Students
- Emotional Regulation in Children with Autism and Learning Disabilities
- Antisemitism on American College Campuses and Its Impact on Jewish Students
- Exploring the Role of Empathy in the Associations of Family Functioning and Purpose in Life with Attitude towards Abortion among Undergraduates: A Moderation Analysis