Geophysical Investigation of the Seismogenic Monitoring Center, Ile-Ife, Nigeria
2D electrical resistivity tomography was observed at Ile-Ife seismographic station, Osun state Nigeria with the aim of investigating the geological structures beneath the station in order to identify areas of anomalous resistivity that might be related to fractures or fault lines and also determine the lithology of the subsurface. This is to ensure that data observed by the seismic station are gotten with less noise. The data was carried out with Terrameter SAS 1000 and ES 464 electrode selector equipment. Dipole-dipole configuration at electrode spacing of 2 m was used to acquire the data. The result showed that the station is underlain by three layers; overburden composed of lateritic clay, clayey sand, the weatheredandfresh basement. Faultlines and fractured zones were not observed in all profiles.
Introduction
Seismological observatories are houses specifically built to house seismic hardware. The science of seismology depends critically on data collected at hundreds of observatories world-wide. These observatories are operated by variety of agencies, staffed by seismologists and technicians whose training and interest vary widely. While in industrialized countries, the observatory personnel normally have easy access to up- to-date technologies, spare-parts, infrastructure, know- how, consultancy and maintenance services, those in developing countries are often required to do a reliable job with very modest means. Recent seismic activities in Nigeria and some parts of the West-African sub-region has shown that the region is most probably seismically unstable, that is, there exist fault lines that pass through the region. Therefore the need to continuously monitor the crust and the upper mantle for possible prediction of earthquake phenomena informed the establishment of the Center for Geodesy and Geodynamics, under the Federal Ministry of Science and Technology has been saddled with the responsibility of establishing and networking of Nigeria Network seismographic stations. Scientists and technicians at the centers have been working round the clock to ensure that the quality of data obtained from these stations is of international standard. Quality data are required with less noise to achieve this. The observance of noise on the seismic data affects the quality for precise earthquake locations. This noises which could be attributed to geological structures beneath the subsurface, could give false interpretation of the subsurface. This research is to ensure that such data are gotten with less noise due to unknown geological structures beneath the subsurface. To ensure that such data are correct, a geophysical investigation is required to be carried out at the station to identify areas of anomalous resistivity that might be related to fractures or fault lines and to also determine the lithology of the subsurface. This to ensure that the data collected are of genuine quality and not just inferred by geological structures.
Geophysical investigations of the earth involve studying the physical properties of the earth to provide vital information on subsurface material conditions for numerous practical applications (Loke, 1999). These are done by taking measurements at or near the earth’s surface that are influenced by the internal distribution of physical properties. Consequently, analysis of these measurements can reveal how the physical properties of the earth’s interior vary vertically and laterally that reflect the subsurface geology. The methods employed include gravity, magnetics, seismic, resistivity, induced polarization, self-potential, radiometrics, ground penetrating radar, electromagnetic methods, etc. These methods are cost effective and capable of detecting and delineating local features of interest [1].
The Ile-Ife seismographic station is situated also on the basement complex in the equatorial rain forest of southern part of Nigeria with latitude 07° 32’ 49.06’’N and longitude 04° 32’ 50.34’’E. The main lithologies include amphibolites, migmatite gneisses, granites and pegmatites. Other important rock units are schists, made up of biotite schist, quartzite schist, talc-tremolite schist, and the muscovite schist. The crystalline rocks intruded into these schistose rocks [6]. The amphibolite and the hornblende gneiss are the mafic and intermediate rocks in southwestern Nigeria. In Ilesha and Ile-Ife areas these amphibolites occur as low lying outcrops and most are seen in riverbeds while, the hornblende gneiss crops out at Igangan, Aiyetoro and Ifewara, along Ile-Ife road as low lying hills in southwestern Nigeria [6]. The hornblende gneiss is highly foliated, folded and faulted in places.
Recent developments in the electrical exploration methods have resulted in a lot of contributions in providing accurate subsurface information. One of the most important is the increasingly widespread use of two dimensional (2D) and three dimensional (3D) resistivity surveys [2, 3, 4]. The 2D surveys are the most practically economic compromise both in achieving accurate results and in limiting the survey cost [5].
Location and Geology of the Study Area
![Figure 1: Geological Map of Nigeria showing the study area (box) [15].](/fulltextimages/3349/fig_1.jpeg)
The magmatite-gnessic complex which constitutes over 75% of the surface area of the southwestern Nigerian basement complex is said to have evolved through 3 major geotectonic events: (i) Initiation of crust forming process during the Early Proterozoic (2000 Ma) typified by the Ibadan (Southwestern Nigeria) grey gneisses considered by Woakes to have been derived directly from the mantle [7]. (ii) Emplacement of granites in Early Proterozoic (2000 Ma) and (iii) The Pan African events (450-750 Ma). Rahaman and Ocan [8] on the basis of geological field mapping reported over ten evolutionary events within the basement complex with the emplacement of dolerite dykes as the youngest. On the basis of wide geochemical analyses and interpretation, tectonics studies, field mapping and plumb tectonics, Oyinloye [9, 10, 11, 12, 13] had suggested a modified sequence of evolutionary events in the Southwestern Nigeria basement complex as detailed in Figure 1 Burke [14]. The study area is underlain by regional gray gneiss and mica schist, and a sequence of lateritic clay (aquitards), clayey sand/sand, and weathered/fractured bedrock. The clayey sand/sand and weathered/fractured bedrock constitute the main aquifer, located within a bedrock depression that is the catchment area for the region. The relatively low-lying, gently undulating pediments are dissected by several river valleys.
Materials and Method
Data Acquisition and Processing
To achieve a 2D electrical resistivity tomography of the study area, the ABEM SAS 1000 Terameter was used, choosing the dipole-dipole array. The dipole-dipole array is very sensitive to horizontal changes in resistivity, but relatively insensitive to vertical changes in the resistivity [16]. Measurements were made along four profiles with each profile covering a total length of 164 m. The choice of direction of the profiles was so as to cover the study area which has a dimension of 164 by 82 m.
The collected data resistivity was processed and inverted using the RES2DINV software developed by Loke and Barker [17]. The inversion technique used was the standard least-square smoothness constrain. Generally, the programme automatically creates 2D model by dividing the subsurface into rectangular blocks [17] and the resistivity of the blocks was iteratively adjusted to reduce the difference between the measured and the calculated apparent resistivity values. The apparent resistivity values were calculated by the finite-difference method. The program calculates the apparent resistivity values and compares these to the measured data. During iteration, the modelled resistivity values will be adjusted until the calculated apparent resistivity values of the model agree with the actual measurements. The iteration is stopped when the inversion process converges (i.e., when the RMS error either falls to acceptable limits, usually less than 5% or when the change between RMS errors for consecutive iterations becomes infinitesimally small). Prior to data inversion, the apparent resistivity data set were inspected in accordance with the suggestion of Loke [18] for bad datum point and such points were deleted.
Interpretation of Results
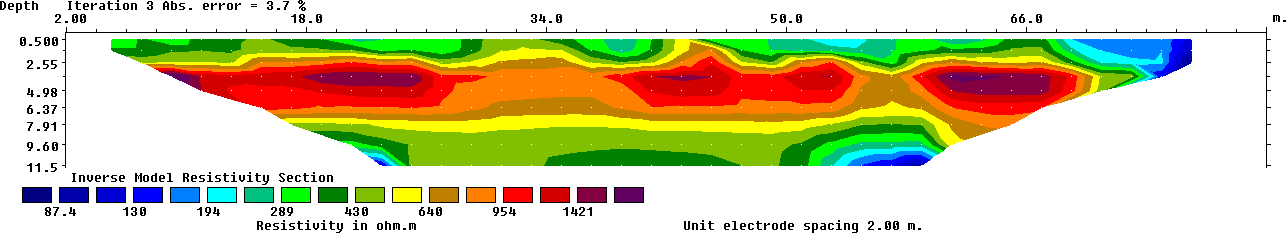
The results of the standard constrain inversion technique for the dipole-dipole array configuration for each profile is presented in Figures 2-5. R.M.S. errors of 3.7%, 4.1%, 5.0% and 5.4% were obtained. Profile one runs west-east of the study area, covering a distance of 82 m. The resistivity model revealed high resistivity values (900 Ωm-1400 Ωm) of depth 2.5 -5.0 m, with lateral distance of 2 – 70 m. Lower resistivity values (280 Ωm - 430 Ωm) are found at depth of 0 -2.4 m with a lateral distance of 2 – 80 m.
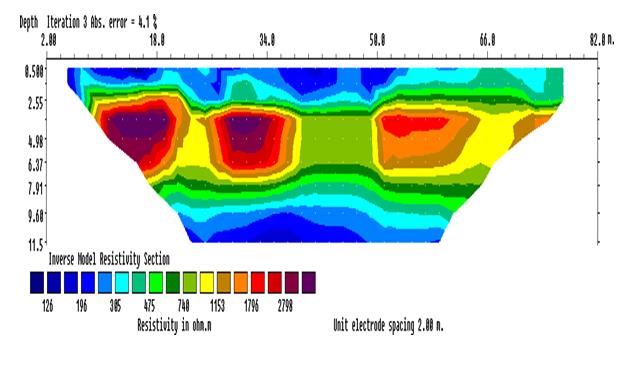
Profile 2 runs north-south of the study area, covering a distance of 82 m. The resistivity model showed low resistivity values (100 Ωm-305 Ωm) at a depth of 0 – 2.9 m, with a lateral length of 5– 55 m. Higher resistivity values (1000 Ωm-2500 Ωm) were observed at depth range of 3.0 m- 4.0 m, with lateral distance of 10 – 58 m. At a depth of 7.90 – 11.5 m. Lower resistivity range (200 Ωm- 305 Ωm) is observed, with a lateral length of 18 – 55 m.
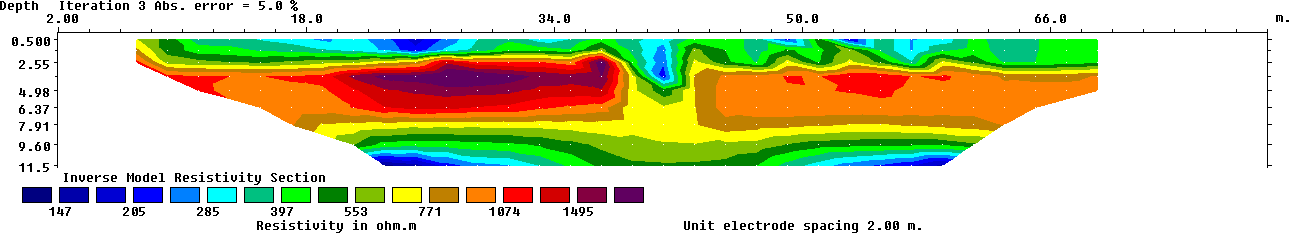
Profile 3 runs north –south of the study area, at an inter-profile spacing of 20 m from profile 2. The resistivity model showed low resistivity values (200 Ωm-285 Ωm) at a depth of 0 – 2.5 m, with a lateral distance of 5 -68 m. Higher resistivity values (1000 Ωm-2000 Ωm) are found at a depth range of 3.0 – 7.90 m, covering a lateral distance of 5 – 60 m. Lower resistivity range (200 Ωm-250 Ωm) is observed at depth of 8.0 – 11.5 m, with a lateral distance of 20 -55 m.
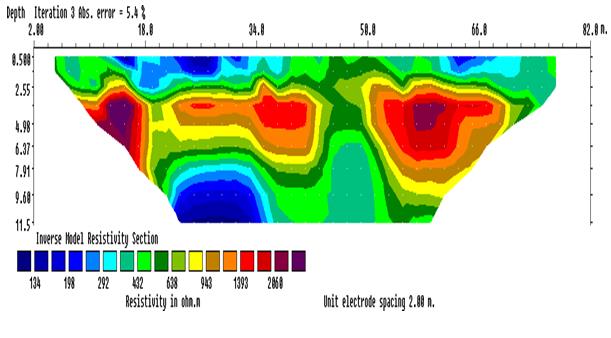
Profile 4 runs west-east of the study area, with an inter-profile spacing of 20 m from profile 1. Low resistivity values (100 Ωm-300 Ωm) were observed at a depth range of 0 – 2.55 m, with a lateral distance of 5- 70 m. Higher resistivity values (1000 Ωm-2500 Ωm) were observed at a depth range of 3.0 – 7.90 m, covering a lateral distance of 5 -65 m. Lower resistivity range (130
Ωm-230 Ωm) was observed at a depth of 8.0 – 11.5 m, covering a lateral distance of 20 – 50 m.
Discussion of Results
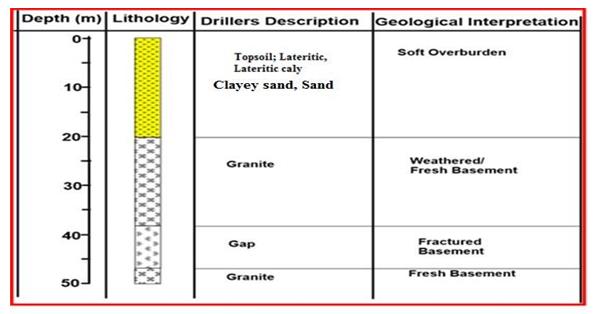
It can be seen that all four profiles (Figure 2-5) consist of three layers; overburden layer, weathered basement rock and the fresh basement layer. The overburden includes the topsoil, clayey sand/sand or sandy clay/clay, and the weathered/ fractured basement, whose thickness ranges from 3.1–35 m, as partially confirmed by the dug pits. Generally, the distribution of the surface soil resistivity in the inversion models show a wide variation in the soil resistivity and at different depth along the profiles. The resistivity of the three-layer case reveals the top layer is characterized by its relatively low resistivity across the study site with the resistivity values ranging between 100 Ωm- 400 Ωm. with thickness varying from <1.2 m-2.9 m. The variation in the resistivity values depict the inhomogeneity nature of the layer. The subsurface heterogeneity comes from the presence of clayey sand/sand clay with lateritic clay and sometimes outcrop (Figure 6).
According to previous literatures (Olayinka AI, Akpan EJ and Magbagbeola OA) [19], the main lithology of the south-western Nigeria basement complex include the amphibolites, migmatite, gneisses, granites and pegmatites. Other important rock units are the schists, made up of biotite schist, quartzite schist talk-tremolite schist and the muscovite schist. Also, the typical geological sequence in a basement complex terrain consist of top layer, highly weathered layer (which is mostly clay/clayey sand) and fractured/ fresh basement rock. In basement complex terrain, the geological structure normally encountered is characterized by the existence of hard rock basement overlain by a weathered overburden of variable thickness [20]. This was used as guide in determining the lithology of the study area. The interpretation of data resulting from the 2D ERT provided information on lateral variations of the formations, resistivity of the weathered/fractured basement and presence or absence of fracture zones.
The fresh/fractured basement underlies the aquiferous zone, with resistivity ranging from 200 Ωm- 305 Ωm with varying depth > 35 m. Geophysical studies in south-western basement complex of Nigeria have identified thick overburden as zones of high ground water potentials [21, 22, 23].
Conclusion
2D electrical resistivity tomography has provided a clear view of the lithological units and geo- electrical structure underlying the study area. The area is underlain by three layers of different lithological units. Also, no fault lines or fractured zones were observed in all profiles and as a result no geological structure was found to infer false results to the seismic station.
References
-
Oyinloye AO (2002a) Geochemical Studies of granite gneisses: the implication on source determination. Jour Chem Soc Nigeria 26(1): 131-134.
-
Oyinloye AO (2002b) Geochemical characteristics of some granite gneisses in Ilesha area southwestern Nigeria: Implication on evolution of Ilesha schist belt, southwest Nigeria. Trends in Geochemistry India 2: 59-71.
-
Oyinloye AO (2004) Petrochemistry, pb isotope systematic and geotectonic setting of granite gneisses in Ilesha schist belt southwestern Nigeria. Global Jour Geol Sci 2(1): 1-13.
-
Oyinloye AO (2006) Metallogenesis of the lode gold deposits in Ilesha Area of Southwestern Nigeria: Inferences from lead isotope systematic. Pak J Sci Ind Res 49(1): 1-11.
-
Kearey P, Brooks M, Hill I (1988) An introductory to g
-
Griffiths DH, Barker RD (1993) Two-dimensional resistivity imaging and modeling in areas of complex geology. Journal of Applied Geophysics 29(3-4): 211- 226.
-
Ritz M, Parisot JC, Diouf S, Beauvais A, Dione F (1999) Electrical imaging of lateritic weathering mantle over grain and metamorphic basement of eastern Senegal, West Africa. Journal of Applied Geophysics 41(4): 335-344.
-
Dahlin T, Bernstone C, Loke MH (2002) A 3D resistivity investigation of a contaminated site at Lernacken in Sweden. Geophysics 67(6): 1692-1700. and sequence of geological events in the basement complex of Ibadan area Western Nigeria Precamb Res 3(6): 537-545.
-
Akpan OU, Yakubu AY (2010) A review of earthquake occurrences and observations in Nigeria. Earthquake Science 23(3): 289-294.
-
Dahlin T, and Loke MH (1997) Quasi-3D resistivity imaging-mapping of three-dimensional structures using two-dimensional DC resistivity techniques. Proceedings of the 3rd Meeting of the Environ Eng Geophy Soc, pp: 143-146.
-
Loke MH, Barker RD (1996) Rapid least-squares inversion of apparent resistivity pseudosections by a quasi-Newton method. Geophysical Prospect 44(1): 131-152.
-
Dahlin T (1996) 2D Resistivity Surveying for Environmental a
-
Rahaman MA (1988) Recent advances in the study of the basement complex of Nigeria. Symposium on the Geology of Nigeria, Obafemi Awolowo University, Nigeria.
-
Woakes M, Ajibade AC, Rahaman MA (1987) Some metallogenic features of the Nigerian Basement. Jour of Africa Science 6(5): 655-664.
-
Rahaman MA, Ocan OO (1978) On relationship in the Precambrian migmatitic gneisses of Nigeria. J Min and Geol 15(1).
-
Oyinloye AO (2011) Beyond Petroleum Resources: Solid Minerals to the rescue: 31st Inaugural Lecture of the University of Ado-Ekiti. Nigeria Press, pp: 1-36.
-
Loke MH (2002) Tutorial: 2-D and 3-D electrical imaging surveys.
-
Olayinka AI, Akpan EJ and Magbagbeola OA (1997) Geoelectric sounding for estimating aquifer potential in the crystalline basement area around Shaki, Southwest Nigeria, Water Resources. 8(1-2): 71-81.
-
Louis IF, Louis FI, Grambes A (2002) Exploring for favourable groundwater conditions in hard rock environments by resistivity imaging methods: synthetic simulation approach and case study example, International conference on Earth’s Sciences and Electronics. Special Issue, pp: 1-14.
-
Olorunfemi MO and Okhue ET (1992) Hydrogeological and Geologic significance of a geoelectric survey at Ile-Ife, Nigeria Journal of Mining and Geosciences Society 28: 221-229.
-
Oladapo MI, Mohammed MZ, Adeoye OO and Adetola BA (2004) Geoelectric investigation of the Ondo state housing corporation estate, Ijapo Akure, southwestern Nigeria. Journal of Mining and Geology 40(1): 41-48.
-
Oyedele EA, Olayinka AI (2012) Statistical evaluation of groundwater potential of Ado-Ekiti southwestern Nigeria. Transnational Journal of Science and Technology 2(6): 110-127.
- Sense, Gravity, Parity & Chirality in Mathematical Physics
- Quantum Lattice Simulations PHYSICS: Microcircuit Particle Formation and Observable Macroscopic Irreversible Time - A Discrete Lagrangian with Cellular Automata Framework
- Quantum Biology from Biomacromolecule to Cell, and Central Dogma Described by Quantum Theory
- Focus, Agility, Speed and Technology (FAST) for Sustainability and Growth
- Square Root Metric Geometry and Pati-Salam Model in Curved Space-Time
- A Simple System Demonstrating the Mpemba Effect in Classical Mechanics