Both the Phase Modulation and Frequency Shift Evaluation on Laser Vibrometer
Sinusoidal phase-modulated signal light through the interferometer can produce a beat signal. Moreover, its amplitude monotonically changes with the signal light frequency. So the beat signal amplitude can be used to measure laser-Doppler frequency shift. In addition to the beat signal, the phase-modulated signal also contains a direct current signal, and it still contains a large amount of frequency shift information, but the information is not utilized, resulting in the waste of information. In this paper, this kind of phase-modulated laser-Doppler frequency shift measurement method is improved to simultaneously utilize the useful information in the DC and beat signal for the frequency shift measurement. The specific method is to use the ratio of beat signal amplitude to DC signal amplitude to define a new parameter used in frequency shift measurement. The signal light intensity terms in DC and beat signal can be eliminated, so the improved measurement method does not need to measurement the signal light intensity, which makes its structure further simplified. By comparing the frequency change curves between the newly defined parameter and the beat signal amplitude theoretically, we find that they have the same distribution rule. In theory, by comparing the measurement sensitivity curves, it is proved that the improved phase-modulated frequency shift measurement method has higher measurement sensitivity and dynamic range than the un-improved one.
Introduction
Laser-Doppler frequency shift measurement method can be used to acquire information (e.g. vibration and speed) of the target. The phase-modulated frequency-shift measurement method has low requirements on light source and optical system and thereby it is easy to be realized. Extracting amplitude (or phase) of phase- modulated beat signal based on coherent detection method can reduce the working bandwidth of the system effectively, thus decreasing the noise power and bringing extremely high measurement accuracy. Nevertheless, The
DC component of phase-modulated signal also contains abundant useful information, but they are not used effectively, resulting in the information waste.
In this paper, this kind of phase-modulated Doppler-frequency-shift measurement method is improved to simultaneously utilize the useful information in the DC and beat signal for the frequency shift measurement, by using the FM signal stimulation, the measurements of phase shift are gotten. The method in this paper can be used to evaluating the frequency shift on laser vibrometer.
The Phase-Modulated Frequency Shift Measurement Method
Principle of Phase Modulation
The simple-frequency signal after sine phase modulation can be expressed as:
$$E_{in} = E_{0} \exp[i(wt + \beta \sin \Omega t)]$$
Where $E_{0}$ and $w$ are the field intensity and angular frequency of the signal light. $\Omega$ and $\beta$ are the sine-phase-modulated angular frequency and modulation index.
Let the modulation signal light run through the interferometer and the photoelectric detector was used for measurement. The output electric signal can be expressed as:
$$i = i_{d} + i_{\Omega} + i_{2\Omega}$$
Where $i_{d}$ is the DC signal. $i_{d}$ is the beat signal of the once modulation frequency (generated by the carrier wave and two first-order sidebands). $i_{\Omega}$ is the beat signal of the double modulation frequency $2\Omega$ (generated by the positive and negative first-order sidebands. It was overlooked in this paper because it is weak).
The period of sine phase modulation was defined $T_{n}=1/\Omega$, it can be seen from the Equation (2) that at the integral time $T=2nT_{n}(n=1,2,3,...)$ of the out signal $i(t)$ of the detector, the integral results of AC components $i_{n}(t)$ and $i_{2\Omega}(t)$ are zero. In this way, the DC component $i_{d}$ can be extracted:
$$i_{d}(w) = \frac{1}{T} \int_{0}^{T} i(t)dt \propto E_{0}^{2}h'(w)$$
Since the sine-phase modulation frequency $\Omega$ is known, it is easy to generate two orthogonal reference signals with the same frequency of beat signal $i_{d}(t)$:
$$\begin{align*} i_{rs}(t) &= \sin(\Omega t) \\ i_{rc}(t) &= \cos(\Omega t) \end{align*}$$
Through the correlation operation between two reference signals in the Equation (4) and $i(t)$, it can be get:
$$R_{srs}(c)(\tau) = \frac{1}{T} \int_{0}^{T} i(t) \cdot i_{rs}(c)(t - \tau)dt$$
The correlation operation of three components of $i(t)$, namely, $i_{d}$, $i_{\Omega}$, and $i_{2\Omega}$, was implemented. When the integral time is $T=nT_{n}(n=1,2,3,...)$, the integral results of $i_{d}$ and $i_{2\Omega}$ are zero. Then, the equation (5) can be rewritten as:
$$\begin{align*} R_{srs}(\tau) &\propto \frac{E_{0}^{2}}{2} \left| A_{0} \right| \cos(\Omega \tau - \phi_{0}) \\ R_{src}(\tau) &\propto \frac{E_{0}^{2}}{2} \left| A_{0} \right| \sin(\Omega \tau - \phi_{0}) \end{align*}$$
it can be seen from the Equation (6) that:
$$E_{0}^{2} \left| A_{0} \right| \propto 2 \sqrt{\left[ R_{srs}(\tau) \right]^{2} + \left[ R_{src}(\tau) \right]^{2}}$$
$$\phi_{0} = -\arctan \left[ R_{src}(0) / R_{srs}(0) \right]$$
The DC signal $E_{0}^{2}h'$ and the amplitude $E_{0}^{2} \left| A_{0} \right|$ and phase $\phi_{0}$ of the beat signal of once modulation frequency can be gained from the above signal processing method. Meanwhile, the light intensity $E_{0}^{2}$ of signal light can be measured, thus enabling to realize Doppler-frequency-shift.
Improvement Method
To use useful information in $i_{d}$ and $i_{\Omega}$ simultaneously, a new frequency demodulation parameter was defined. Its absolute value $\left| A_{n}(w) \right|$ can use $R_{srs}(\tau)$, $R_{src}(\tau)$ and $i_{d}$ to get:
| 2 | R ( )2+R ( )2 srs src |
|---|
d
| E2 0 | A ( w) 0 |
|---|
(9) ∝ For the comparison, different shapes of shift variation curves of An and A_0 are shown in Figure 1a. It can be seen from Figure 1b that there’s one upper peak and one low peak on the curve of _An(w) and the monotonic changes of the curve between these two peaks run through the origin. The overall shape of this section is same with that of the curve of An(w). This reveals that frequency-shift measurement based on the curve of An(w) is feasible just like the original phase modulation method based on the curve of A_0(_w), including using the origin as the working point.
A w h w ( ) '( )
=
0 It can be seen from the Equation (8) that in the definition process of ( ) n A w , the signal light intensity 2 0 E in i_d and _iΩ is cancelled simultaneously. This implies that the frequency-shift measurement based on An(w) can solve above mentioned problems by indirect use of 2 0 E of i_d only, but doesn’t need to measure 2 0 _E directly.
Moreover, since An(w) is the function of A_0(_w) and '( ) h w ,
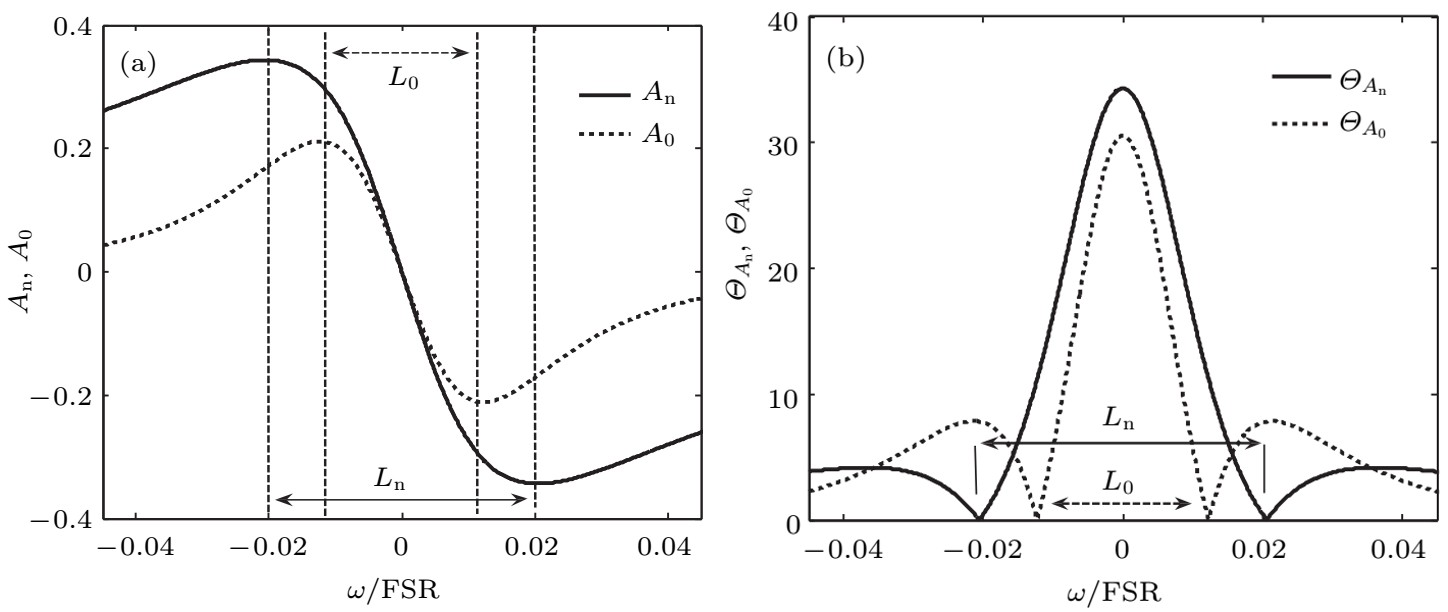
(a) ( ) n A w and 0( ) A w (b) ( ) n A w θ and Figure 1: Curves of An and A_0 and their absolute sensitivities There are some important differences between the curves of _An(w) and A_0(_w). The peak-peak width L_n of the curve of _An(w) is larger than the peak-peak width L_0 of the curves of _A_0(_w) and the curve of An(w) slope is larger than that of the curve of A_0(_w). These determine the larger dynamic range and higher sensitivity of frequency-shift measurement based on the curve of An(w) compared with those based on the curve of A_0(_w).
For the quantitative comparison on dynamic ranges and sensitivity of frequency-shift measurement based on the curves of An(w) and A_0(_w), the variation curves of it is used in the measurement, this means that the frequency-shift information in i_d and _iΩ of the phase- modulated signal are used simultaneously.
Simulations
0 ( ) A w θ
n A θ and
0 A θ changing with frequency.
(0) ( ) n A w θ are shown in Figure
their absolute sensitivities $$ \theta_ {A _ {n (0)} (w)} = \left| d A _ {n (0)} (w) / d w \right|. $$
. Both the
( ) n A w θ and
1b, where
0 ( ) A w θ curves reach the peak at the working point (origin) and then decrease to zero gradually with the further increase of shift. The frequency-shift position of $$ \theta_ {A _ {n}} = \theta_ {A _ {0}} = 0 $$
in Fig 1(b) is corresponding to the shift position of peaks of the curves of An(w) and A_0(_w) in Figure 1 (a), which determines the dynamic range of frequency-shift measurement. The shift range n n L L ) of the curve of An(w) is larger than the range (- ~ 2 2
( 0 0 - ~ 2 2 L L ) of curve of A_0(_w), and in this shift range,
0 n A A θ θ .
The phase-modulated frequency-shift measurement method was improved by defining a new frequency demodulation parameter. It not only can retain the original working mode of phase modulation, but also splitting laser bragg reflect
| oscillator |
detector doesn’t need to measure the signal light intensity, thus simplifying the system structure and reduce the noise channel. Furthermore it can increase the dynamic range and sensitivity of measurement.
Experiment and Result
The experimental apparatus of improved phase- modulated frequency measurement method is shown in Figure 2.
(a) An and A0 (b) ( ) n A w θ and
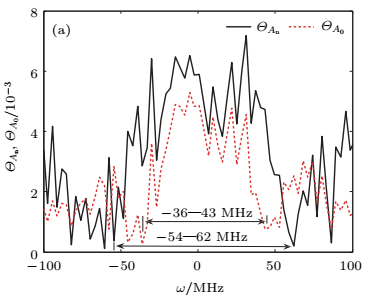
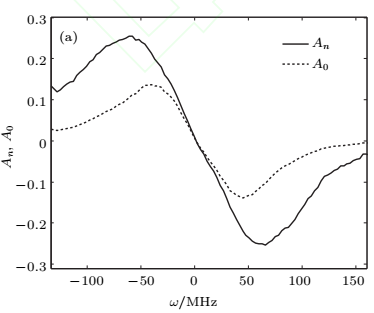
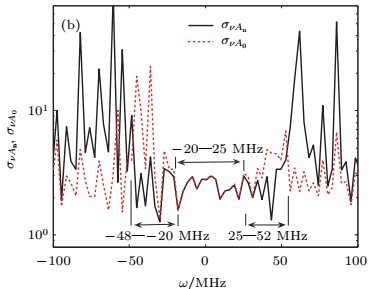
0 ( ) vA w σ Figure 3: Measurement average values curves of An and A0, and curves of frequency-shift measuring sensitivities (0) ( ) n A w θ and standard deviations (0)( ) vA w σ .
prober were calculated, getting the values of DC signal
2 0 ' E h and the amplitude 2 0 0 E A , phase 0φ of the beat signal. Finally, the measured values of A_0 and _An under different frequency can be gained by the data above and the Equation (6)~(9).
0 ( ) A w θ (c) ( ) n vA w σ and Physical Science & Biophysics Journal
$A_n$ and $A_0$ at each frequency-shift position were measured by many times and the corresponding average values were calculated. It can be seen by comparing Figure 1a and Figure 3a that the measured curves of $A_n(w)$ and $A_0(w)$ are very similar with the theoretically calculated curves witch prove the accuracy of theoretical analysis.
Partial differential operation of the measured curves of $A_n(w)$ and $A_0(w)$ in Figure 3a was carried out by numerical calculation, through which the absolute sensitivity ($\theta_{A_n(w)}$ and $\theta_{A_0(w)}$) curves of shift measurement were gained Figure 3b. The dynamic range (about -54~62MHz) for shift measurement of $A_n$ is larger than that of $A_0$ (about -36~43MHz). In the whole dynamic range, there's $\theta_{A_n(w)} > \theta_{A_0(w)}$, this agrees with the distribution law of theoretical curves in Figure 1(b). It can be seen from distributions of curves ($\sigma_{vA_n}(w)$ and $\sigma_{vA_0}(w)$) that $\sigma_{vA_n}$ and $\sigma_{vA_0}$ are basically same in a small frequency shift range of -25~25MHz, but $\sigma_{vA_n}$ is smaller in the range of about -48~20MHz and 25~52MHz. This proves that $A_n$ contributes higher accuracy in frequency shift measurement compared with $A_0$.
Conclusions
DC component of phase-modulation signal includes light intensity information and frequency shift information. However, these information are not used well in previous phase-modulation frequency shift measurement method, resulting in waste of effective information. In this paper, the original phase-modulation frequency shift method is improved to use the useful information in DC component of phase-modulation signals reasonably. The improved method requires no light intensity detector. It not only has simplified structure, but also reduces nose entrance into channels. Experimental results proved the accuracy of the theory, and by using the improved method, the dynamic measurement range and measurement accuracy are all increased.
References
-
Koning R, Wimmer G, Witkovsky V (2014) Ellipse fitting by nonlinear constraints tomododulate quadrature homodyne interferometer signals and to determine thestatistical uncertainty of the interferometric phase. Meas Sci Technol 25(11): 115001.
-
Pozar T, Mozina J (2011) Enhanced ellipse fitting in a two-detector homodyne quadrature laser interferometer. Meas Sci Technol 22(8): 085301.
-
Hu P, Zhu J, Guo X, Tan J (2015) Compensation for the Variable Cyclic Error in Homodyne Laser Interferometers. Sensors 15(2): 3090-3106.
-
KIM C, LI G, LI J (2013) Numerical analysis on effective electric field penetration depth for interdigital impedance sensor. Journal of Physics 418: 012020.
-
ISO (2011) Methods for the calibration of vibration and shock transducers Part 41: Calibration of laser vibrometers. 1st (Edn.), pp: 45.
-
Vuye C, Vanlanduit S, Preseznkiak F, Steenackers G, Guillaume P (2011) Optical measurement of the dynamic strain field of a fan blade using a 3D scanning vibrometer. Optics and Lasers in Engineering 49(7): 988-997.
-
Allen MS, Sracic MW (2010) A new method for processing impact excited continuous-scan laser Doppler vibrometer measurements. Mechanical Systems and Signal Processing 24(3): 721-735.
-
Shibata N, Nakazono A, Inoue Y (2005) Interference between two orthogonally polarized modes traversing a highly brief ringent air-silica microstructure fiber. Light wave Technology 23(3): 1244-1252.
-
Zhu S, Zhou W, Song Y (2012) Detecting oscillation amplitude and defects of hard disk rotating in high speed by laser Doppler technique. Measurement 45(1): 74-78.
-
Castellini P, Martarelli M, Tomasini EP (2006) Laser Doppler Vibrometry: Development of advanced solutions answering to technology's needs. Mechanical Systems and Signal Processing 20(6): 1265-1285.
- Sense, Gravity, Parity & Chirality in Mathematical Physics
- Quantum Lattice Simulations PHYSICS: Microcircuit Particle Formation and Observable Macroscopic Irreversible Time - A Discrete Lagrangian with Cellular Automata Framework
- Quantum Biology from Biomacromolecule to Cell, and Central Dogma Described by Quantum Theory
- Focus, Agility, Speed and Technology (FAST) for Sustainability and Growth
- Square Root Metric Geometry and Pati-Salam Model in Curved Space-Time
- A Simple System Demonstrating the Mpemba Effect in Classical Mechanics