Unbalanaced Ranked Set Sampling and its Application in Medical Science
Rank set sampling is a sampling procedure that can be considerably more efficient than simple random sampling. Although ranking processes for continuous variables that are implemented through either subjective judgment or via the use of a concomitant variable have been studies extensively in the literature, the use of RSS in the case of binary variables has not been investigated thoroughly. We use a National Health and Nutrition Examination Survey III (NHIS) data set to investigate the application of unbalanced RSS to estimation of population proportion. Our results indicate that this use of logistic regression improve the accuracy of the preliminary ranking in unbalanced rank set sampling and leads to substantial gains in precision for estimation of a population proportion. Further, we illustrate how data from one source can be used to construct the necessary logistic regression equation, which can in turn be used to estimate the relevant properties. This research was conducted to find out whether unbalanced rank set sampling is better than the simple random sampling, balanced rank set sample and rank set sampling. We also find out whether risk factors of diabetes like age, pregnancies, pg concentration, diastolic BP, trifold thick, serum Ins. After using simple random sampling, than we rank the values, using balanced and unbalanced rank set sampling.
Introduction
Ranked set sampling, originally developed by Mclntyre [1], combines simple random sampling with the field investigator’s professional knowledge and judgment to pick places to collect samples. Alternatively, field screening measurements can replace professional judgment when appropriate. The use of ranked set sampling increases the chance that the collected samples will yield representative measurements. This result in better estimates of the mean as well as improved performance of many statistical procedures such as testing for compliance with risk-based or background- based standards.
Moreover, ranked set sampling can be more cost- efficient than simple random sampling because fewer samples need to be collected and measured. The use of professional judgment in the process of selecting sampling locations is a powerful incentive to use ranked set sampling. Professional judgment is typically applied by visually assessing some characteristic of feature is a good indicator of the relative amount of the variable or contaminant of interest that is present.
Ranked set sampling is an alternative to simple random sampling that has been receiving considerable attention in the statistics literature. Researchers have shown that ranked set sampling outperforms simple random sampling in many situations by reducing the variance of a parameter estimator, thereby providing the same accuracy with a smaller sample size than is needed in simple random sampling. Ranked set sampling involves preliminary ranking of potential sample units on the variable of interest using judgment or an auxiliary variable to aid in sample selection. Ranked set sampling prescribes the number of units from each rank order that are to be measured.
Rank set sampling has many applications in industrial statistics, environmental and ecological research as well as medical studies. For example, in analysis of environment risks of hazardous waste sites, measuring toxic chemicals and assessing their environmental impact requires substantial scientific processing of materials and consequently, high cost. However, the hazardous waste sites can be easily ranked according to their contamination levels by utilizing a visual inspection of defoliation or soil discoloration.
The goal of rank set sampling is to collect data from a population that are much likely to span the full range of the values in the population and therefore is much representative of it them the same number of observations obtained via sample random sampling. RSS is worth considering if
- The cost of measurement (Lab Analyses) is far greater than the cost of collecting the samples.
- An auxiliary characteristic is available that is highly correlated with the main characteristic of interest and is also in expensive to measure.
- The approach used in ranking set sampling is indicated by the simple example in the following table, where we select a sample of five households from a village.
Example of Ranked Set Sampling
| Household | Ranked households |
| A B C D E | C A D B E |
| F G H I J | H I F J G |
| K L M N O | L K N O M |
| P Q R S T | P R T Q S |
| V W X Y Z | X Y Z W Y |
| Selected Samples | C I N Q V |
Table 1: Ranked Set Sampling.
- Five random samples each of five households are drawn up (e.g. by listing the qualifying households) and selecting five at random without replacement five times. One subsample is then picked from the set examined by a quick method and ranked on a key criterion, such as wealth. The household ranked 1 is taken into the final sample.
- The process is repeated in the four other subsamples the household ranked 2 being chosen from subsamples 2 for selection to the final sample and so on, until a round is completed after five subsamples.
- The other households in the subsamples are generally discarded (but see below). They have served the purpose of comparators to give some improved assurance of what the ranked set sample represents.
- Ranked set samples are more regularly spaced than simple random samples.
We conclude our discussion of RSS by illustrating a very important property of the RSS design with a simple example. Suppose we want to estimate the average weight of a herd of elephants. Furthermore, assume this sample herd of elephants has one calf for every mother elephant and had no father elephants at all. We will consider two options. Simple Random Sampling: Pick two elephants at random, weigh then and use their average weight as an estimate of the average weight for the entire herd. Note that this procedure gives an unbiased estimate. Ranked Set Sampling: Pick two elephants randomly in the morning, pick the smaller of the two and weigh it. Pick two elephants randomly in the afternoon, pick the larger of the two and weight it. Use the average weight of the two elephants chosen in this way as an estimate of the average weight for the entire herd. It can be shown that this estimate is also an unbiased estimate of the average weight of the herd.
Balanced Ranked Set Sampling
In a balanced ranked set sampling, the number of measurements made on each ranked statistic is the same for all the ranks. A balanced ranked set sampling produces a data set as follows 𝑋[1]1 𝑋[1]2 . . . 𝑋[1]𝑚 𝑋[2]1 𝑋[2]2 . . . 𝑋[2]𝑚 . . . . . . . . . . . . . 𝑋[𝑘]1 𝑋[𝑘]2 . . . 𝑋[𝑘]𝑚 (2.1)
It should be noted that 𝑋[𝑟]𝑖
′ 𝑠 in (2.1) are all jointly free and in addition, the 𝑋[𝑟]𝑖′𝑠 in the same row are identically distributed. We denote by 𝑓[𝑟] and𝐹[𝑟], respectively, the density function and the distribution function of the common distribution of the𝑋[𝑟]𝑖′𝑠. The density function and the distribution function of the underlying distribution are denoted respectively by f and F.
Unbalanced Rank Set Sampling
An unbalanced RSS is one in which the ranked order statistics are not quantified the same number of times. An unbalanced ranked-set sample is given as follows.
𝑋(1)1 𝑋(1)2 . . . 𝑋(1)𝑛1 𝑋(2)1 𝑋(2)2 . . . 𝑋(1)𝑛2 𝑋(3)1 𝑋(3)2 . . . 𝑋(1)𝑛3 𝑋(𝑘)1 𝑋(𝑘)2 . . . 𝑋(𝑘)𝑛𝑘 It should be noted that 𝑋[𝑟]𝑖 ′
𝑠 are all jointly free and in
addition, the 𝑋[𝑟]𝑖′𝑠 in the same row are identically
distributed. The sample can be considered as obtained
from n = ∑
$$ \sum_ {r = 1} ^ {k} n _ {r} $$
sets of random sampling units, each of
size k, by first ranking the units of each set and then, for r
= 1, k, measuring the rth ranked order statistics for 𝑛𝑟
ranked sets.
Advantages
The advantages of ranked set sampling as follows
- The estimated mean of ranked set sampling data is a statistically unbiased estimator of the correct mean.
- Ranked set sampling provides increased capability to detect differences in means or medians of two populations
- Ranked set sampling can be used in other sampling designs such as stratified random sampling and complex sampling.
- Ranked set sampling can be used to obtain more characteristic data for purposes other than estimating a mean by covering more of the target population.
- Ranked set sampling can be used for the estimation of tree volume in a forest Stokes and Sager [2].
- It can be used to estimate mass herbage in a paddock Cobby, et al. [3].
When the objective of sampling is to estimate the mean, thought should be given to using ranked set sampling relatively than simple random sampling when the cost of ranking likely sampling locations in the field is negligible or very low compared to the cost of laboratory measurements.
Balanced Vs. Unbalanced Rank Set Sampling
In this section, we discuss balanced rank set sampling and unbalanced rank set sampling methods of assigning the number of sampling units that will be sampled from each rank. The balanced rank set sampling approaches an estimator of the population mean with variance that is always less than or equal to the variance of the rank set sampling estimator based on the same number measured units. This is true even when there are errors associated with the ranking. In fact the only time that variance equality is achieved is when the ranking process is purely random. At all other times, the balanced rank set sampling estimator for a population mean has better precision than the analogous simple random sampling estimator.
Unbalanced rank set sampling allocates units to each
rank unequally. The optimal form of unbalanced
allocation that leads to minimum variance among the
class of all rank set sampling estimators is known as
Neyman allocation. It allocates sample units to each order
statistic proportionally according to its variance. We let 𝑛𝑖
denote the number of observations allocated to the 𝑖𝑡ℎ
order statistic. We still sample m sets of size n units each
from the population and obtain rankings of the variable of
interest within each set as before. The total number of
measured units is then𝑛= ∑
$$ \sum_ {i = 1} ^ {m} n _ {i}. $$
. If the allocation is
chosen appropriately, unbalanced rank set sampling can
improve on both balanced rank set sampling and simple
random sampling. On the other hand, if the allocation is
not chosen well, the unbalanced rank set sampling
estimator can be less precise than either the balanced
rank set sampling estimator or the simple random
sampling estimator.
Objectives
The objective of the study are: 1. To provide more structure for the collected sample items, and use this structure to develop efficient inferential procedures. 2. To compare unbalanced rank set sampling with other techniques.
Review of Literature
Mclntyre [1] explained that one attribute is of primary interest and base the selection of samples on the ranking with the respect to this attribute, which therefore acts as a concomitant variable for the other attributes. This works reasonably well if the primary attribute is highly correlated with the other attributes of interest, since the rankings of different attributes are then likely to be similar, but is unsatisfactory for the leaf samples, because there is only a weak negative correlation between the spray deposits on the upper and lower surface.
Evans [4] applied the RSS to the regeneration surveys in areas direct-seeded to longleaf pine. He noted that the means based on both RSS and SRS methods were not significantly different, but the computed variances of the means were very different. More usually, the lack of errors of ranking, the optimal allocation, the decreasing the variation of the statistics of the population mean, is the allocation by Neyman, in which the amount of items calculated at the 𝑗𝑡ℎ rank is relative to the dispersion of the 𝑗𝑡ℎ order statistic.
Takahasi, et al. [5] described that more generally, in the absence of ranking errors, the optimal allocation, in the sense of minimizing the variance of the estimator of the population mean, is the Neyman allocation, in which the number of samples measured at the 𝑗𝑡ℎ rank is proportional to the standard deviation of the 𝑗𝑡ℎ order statistic.
Ridout, et al. [6] suggested that the relative precision of rank set sampling to simple random sampling is dependent upon the information gained by ranking relative to the population variance and the set size n. When ranking is completely random and provides no information the relative precision will be equal to 1. Ranking sets of items that are similar, for example ranking spatially close items when there is a trend on a site, will also drive the relative precision towards 1, since the variance contained with each set is less than that present in the distribution.
Patil, et al. [7] discussed this problem in some situations, we may be interested in measuring several attributes of each sample. In the particular example that motivated this work the sampling unit was a leaf and the amounts of spray deposited on both the upper and lower leaf surfaces were of interest. Norris, et al. [8] recognized this, and suggest that estimates might be obtained from a small pilot ranked set sampling study with equal allocation. However, such estimates have large sampling errors and can lead to allocations that are less efficient than balanced rank set sampling.
The interpolation of adjacent order statistics suggested by Hettmansperger and Sheather [9] was considered by the authors to have confidence interval by extending the interpolated confidence intervals to the RSS data for small sample sizes. The authors concluded that the quantile intervals using RSS have shorter expected lengths or higher coverage probabilities than their simple random sample competitors.
According to Kaur, et al. [10] and Barnett [11] considered when the population distribution is highly skewed, as is often the case for environmental variables, the precision of ranked set sampling may be increased by using an unbalanced allocation, with more high-ranked samples selected for measurement. Al-Saleh, et al. [12] suggested Bayesian parameter estimation of the causal sharing by using sampling of rank set. In terms of the Bayes possibility, the Bayes possibility of the Bayes estimator using rank set sampling procedure is less than the Bayes risk of the Bayes estimator using simple random sampling. The method was used for estimating the mean milk revenue of 402 sheep.
Hossain [13] suggested a nonparametric approach for the modified RSS method for the population mean estimation, namely nonparametric selected ranked set sampling. Unlike the usual RSS where we chose only one unit from each ranked set of size m. Wolfe [14] discussed balanced rank set sampling for estimating population proportions via the use of logistic regression to aid in the rankings. They illustrated how to use their procedure by applying it to the National Health and Nutrition Examination Survey III (NHANES III) data set to estimate the percentages of over- weight and obese individuals in the population.
Stasny, et al. [15] discussed that the improvement impression for a balanced ranked set sampling estimator over a simple random sampling estimator is larger for a population close to 0 or 1. For this reason we believe it is natural to consider using unbalanced rank set sampling, in particular the Nayman allocation to further improve the estimation in the case of a population proportion close to 0 or 1, of course the implementation of the Neyman allocation requires some knowledge of the various of all the order statistic. In the case of perfect ranking the probability of success for each order statistic can be expressed as a fraction of the underlying population proportion.
Chen, et al. [15] demonstrated that theoretically the patterns of his improvement under perfect ranking for both balanced and unbalanced rank set sampling. When the ranking process is perfect, the probabilities of success for order statistics can be expressed as functions of the underlying population proportion, which leads to simplified presentations of the relationships between relative precision and p. Wolfe [14] investigated that the improvement in estimation of cell probabilities by using rank set sampling procedures when the variable of interest is ordinal. The use of ordinal logistic regression to aid in the rankings leads to substantial gains in precision in both balanced and unbalanced rank set sampling settings. They noted that the goodness of fit of the ordinal logistic regression model is not crucial for the purpose of ranking. The key point is that additional information is gathered by using the ordinal logistic regression model to assist in sample selection. Koyuncu [16] introduced calibration estimator under stratified ranked set sampling design. Shahzad, et al. [17] introduced mean estimator under ranked set sampling design for sensitive variables.
Material and Methods
This part is setting off on talk over those procedure used, the contemplate population, example span Furthermore testing system.
Research Design
Research design used in this study is descriptive analysis. A study of the hazard features of diabetes is defined through logistic regression model. The choice of the design analysis was considered appropriate because it allows verifying whether the studied factors are statistically significance or not. The description through multiple logistic regression model was preferred because the dependent variable is categorical and independent variable are either continuous or dichotomous. The use of analysis therefore was considered to be more appropriate in terms of resources, time and the overall objective of the study.
Study Population
This research was conducted to find out whether unbalanced rank set sampling is better than the simple random sampling, balanced rank set sample and rank set sampling. We also find out whether risk factors of diabetes like age, pregnancies, pg concentration, diastolic BP, trifold thick, serum Ins, bmi, dp function are pre
Sample Size and Sampling Procedure
The study would have considered the medical data of diabetes NHIS website. The secondary data was used. However simple random sampling has been used to select the patient. With this technique each element has an equal probability of being selected, but combinations of elements have different probabilities. Seven hundred and sixty eight patient samples are collected. After using simple random sampling, than we rank the values, using balanced and unbalanced rank set sampling.
Procedure of Selection Balanced Rank Set Sample
- Select a simple random of size n from a population without replacement.
- Given those ranks of all the simple random sample values of size m.
- Select rank 1 values from first SRS1, similarly select rank 2 values from SRS 2 and so on.
- If we need twelve rank values of rank size 4 so in balance rank set sampling we arrange them in order 1, 2, 3 and 4 along with their original values.
- Similar steps repeat for rank set size 9 and 16
Procedure of Selection Unbalanced Rank Set Sample
- Select a simple random of size n from a population without replacement.
- Given those ranks of all the simple random sample values of size m.
- Select rank 1 values from first SRS1, similarly select rank 1, rank 2 or rank 3 values from SRS 2 and so on.
- If we need twelve rank values of rank size 4 so in unbalance rank set sampling we arrange them in order 1, 2, 3 and 4 along with their original values.
- Similar steps repeat for rank set size 9 and 16
Frame Work
The following Table explains the independent variable and dependent variables Table 2.
| Dependent Variable | Independent Variable |
|---|---|
| Age | |
| Pregnancies | |
| PG Concentration | |
| Diabetes | Diastolic BP |
| Trifold Thick | |
| Serum Ins | |
| BMI | |
| DP function |
Table 2: Dependent Variables and Independent Variables.
Results and Discussion
The present study was an attempt to know about the application of unbalanced rank set sampling. As stated in the previous chapter, we selected data from NHIS website having population size 768. The results obtained were put through statistical analysis and are presented in this chapter. Simulation of Simple random sampling, Balanced rank set sampling and unbalanced rank set sampling.
| SRS 4 | Rank | SRS 5 | Rank | SRS 6 | Rank |
| 2 | 2 | 7 | 2 | 1 | 3 |
| 1 | 2 | 6 | 2 | 2 | 2 |
| 3 | 1 | 10 | 1 | 3 | 1 |
| 5 | 3 | 8 | 4 | 0 | 4 |
| SRS 7 | Rank | SRS 8 | Rank | SRS 9 | Rank |
| 2 | 3 | 8 | 1 | 2 | 3 |
| 5 | 2 | 0 | 2 | 8 | 1 |
| 6 | 1 | 8 | 1 | 6 | 1 |
| 9 | 3 | 3 | 4 | 0 | 2 |
| SRS 10 | Rank | SRS 11 | Rank | SRS 12 | Rank |
| 6 | 3 | 1 | 3 | 1 | 3 |
| 7 | 2 | 4 | 2 | 10 | 1 |
| 8 | 1 | 7 | 1 | 4 | 1 |
| 6 | 4 | 0 | 1 | 5 | 4 |
Table 4: Simple random samples and rank values.
Table 3 shows the procedure of selecting random values from our data of excel file. First we select SRS1 of size 3, take 3 values and rank them. Similarly we take another SRS 2 of size 3, take 3 values and rank them and so on. First we select a group of 12 simple random samples of size 3.
For unbalanced rank set sample it is not necessary to rank size should be equal or allocate equal number of values. We take random ranks and their corresponding values.
Pregnancy
| SRS 4 | Rank | SRS 5 | Rank | SRS 6 | Rank |
|---|---|---|---|---|---|
| 2 | 2 | 7 | 2 | 1 | 3 |
| 1 | 2 | 6 | 2 | 2 | 2 |
| 3 | 1 | 10 | 1 | 3 | 1 |
| 5 | 3 | 8 | 4 | 0 | 4 |
| SRS 7 | Rank | SRS 8 | Rank | SRS 9 | Rank |
| 2 | 3 | 8 | 1 | 2 | 3 |
| 5 | 2 | 0 | 2 | 8 | 1 |
| 6 | 1 | 8 | 1 | 6 | 1 |
| 9 | 3 | 3 | 4 | 0 | 2 |
Table 3: Simple random sample values, balanced rank set sample value and unbalanced rank set sample values.
Table 4 shows the simple random sample of size 12. We take 12 values from our population of variable pregnancy. From table 4.1 first we arrange balanced rank set sample of size 3. We select rank 1 values from SRS 1, rank 2 values from SRS 2 and rank 3 from SRS 3. Similarly then we take second round and take rank 1 value from SRS 4, rank 2 value from SRS 5 and rank 3 values from SRS 6 and so on till last.
In Figure 4 shows that the comparison between different sampling techniques like SRS, BRSS and UBRSS with sample of size 12 and different rank set size. In first cluster the sample size is 12 and rank set size is 4, the second cluster sample size is 12 and rank size is 9. In SRS the variance graph is small as compare to the other sampling method in all cluster. While the mean of BRSS and UBRSS are very close to each other as we change the rank set size.
| Pregnancy | ||||||
|---|---|---|---|---|---|---|
| Sample Rank Sizes | n=12,m=4 | n=12,m=9 | ||||
| Sampling Techniques | SRS | BRSS | UBRSS | SRS | BRSS | UBRSS |
| Mean | 2 | 3.33 | 3.83 | 2 | 4.083 | 3.75 |
| Median | 1.5 | 2 | 2 | 1.5 | 4 | 2.5 |
| Mode | 1 | 1 | 2 | 1 | 3 | 2 |
| Variance | 4.182 | 11.879 | 10.515 | 4.182 | 8.083 | 11.841 |
| Standard Error | 0.59 | 0.995 | 0.936 | 0.59 | 0.821 | 0.993 |
Table 5: shows the Comparison between Simple random sampling, Balanced rank set sampling and Unbalanced rank set Table 5: shows t
variance and standard error decreases. We suggest that unbalanced rank set sampling having less standard error of mean so the estimates of reliable in this technique so we unbalanced rank set sampling is better this situation.
| Pregnancy | |||||||||
|---|---|---|---|---|---|---|---|---|---|
| Sample and Rank Sizes | n=24,m=4 | n=24,m=9 | n=24,m=16 | ||||||
| Sampling Techniques | SRS | BRSS | UBRSS | SRS | BRSS | UBRSS | SRS | BRSS | UBRSS |
| Mean | 4 | 3.667 | 4.167 | 4 | 4.458 | 4.583 | 4 | 3 | 3.875 |
| Median | 3 | 2.5 | 3 | 3 | 3 | 4 | 3 | 2 | 2.5 |
| Mode | 2 | 0 | 3 | 2 | 3 | 3 | 2 | 2 | 1 |
| Variance | 12.174 | 11.371 | 10.876 | 12.174 | 11.216 | 10.516 | 12.174 | 13.478 | 12.027 |
| Standard Error | 0.712 | 0.7061 | 0.936 | 0.712 | 0.684 | 0.654 | 0.712 | 0.743 | 0.708 |
Table 6: Comparison between Simple random sampling, Balanced rank set sampling and Unbalanced rank set sampling Table 6: Comparis
sampling variance are higher than other two methods of sampling. We suggest that unbalanced rank set sampling having less standard error of mean so the estimates of reliable in this technique so we unbalanced rank set sampling is better this situation.
| Pregnancy | |||||||||
|---|---|---|---|---|---|---|---|---|---|
| Sample and Rank Sizes | n=48,m=4 | n=48,m=9 | n=48,m=16 | ||||||
| Sampling Techniques | SRS | BRSS | UBRSS | SRS | BRSS | UBRSS | SRS | BRSS | UBRSS |
| Mean | 3.75 | 3.229 | 3.771 | 3.75 | 3.373 | 3.813 | 3.75 | 3.833 | 3.792 |
| Median | 3 | 1.5 | 3 | 3 | 3 | 3 | 3 | 3 | 3 |
| Mode | 2 | 2 | 1 | 2 | 1 | 3 | 2 | 1 | 1 |
| Variance | 12.787 | 10.383 | 8.053 | 12.787 | 10.483 | 10.028 | 12.787 | 11.504 | 9.998 |
| Standard Error | 0.516 | 0.7061 | 0.41 | 0.516 | 0.467 | 0.457 | 0.516 | 0.49 | 0.456 |
Table 7: Comparison between Simple random sampling, Balanced rank set sampling and Unbalanced rank set sampling Table 7: Comparis
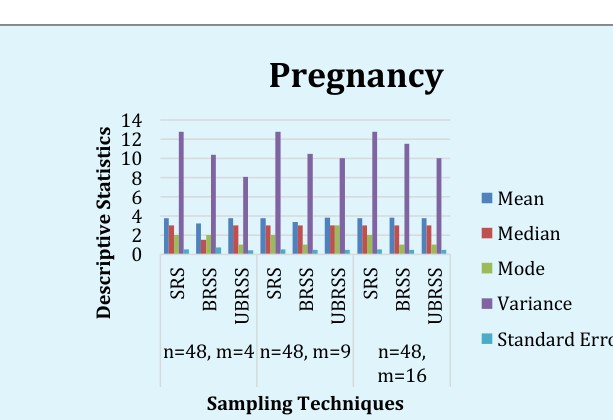
Table 7 shows the descriptive statistics for different sampling techniques and for different rank sizes but sample size are 48. When we have sample size is 48 and rank size is 4, the mean is 3.75, median is 3, mode 2, variance is 12.787 and standard error is 0.516. while the mean for balance rank set sampling is 3.229, median 1.5, mode 2, and standard error 0.7061 and mean for unbalance rank set sampling is 3.771, median 3, mode 1, variance 8.053 and standard error is 0.41.
Similarly when we change the size of rank the same descriptive are given in table 4.5. We conclude that as further we change the rank size the standard error will be smaller and smaller in unbalanced rank set sample size. As compare Table 5, Table 6 and Table 7 when we change the size of sample and rank set size the standard error for unbalance rank set sampling becomes smaller than other for pregnancy data. We also draw a bar graph which compare between these techniques.
Discussion & Conclusion
Previous literature has studies the theoretical properties of the relative precision for unbalanced rank set sampling compared to rank set sampling. This study investigates the application of unbalanced rank set sampling in medical sciences. We note that the improvement in precision from rank set sampling depends to a great extent on the accuracy in ranking. For a fixed sample allocation, more accurate rankings leads to better performance of the corresponding rank set sampling estimator. For a fixed sample size, there is a set of configurations of the sample allocations that leads to rank set sampling estimators outperforming their simple random sample counterparts. Serious imperfectness in rankings can shrink significantly this set of configurations and drive the optimal allocation to the balanced allocation.
In this study, we also propose three methods for obtaining estimates of the descriptive statistics in simple random sampling, balanced rank set sampling and unbalanced rank set sampling and compare these results. In unbalance rank set sampling the standard error of estimates of pregnancy and PG is smaller than the other two techniques for different sample sizes and rank set sizes. We also express these estimates with drawing bar graph and compare the sampling techniques.
In this article we also proposed methods for obtaining estimates of the probabilities of success for the judgment order statistics using unbalanced rankings. The results from the model-based and direct approaches will typically be similar when the fit of the logistic regression model in the training sample is compared to that in the population.
Our simulation results indicate that the unbalanced rank set sampling estimates 𝑝[𝑟]
′ 𝑠 may be sufficient in practice to guide the sample allocations. We note however, that these estimates reflect the probabilities of success for the judgment under unbalanced rank set sampling. If a non-representative training sample is used, the resulting success probabilities estimates may depart from the true 𝑝[𝑟]
′ 𝑠 for a particular ranking process. Finally we want to point out that the three approaches of sampling can be applied to more general settings such as estimation of the mean or variance for either continuous or categorical variables.
References
-
Mclntyre GA (1952) A method for unbiased selective sampling, using ranked sets. Australian Journal of Agricultural Research 3(4): 385-390.
-
Stokes SL, Sager TW (1988) Characterization of a ranked-set sample with application to estimating distribution functions. Journal of the American Statistical Association, 83(402): 374-381.
-
Cobby JM, Ridout MS, Bassett PJ, Large RV (1985) An investigation into the use of ranked set sampling on grass and grass-clover swards. Grass and Forage Science 40(3): 257-263.
-
Evans MJ (1967) Application of ranked set sampling to regeneration. Survey in areas direct-seeded to long leaf pine. Master Thesis, school for Forestry and Wild- life Management, Louisiana state University, Baton Rouge, Louisiana.
-
Takahasi K, Wakimoto K (1968) On unbiased estimates of the population mean based on the sample stratified by means of ordering. Annals of the Institute of Statistical Mathematics, 20(1): 1-31.
-
Ridout MS, Cobby JM (1987) Rank Set Sampling with Non-Random Selection of Sets and Errors in Ranking. Appl Statist 36(2): 145-152.
-
Patil GP, Sinha AK, Taillie C (1994) Ranked set sampling for multiple characteristics. International Journal of Ecology and Environmental Sciences 20: 94-10.
-
Norris RC, Patil GP, Sinha AK (1995) Estimation of multiple characteristics by ranked set sampling methods. Coenoses 10(2): 95-111.
-
Hettmansperger TP, Sheather SJ (1996) Confidence intervals based on interpolated order statistics. Statistics and Probability Letters 4(2): 75-79.
-
Kaur A, Patil GP, Taillie C (1997) Unequal allocation models for ranked set sampling with skew distributions. Biometrics 53(1): 123-130.
-
Barnett V (1999) Ranked set sample design for environmental investigations. Environmental and Ecological Statistics 6(1): 59-74.
-
Al-Saleh MF, Samawai H (2000) On the efficiency of Monte Carlo methods using steady state ranked simulated samples. Communications in Statistics- Simulation and Computation 29(3): 941-954.
-
Hossain SS (2001) Non-parametric selected ranked set sampling. Biometrical Journal 43(1): 97-105.
-
Chen H, Stasny EA, Wolfe DA (2003) Improved estimation of disease prevalence using ranked set sampling. Technical Report 718, Department of Statistics, The Ohio State University, USA.
-
Chen H, Stasny EA, Wolfe DA (2005) Ranked set sampling for efficient estimation of a population proportion. Statistics in Medicine 24(21): 3319-3329.
-
Koyuncu N (2018) Calibration estimator of population mean under stratified ranked set sampling design. Communications in Statistics-Theory and Methods 47(23): 5845-5853.
-
Shahzad U, Hanif M, Koyuncu N, Luengo AVG (2019) A regression type estimator for mean estimation under ranked set sampling alongside the sensitivity issue. Commun Fac Sci Univ Ank Ser A1 Math Stat 68(2): 2037-2049.
- Sense, Gravity, Parity & Chirality in Mathematical Physics
- Quantum Lattice Simulations PHYSICS: Microcircuit Particle Formation and Observable Macroscopic Irreversible Time - A Discrete Lagrangian with Cellular Automata Framework
- Quantum Biology from Biomacromolecule to Cell, and Central Dogma Described by Quantum Theory
- Focus, Agility, Speed and Technology (FAST) for Sustainability and Growth
- Square Root Metric Geometry and Pati-Salam Model in Curved Space-Time
- A Simple System Demonstrating the Mpemba Effect in Classical Mechanics