Quantiatative Determination of the Levels of BTEX in Soil and Groundwater in Oyigbo, Rivers State, Nigeria
Samples of soil and groundwater were collected and analyzed for BTEX contaminants with flame-ionization detector, HSGC- FID. In order to ascertain the quality of the groundwater, the results were compared with the United States Environmental Protection Agency and World Health Organization Drinking Water Standard for BTEX contaminants. The results showed that there were trace levels of BTEX in the groundwater. Benzene had the lowest mean concentration of 0.7 μg/L and p-xylene had the highest mean concentration of 116 μg/L. This could be traceable to the heavy petroleum activities in and around the town.
Introduction
Groundwater and soil are polluted when contaminants as a result of human activities and leakages in petroleum pipelines (petroleum spillages) are introduced into the natural environments. Water pollution is the leading worldwide cause of death and diseases due to water- borne diseases [1]. The main source of BTEX into the environment are the petroleum and chemical industries and other combustion processes. They are also released when natural materials are burnt. “BTEX is the term used to describe mixtures of benzene, toluene, ethyl benzene and xylene (ortho, meta and para xylene)” Normal environmental concentration of BTEX are unlikely to damage the environment, but higher concentrations resulting from a spillage are moderately toxic to aquatic Quantiatative Determination of the Levels of BTEX in Soil and Groundwater in Oyigbo, Rivers State, Nigeria life and humans if consumed in drinking water. The BTEX is one of the main groups of soluble organic compounds that find their way into our soil and ground water. The common sources for BTEX in ground water are spills involving the release of petroleum products such as gasoline, diesel fuel, lubricating and heating oil from leaking oil tanks and pipes which convey petroleum products. Due to polarity and solubility characteristics, BTEX (petroleum products) are able to enter the ground water system and cause pollution problems. BTEX also have some acute and long-term toxic effects. In addition to toxicity, benzene is known to be a carcinogen. Different BTEX compounds have varying contaminant characteristics (Table 1).
Phy Sci & Biophy J
| Chemical structure | ||||||
|---|---|---|---|---|---|---|
| Name | Benzene | Toluene | Ethylbenzenene | o-xylene | m-xylene | p-xylene |
| Chemical formula | C H 6 6 | C H 7 8 | C H 8 10 | C H 8 10 | C H 8 10 | C H 8 10 |
| Molecular weight (g/mole) | 78 | 92 | 106 | 106 | 106 | 106 |
| Water solubility (mg/L) | 1700 | 515 | - | 175 | 198 | 152 |
| V. pressure (at 20oC) (mmHg) | 95.2 | 28.4 | - | 6.6 | - | 9.5 |
| Specific Density(20oC) Octanol-water partition | 0.8787 | 0.8669 | 0.8642 | 0.8802 | 0.8610 | 0.8670 |
| Coefficient (at 20oC) (log K ) OW | 2.13 | 2.69 | 3.20 | 2.77 | 3.15 | 3.15 |
| Henry’s law (at 20oC) Kpa3/mole | 0.55 | 0.67 | 0.70 | 0.50 | 0.71 | 0.80 |
| Polarity | Non- polar | Non-polar | Non-polar | Non-polar | Non-polar | Non-polar |
| Biodegradability | Aerobic | Anaerobic/ aerobic | Aerobic | Aerobic | Aerobic | Aerobic |
| Maximum contaminant level (MCL) (mg/l) | 0.005 | 1.0 | 10 | 10 | 10 | 0.7 |
Table 1: Characteristics of BTEX components [1].
Experimental
Sample Collection
Soil samples, G and F were randomly collected around the gas flaring site in Oyigbo, River State, Nigeria very early in the morning. Amber glass jars (40 mL each), which had been dried in an oven, were used to collect the soil samples. The jar was gradually filled to the brim to avoid creating air spaces. Ground water samples were collected from boreholes serving the public. Samples A, B and C were randomly collected from wells around the gas- flaring zone, within distance of 1 km apart while samples D and E were collected randomly from wells serving the public around the densely populated area of the town. The tap was run very slowly to avoid air bubbles completely until the vial (containing 1 mL HCl as preservative) was filled to its brim. The vials were tightly capped with a plastic cork having a Teflon seal under Saucer TC, Boehm PD [2]. The control water sample H and soil sample I were collected from Ngugo in Ikeduru, Imo state (free of petroleum activity). Samples were kept in a fridge below room temperature.
Extraction of BTEX from Water Samples
BTEX were extracted by headspace extraction (static) technique using 99.99% super grade methanol. Water sample (5 mL) was put in a static headspace vial and the cap was sealed. After incubation at 80oC for 30 min which resulted to volatilization into the headspace. A gas-tight micro-syringe was used to retrieve 3 mL of the vapor, which was injected into the injection port of the Agilent 6890 N gas chromatography.
Extraction of BTEX from Soil Samples
For each soil sample, 5 g were extracted first by solvent extraction before static headspace extraction. Methanol (15 mL) was used to extract BTEX in a small vial; the layers were allowed to separate. An aliquot of the organic layer of the extract was transferred into a static headspace for extraction. This extract was subjected to the same method used in the water samples.
Preparation and Calibration of Standard BTEX
Five standard solution of BTEX (50, 100, 150, 200 and 250 µL of 0.2 mg/ml) were pipetted in separate 1 mL vials and volume was made up to 1 mL mark with 99.99% super grade methanol. The concentrations of the BTEX standards were 10, 20, 30, 40 and 50 mg/L respectively. An aliquot of the BTEX standard (1 µL) mix was injected into Agilent 6890 N gas chromatography for a five-level calibration. The concentration of each of the calibration levels was integrated and a correlation factor of the calibration was obtained. The minimum acceptable correlation factor was 0.90.
Analysis of the BTEX Extracts
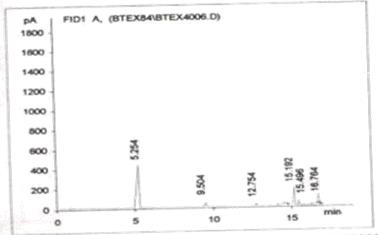
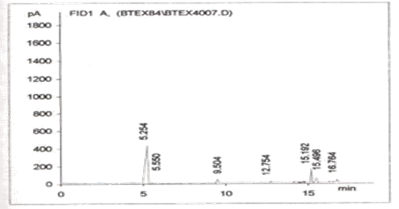
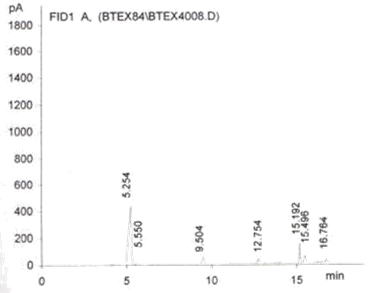
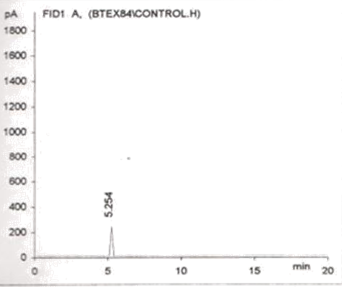
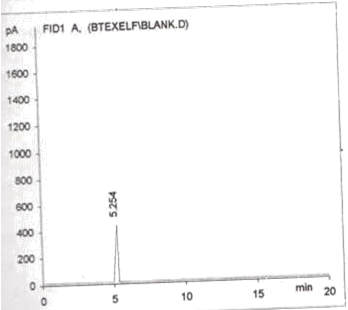
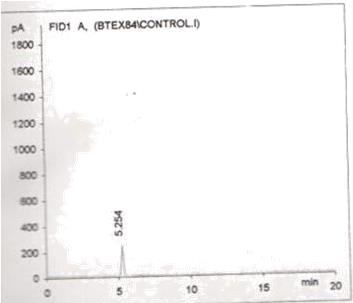
increased to 120oC at 10oC per minute. A gas microliter syringe was carefully inserted into the static headspace vial and aliquot of 3 µL of the BTEX vapour was injected into the gas chromatography using the operational conditions that were used for the calibration (standard). The number of peaks showed the number of compound present in the sample extract while the area of the peak was the measure of the concentrations. Quantification of compounds was based area of the analyte peak with that of the internal standards using enhanced digital electronic integrators.
- Results and Discussions
- Sample
- Benzene
- Toluene
- Ethyl benzene o-xylene p-xylene m-xylene
- A
- <1.000
- 2.578
- 1.356
- 1.968
- 14.165
- 1.318
- B
- 1.241
- 4.178
- 24.398
- <1.000
- 52.782
- 2.318
- C
- 2.432
- 3.011
- 52.456
- 1.437
- 13.861
- 1.279
- D
- <1.000
- 58.154
- 23.640
- 12.643
- 132.980
- 15.914
- E
- <1.000
- 17.493
- 1.010
- 16.670
- 366.744
- 72.325
- Total
- 3.673
- 85.413
- 102.863
- 32.717
- 580.532
- 93.155
- Average
- 0.735
- 17.083
- 20.573
- 6.543
- 116.106
- 18.631
- MCL
- 5.000
- 1000
- 700
- 10,000
- 10,000
- 10,000
Table 2: The cumulative of BTEX concentration in water in µg/L.
- Sample
- Benzene
- Toluene
- Ethyl benzene o-xylene p-xylene m-xylene
- F
- 21.347
- 16.722
- 528.649
- 24.891
- 353.728
- 16.492
- G
- 22.678
- 234.712
- 437.981
- 314.967
- 510.829
- 138.621
- Total
- 44.026
- 251.434
- 966.630
- 339.858
- 864.620
- 155.113
- Average
- 22.013
- 125.717
- 483.315
- 169.929
- 432.310
- 77.557
Table 3: The cumulative of BTEX concentration in soil in µg/L.
Benzene
The results of the tests on the soil as shown on the results of the chromatogram (Figures 1-7) showed that benzene was detected at a mean concentration of 22 µg/L. This amount is less to bring about a significant contamination of crops and vegetables growing in it. The assessments of human health risk due to exposure to the contamination of soil and ground water is limited due to insufficient data on volatile organic compounds (VOC) levels in the study area. soil contamination does not lead to significant levels of human exposure because of rapid volatilization of contaminants into the atmosphere.
Benzene in soil is usually from the direct contamination by spillage, gas flaring or leakage. It has been found at levels ranging from less than 2 to 191 µg/L in soil in the vicinity of five industrial facilities using or producing benzene in the U.S.A [3]. Benzene released to the soil can partition to the atmosphere through volatilization and to surface water through run-off, and to the ground water if released well below the surface. Evaporation from surface soil is expected to be rapid [4] with a KOW of 60 to 83 (the measure of benzene solubility in an octanol and water phase) benzene is considered fairly mobile in the soil. Leaching of benzene into ground water from soil is influenced by several parameters including soil type, amount of rainfall, depth of ground water and extent of benzene degradation [5]. Out of five boreholes surveyed in this research, benzene was found in two at a mean concentration of 0.735 µg/L. Benzene levels in ten (10) drinking water supplies in Canada did not exceed 1 µg/L. Based on a detection limit of 0.1 µg/L, benzene was found in 13, 3 and 2 out of 14 samples of treated water in summer, winter and spring respectively. Previous report had detectable (>1 µg/L) levels of benzene in 50 to 60% of samples taken, the mean concentration varying between 1 and 3 µg/L. In USA, water from contaminated wells contained 30 to 330 µg/L of benzene [6]. In the same area, most samples of drinking water taken from surface sources had non-detectable concentrations of benzene, and maximum levels of 4.4 µg/L were detected [7]. In Japan, a survey of 112 water samples revealed benzene in only 19 of the samples at levels varying from 0.03 to 2.1 µg/L [8]. Benzene is the most water-soluble fraction of the BTEX complex, it is also found to be in the highest concentration in petroleum contaminated water. The levels of benzene in the groundwater is of great concern. The US Environmental Protection Agency and World Health Organization have assigned benzene 5.0 µg/L for maximum contaminant level in drinking water. It is a potent carcinogen and the International Agency for Research on Cancer, IARC, refers to it as a non-threshold toxicant (i.e. a substance which has chances of adverse health effects at any level of exposure). The accumulation of benzene in the terrestrial and aquatic organism is not expected to be important. There are no reports to indicate bio-concentration in organisms nor is there any finding of bio magnification in the food chain [9].
Toluene
The results of the tests for toluene in the soil showed that toluene was present in all the soil samples at a mean concentration of 0.01 mg/L. There is a paucity of data on levels of toluene in the soil. The results of two laboratory experiments Roy WR, Griffin RA, Wilson JT, et al. [10, 11] showed that about 40 to 80% of toluene applied to the surface of a sandy soil at 0.9 and 0.2 mg/L respectively, volatized into the air. The volatilization rate is, for instance, dependent on the nature and organic content of the soil. Studies showed that toluene moved through sandy soil with low organic content. The transfer of toluene from soil to ground water is of importance with regard to the contamination of these sources of drinking water. In this very research, toluene was detected at a mean concentration of 0.017 mg/L in all the five water samples analyzed. Toluene has also been detected in the drinking water supplies of several communities. The average and maximum concentration of toluene in treated Canadian water were below 0.001 mg/L and 0.015 mg/L, respectively, with a frequency of 20% during the months of August and September. The corresponding values for the raw water were reported to be 0.002 mg/L and 0.027 mg/L respectively [9]. The concentration of toluene in water showed seasonal variation, the summer values being higher than that of winter. The presence of toluene in surface water in the USA has been monitored by the USEPA STORET systems [12]. Only 17% of all surface water monitored contained toluene at concentrations higher than 0.01 mg/L. Studies carried out in animals and humans exposed to toluene indicated that toluene had not been shown to cause cancer [13]. The US Environmental Protection Agency has approved 1.0 ppm as toluene maximum contaminant level in drinking water. The major route of human exposure is through inhalation. Toluene is readily absorbed from the respiratory tract, with an uptake of approximately 40 to 60% in human beings. Smaller amounts are rapidly absorbed via the skin and complete absorption occurs in the gastrointestinal tract, but at slower rate. However, the presence of small amounts of toluene in drinking water and food adds only minor quantities to man’s total daily intake. Acute adverse health effects from exposure to toluene include headache, confusion, and memory loss; depending on the concentration, duration and route of exposure. In the case of daily exposure to high concentrations for instance, under occupational conditions, significant uptake of toluene into lipid-rich tissues, such as adipose tissue at the Central Nervous System occurs.
Ethyl Benzene
Ethyl benzene was detected at a concentration level of 483 µg/L in the soil. It has been shown that ethyl benzene would have low mobility in water-saturated soil, based on the predicated KOW values of 3.15, which is the measure of its octanol-water partition co-efficient [11]. However, its soil-water partition co-efficient suggest that it is moderately absorbed by the soil and will probably leach through soil. Ethyl benzene was also detected in the blank infiltrated water, this suggest a probability of leaching through the soil [14]. Other factors influencing the movement of ethyl benzene through the soil to ground water include soil type, soil porosity, amount of rainfall, depth of ground water and extent of degradation. Ethyl benzene was present in all the ground water samples at a mean concentration of 21 µg/L. The US EPA has 700 ppb as the maximum contaminant level for ethyl benzene in drinking water. Ethyl benzene is an irritant of the skin and mucous membranes, and at high concentration, it depresses the central nervous system and discomforts the liver. Ethyl benzene levels in uncontaminated ground water are generally less than 0.1 µg/L. However, higher levels have been reported from groundwater contamination via waste disposal, fuel spillage and industrial facilities. At a solvent recovery facility, ethyl benzene concentrations of up to 28,000 µg/L were measured [15]. Ethyl benzene was found in 3 out of 466 groundwater samples collected in the USA in 1982. The maximum concentration was 1.1 µg/L and the detection limit was 0.5 µg/L [16]. It was found that ethyl benzene level in Canadian treated potable water ranged from less than 1 to 10 µg/L [6]. Ethyl benzene was detected in 8 out of 945 samples of finished (undefined) water from groundwater supplies. The levels ranged from 0.74 to 12 µg/L [17]. Ethyl benzene is found in air, water, soil, and groundwater. It is released primarily into the air and water from various natural and anthropogenic sources. It is rapidly photo-oxidized in the atmosphere and this may contribute to photochemical smog formation. In water it undergoes volatilization and degradation.
Xylene
In all the soil samples, the mean concentration of ortho-, para-, and meta-xylene were 170 µg/L, 432 µg/L and 78 µg/L respectively. Xylenes have relatively high vapour pressure and a moderate solubility in water. They volatilize quickly from surface and still water as well as from soil. Among all the three isomers of xylene, para- xylene is the most toxic due to the nature of its chemical structure. It seldom oxidizes in air, soil and water, given its persistence and appreciable concentration in them. The three isomers of xylene (ortho, para and meta) were detected at mean concentration of 7.0 µg/L, 120 µg/L and 17 µg/L respectively in the water sample. High levels of ortho-xylene (4001 µg/L) and meta/para-xylene (5385 µg/L) have been measured in a polluted aquifer in Italy. Water was taken from a well at a depth of 30 m and the pollution was thought to be due to leakage from underground solvent storage tanks [18]. Gasoline – contaminated groundwater in Los Angeles, USA, contained xylene at a concentration of 153 µg/L [7]. All three xylene isomers were detected in all 14 samples of United Kingdom drinking water derived from rivers, lowland reservoirs and groundwater [19]. A study of 30 Canadian potable water treatment facilities, showed a mean concentration of xylene in both raw and treated water to be less than the detection limit (1.0 µg/L) [6]. The concentration of meta- and para-xylene from tap water in Toronto Canada, was reported to be 0.06 µg/L [20]. Others were less than the detection limit of 0.07 µg/L. The USEPA maximum contaminant level for total xylene in drinking water is 10 ppm. Xylene vapour is an irritant of eyes, mucous membrane and skin; at high concentration it causes narcosis. High level of xylene exposure to pregnant women may be teratogenic and cause harmful effects to the foetus. Studies carried out with unborn animals indicate that high concentration of xylene may lead to increase in number of deaths, decreased weight, skeletal changes, and delayed skeletal development/ acute poisoning and death have been reported after exposure and oral ingestion of substantial amounts of xylene. The estimated exposure level for loss of consciousness is 10,000 ppm [21, 22].
Conclusion
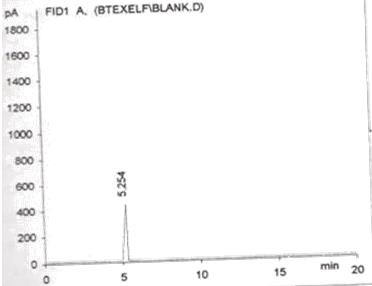
The results of this study show that benzene has the lowest mean concentration (0.7 µg/L) and p-xylene had the highest (116 µg/L). BTEX were not detected in the control samples (both soil and water) and in the blank sample, which showed that the presence of BTEX in the water samples from Oyigbo was due to the petroleum activities taking place in the town.
In summary, the levels of BTEX in groundwater and soil around gas flaring site at Oyigbo, Nigeria were studied. Our results show traceable amounts of BTEX in both areas under investigation with benzene and xylene having the lowest and highest mean concentration respectively. This is undoubtedly associated with the petroleum activities in the area.
References
-
Budavari S, O’Neil MJ, Smith A, Heckelman PE (1989) The Merck Index. 11th (Edn.), Merck and Co., Rahway, New Jersey.
-
Saucer TC, Boehm PD (1995) Hydrocarbon chemistry for analytical method for oil spill assessments. Marine spill response corporation technical report, Washington DC, pp: 114.
-
Karlson U, Frankenberger WT (1989) Microbial degradation of benzene and toluene in ground water. Bull Environ contain toxicol 43(4): 505-510.
-
Kan’ckhoff SW (1981) Semi-empirical estimation of sorption of hydrophobic pollutants on natural sediments and soil. Chemosphere 10(8): 833-846.
-
Otson R (1987) Purgeable organics in great lakes, raw and treated water. Int J Environ Anal Chem 31(1): 41- 53.
-
Oston R, William DT, Bothwell PD (1982) Volatile organic compounds in water treatment facilities. J Assoc of Anal Chem 54: 1370-1374.
-
Burnmaster DE (1982) The new pollution, groundwater contamination. Environment 24: 33-36.
-
Environment agency, Japan (1989) Chemicals in the environment. Reports on environmental survey and wildlife monitoring of chemicals in F.Y. 1986 and 1987 Tokyo Environmental Agency. Department of Environmental Health, Office of Health Studies.
-
Bloemen HJ (1993) Volatile Organic Compounds in the Environment. Blackie Academic & Professional, Glasgow, pp: 165-170.
-
Wilson JT, Enfields CG, Dunlap WJ, Crosby RL, Foster DA, et al. (1981) Transport and fate of selected organic pollutants in a sandy soil. J Environ Qual 10(4): 501-506.
-
Roy WR, Griffin RA (1985) Mobility of organic solvents in water saturated soil material. Environ Geol Water Sci 7(4): 241-247.
-
Environment Canada (1994) Canadian Environment Protection Act–Priority Substance list Assessment Report-Benzene. Government of Canada, Health and Welfare Canada, pp: 1-26.
-
US EPA (1980) Exposure assessment of priority pollutants: Toluene AD (Ed.) stonet water quality information system. Washington DC.
-
Verschueven K (1996) Handbook of Environmental Data on Organic Chemicals. 3rd (Edn.), Van Nostrand Reinhold company, New York, pp: 1722.
-
Howard PH (1989) Handbook of Environmental Fate and Exposure Data for Organic Chemicals. Vol 2, Lewis Publishers, Chelsea, Michigan, pp: 168-170.
-
Cline PV, Viste DR (1985) Migration and Degradation patterns of Volatile Organic compounds. Waste Manager Res 3(4): 351-360.
-
Cotruvo JA (1985) Organic macro pollutants in drinking water: An overview. Sci Total environ 47: 7- 26.
-
Wastrick JJ, Mello JW, Thomas RF (1984) The Groundwater Supply Survey. Water works assoc, 76: 52-59.
-
Botta D, Pirri LC, Mantica E (1994) Groundwater pollution by organic Solvents and their microbial degradation products. Analytical organic micro pollutants in water, Luxembourg Commission of the European Communities, pp: 261-275.
-
Fieldind M, Gibson TM, James HA, Mclonghlin K, Steel CP (1981) Organic micro pollutants in drinking water. Medinenham, Marlor, United Kingdom.
-
City of Toronto (1990) The quality of drinking water in Toronto: A review of tap water, bottle water and water treatment by point-of-use devise. Department of Public Health, Toronto, Canada.
-
Environmental Canada (1993) Canada Environment Protection. Act-Priority Substances List Assessment Report – Xylenes. Canada Communication Group Publishing, Ottawa, pp: 4-15.
- Sense, Gravity, Parity & Chirality in Mathematical Physics
- Quantum Lattice Simulations PHYSICS: Microcircuit Particle Formation and Observable Macroscopic Irreversible Time - A Discrete Lagrangian with Cellular Automata Framework
- Quantum Biology from Biomacromolecule to Cell, and Central Dogma Described by Quantum Theory
- Focus, Agility, Speed and Technology (FAST) for Sustainability and Growth
- Square Root Metric Geometry and Pati-Salam Model in Curved Space-Time
- A Simple System Demonstrating the Mpemba Effect in Classical Mechanics