Effect of Glucose on Thermal Stability of Myoglobin: A Biophysical and In silico Approach towards Stabilisation of Protein
The folding of protein into their compact three dimensional structures has enabled living organisms to develop astonishing diversity and selectivity in their underlying chemical processes generating biological activity, the trafficking of molecules to specific cellular locations and the regulation of cellular growth and differentiation. All these processes require long term stability of proteins and only correctly folded proteins possess this attribute. This study has investigated the effect of glucose on thermal stability of myoglobin. We monitored the heme protein interaction at 409 nm and polypeptide backbone at 222 nm. It seems that the glucose molecule is stabilizing protein heme interaction while destabilising overall peptide backbone.
Introduction
Self-assembly of the complicated components of molecular structures with great precision and fidelity is the most important attribute of all living systems. Proteins, the specific components of living systems are the most fundamental and universal example of biological self- assembly. The folding of proteins into their compact three dimensional structures has enabled living organisms to develop astonishing diversity and selectivity in their underlying chemical processes- generating biological activity, the trafficking of molecules to specific cellular locations and the regulation of cellular growth and differentiation. All these processes require long term stability of proteins and only correctly folded proteins posses this attribute. Proteins are marginally stable and their unique native conformation is easily disrupted and the polypeptide chain unfolds by unique native conformation is easily disrupted and the polypeptide chain unfolds by shifts in the physiological environmental conditions or by presence of certain solutes (denaturants) that extensively interact with the molecular groups of proteins [1]. Incorrectly folded proteins are the leading cause of protein imbalance in living systems; the misfolded protein may be sub optimally functional or non-functional, or the misfolding may expose epitopes which lead to dysfunctional interactions with other proteins, or it may be degraded by cellular machinery. Therefore, the process of protein folding is often referred to as protein folding problem [2]. A sequence of amino acids folds into its native functionally active form within 10-3 sec to 1 sec [3]. Indeed, the process of protein folding occurs when polypeptide chain on getting released from ribosomes enters the chaperones and gets released from there [4, 5]. A nascent polypeptide chain does not encounter all the possible conformations during a finite time [6] and folding within a cell is controlled by chaperones. It is considered that the protein folding process is similar in in-vivo as well as in dilute in-vitro condition, even if the two conditions are quite different [7, 8]. It has been shown that the unfolded polypeptide can transform into unique and biologically active three dimensional structures in the dilute solution and without any contribution of helper protein [9]. Thus, a polypeptide has the ability to fold into unique three dimensional structures which depends only on the sequence of amino acids and present at suitable pH, temperature and other environmental factors [9]. Anfinsen stated that protein folding is an energetically driven process where the native state has the minimum global free energy at that particular condition [9]. A common feature of a number of diseases is that they involve incorrectly folded forms of certain protein. These diseases are often grouped together under the heading-protein misfolding diseases. In recent years much has been learned and efforts are still on to unravel facts regarding the mechanism and driving force of protein aggregation [10], the protection of proteins from aggregation [11] and refolding proteins from aggregates [12] in recent years. However, the cellular environment is entirely different from the dilute buffer condition [13, 14, 15]. Various biomolecules such as nucleic acids, carbohydrates, proteins, ribosomes, etc., are present inside the cellular environment. Thus, we can say that the intracellular environment is highly crowded due to the presence of these molecules. The nucleic acids, proteins and ribosomes have evolved to function in a crowded environment [16]. It is estimated that the concentration of macromolecules in the cytoplasm is in the range of 80-400 mg ml-1 which accounts for 5-40% of the total cellular volume [13, 15, 17, 18]. Thermodynamic stability of a protein is related to its primary structure [19] yet the solvent environment plays crucial role for the formation of the specific 3-D structure and overall stability of the protein. The solvent environment basically includes various ions, salts, small molecular weight compound, and molecular and chemical chaperons. These solvent constituents are good targets to be used as pharmaceutical chaperones to remove protein aggregation by use of co-solvent engineering method. Therefore, understanding the effects of various co- solvents and manipulation of folding environment are keys to the success of pharmacological chaperones in rescuing misfolded proteins and removing aggregation.
Being naturally composed of many diverse monomeric units (i.e. the 20 natural amino acids and their derivatives) proteins are accepted hetero-polymers whose intricate conformational behaviour and interactions with their environment have been magnetizing the curiosity of researchers for many decades. Globular proteins have no systematic structures. There may be solitary chain, two or more chains which cooperate in the normal ways or there may be portions of the chains with helical structures, pleated structures, or entirely random structures. Globular proteins are comparatively spherical in shape as the name implies. Common globular proteins include myoglobin, egg albumin, haemoglobin, insulin, serum globulins in blood, and many enzymes.
We were interested in studying the effects of glucose osmolyte on myoglobin. Except for urea all the osmolytes stabilises proteins [20]. Osmolytes interact with both folded as well as unfolded proteins but more unfavourably with unfolded proteins [21, 22]. Various living organisms combat stress by accumulating various osmolytes which act as stress protectants [20, 23, 24, 25]. Osmolytes are compatible organic molecules which stabilises proteins and other cell organelles in vivo and in vitro and thus maintain the normal functioning of organism during stress [26, 27, 28]. Myoglobin encloses one polypeptide chain of 153 residues and a heme prosthetic group. In a hydrophobic cleft in the protein, where a heme group is bound, is a key to the function of myoglobin. It is the heme where oxygen binds. An organic ring known as protoporphyrin that surrounds an iron atom consisted by the heme. The iron is bound to 3 four nitrogen’s of the protoporphyrin, as well as to a histidine side-chain of myoglobin which holds the heme in the hydrophobic pocket. On the side of the heme plane opposite (distal) to the histidine, available for the binding of oxygen this leaves a sixth ligation position. Interactions with residues close to the oxygen binding site serve to stabilize bound oxygen, as well as interfere with CO binding the heme group is obscured in a hydrophobic pocket within the core of protein. This interface of the heme with a structural facet of the protein results a strong absorbance peak in the visible spectrum at 409 nm for myoglobin i.e., in the Soret band. A decrease in absorbance at 409 nm occurs owing to the exposure of heme to the polar aqueous solvent upon denaturation of myoglobin [29].
As well studied protein, myoglobin was chosen for a number of reasons. The description of protein is presented practically in all the foremost biochemistry text books in discussions of protein structure and function [30, 31]. Second, the protein is readily accessible for purchase from several sources. Third, for estimation purposes, a laboratory exercise determining the myoglobin stability by visible spectroscopy has been reported in this Journal [29].
The secondary and tertiary structural features of all myoglobins studied so far have similar structures. The single polypeptide chain of these proteins is arranged into eight helical regions which cooperatively form a hydrophobic pocket in which the heme prosthetic group is bound. The central heme iron atom is coordinated to four nitrogen atoms of the porphyrin ring, to a ring nitrogen atom of the proximal histidine residue at position 93, and to a sixth, negotiable ligand. The myoglobin in the met form, the heme iron atom has been oxidized and is in the Fe (IIӀ) state with the sixth ligand being formed by a tightly bound water molecule. This derivative of myoglobin cannot mingle with or transfer oxygen until the heme iron atom is trim down back to the normal Fe (II) state. Currently, considerable research effort is directed toward clarification of several mechanistic aspects of myoglobin function. In particular, these studies search out to determine the defined path of oxygen ingress and exit, to and from the heme group, and the influence of the surrounding protein medium on heme activity.
A discrete benefit of studying the unfolding of myoglobin (Mb has two intrinsic tryptophan residues) is that tryptophan (Trp) lifetime and fluorescence intensity are direct evidence of the local conformational distribution as Trp and heme constitute an effective intrinsic energy transfer pair [32]. The amino acid residues have been reported to specify quite a few point mutation studies, which are involved in the structural stability of myoglobins [33].
Myoglobin consists a single 153 residues polypeptide chain and a heme prosthetic group. The heme group is obscured in a hydrophobic pocket within core of the protein. The heme interaction with a structural attribute of the protein outcome in the Soret band, the visible spectrum at 409 nm for myoglobin, a strong absorbance peak. During denaturation of myoglobin, a decrease in absorbance at 409 nm took place owing to the contact of heme to the polar aqueous solvent [34]. This denaturation is simply and reproducibly measured in the teaching laboratory also by fluorescence spectroscopy [35].
One of the most well-studied protein, myoglobin for a long period had been serving as a model protein for the folding and unfolding of heme proteins. It is a petite, condensed globular protein having eight α-helices (A-H) and is composed of 153 amino acids cradling a heme prosthetic group with iron in centre encircled by a hydrophobic core [36].
It was shown that muscle damage produced by vigorous repeated exercise, will release Mb into circulation, where it will interact with the high concentration of glucose. Therefore, it is very important to verify the structural and functional alterations of Mb by glucose-protein interactions that will provide general information for the modification of heme proteins [37].
Materials
A commercial lyophilized preparation of myoglobin was purchased from Sigma Chemical Co. Guanidine hydrochloride (GdmCl) was ultrapure sample from Schwarz/Mann, Biotech. Cleveland, OH, (USA). Hydrochloric acid (HCl) and sodium hydroxide (NaOH) pellets were obtained from Qualigens Fine Chemicals and Merck (India) Ltd., respectively. Sodium salt of cacodylic acid was obtained from Sigma Chemical Co. Potassium chloride (KCl), sodium acetate (CH3COONa), sodium bicarbonate (NaHCO3) and ethylene diamine tetra acetic acid (EDTA) were obtained from Glaxo Laboratories, India. These and other chemicals, which were of analytical grade, were used without further purification.
Dialysis tubing (molecular weight cut off 6000-8000) were purchased from Spectrum Medical Industries Inc. Millipore filters (pore size 0.45 µm) were bought from Millipore Corporation and Whattman filter paper no. 1 was obtained from Whattman Laboratories, England. Parafilm used was procured from American National Co., Chicago.
Methods
Preparation of Protein Stock Solutions
Concentrated stock solution of myoglobin protein was prepared by dissolving 50 mg of protein in 10 ml of 0.1 M KCl. In order to remove other salts which might be present in the commercial preparation, all protein solutions were dialysed extensively against 0.1 M KCl at pH 7.0 at around 4°C. Protein stock solution was filtered using 0.45 µm Millipore filter paper. Concentration of the protein was determined experimentally using molar absorption coefficient (M-1cm-1) value of 171,000 at 409 nm for myoglobin.
Preparation of Glucose Stock Solution
The required amount of glucose was dissolved in the respective buffer. The pH of the solution was maintained to pH 7.0 and filtered through the whattman filter paper No.1 and stored at room temperature.
Preparation of Buffer
Cacodylic acid buffer: 0.05 M cacodylic acid buffer was prepared and its pH was adjusted to 7.0 by adding small amount of NaOH. The buffer was filtered through the Whattman filter paper No 1 and stored at 4 ºC for further use.
Preparation of GdmCl Stock Solution
Concentrated solution of GdmCl containing 0.1 M KCl was prepared. Refractive index measurements were made in the Abbe refractrometer after filtering the solution through Whattman filter paper no. 1. This was done in order to determine the concentration of the buffered stock solution of GdmCl using tabulated values of the solution refractive indices. The stock solution of GdmCl was stored at 4°C.
Absorbance Studies
Absorbance measurements were made in Jasco V-660 UV/Vis spectrophotometer equipped with peltier type temperature controller (ETC-505T). The spectra were recorded in the region 900-200 nm. Baseline correction was always carried out. Spectrum of the native protein was recorded against buffer and stored. Spectrum of the protein in the presence of the denaturant was recorded against the same concentration of the denaturant and stored. Difference spectra were obtained by subtracting the spectrum of the native protein from that of the protein in the presence of the denaturant.
**Determination of Thermal Stability of A Protein from Heat-Induced Transition Curves**
Heat induced denaturation of myoglobin was carried out from 20°C to 85°C in Jasco-660 spectrophotometer equipped with peltier temperature controller. A plot $A_{409}$ vs temperature was obtained. The raw data was converted into molar absorption coefficient using the relation
$$A = \varepsilon c l$$
where $A$ is the absorbance, $c$ is the molar concentration, $l$ is pathlength in cm and $\varepsilon$ is molar absorption coefficient.
Fraction of denaturation, $f_D$, at various temperature is obtained by the following formula
$$f_D = \frac{y - y_N}{yD - yN}$$
calculate $f_D$ in the range of 0.1 $\le f_D \le 0.9$ for each solution
$$y = f_D y_N + f_D y_D, \quad f_D + f_N = 1$$
$$f_D = 1 - f_D = \frac{y - y_N}{yD - yN}$$
$$N \leftrightarrow D$$
$$K_D = \frac{[D]}{[N]} = \frac{fD}{fN} = \frac{fD}{1 - fD} = \frac{y - y_N}{yD - y}$$
Plot $f_D$ vs Temp. was obtained.
Now $\Delta G_D$ was calculated using the following relation
$$\Delta G_D = -RT \ln K_D$$
$$\Delta G_D = -RT \ln \frac{y - y_N}{yD - y}$$
Now plot $\Delta G_D$ vs Temp. was obtained.
Slope of $\Delta G_D$ vs Temp is change in entropy, $\Delta S_m$, calculate change in enthalpy $\Delta H_m$, using Gibbs Helmholtz equation
$$\Delta G = \Delta H - T \Delta S$$
At $\Delta G = 0, T = T_m$
So, $\Delta H_m = T_m X \Delta S_m$
$T_m$ is a temperature where $\Delta G_D = 0$.
$$\Delta G_D H_{20} = \Delta H_m \left( \frac{T_m - T}{T} \right) - \Delta Cp \left\{ \left( T_m - T \right) + T \ln \left( \frac{T}{T_m} \right) \right\}$$
(6)
Where $T = 298.15$ K
Circular Dichroism: Circular dichroism were carried out to characterize secondary structure of the protein. Far $-UV$ CD studies were carried out in Jasco Spectropolarimeter (model j-715) equipped with peltier-type temperature controller and interfaced with personal computer. Cells of path length 0.1 cm used for far-UV CD. CD instrument was routinely calibrated with d-10 camphor sulphonic acid. Baseline correction was always carried with buffer in question and data stored. The spectrum of the native protein and protein in the glucose solution were stored and data acquisition was carried out using the J700 software provided by Jasco. The baseline of the buffer solution was subtracted from the native and baseline of glucose blank from protein with glucose solution respectively. At least 3 accumulations of the scanning were carried to average out the spectrum to improve upon signal to noise ratio in each case including the baseline. $N_2$ was flushed continuously through the machine at the rate of 5lit/min and higher below 200nm to minimize the noise level. CD data were reduced concentration independent parameter, $\left[ \theta_\lambda \right]$ (deg cm$^2$ dmol$^{-1}$) the mean residual ellipticity at the entire wavelength using the relation:
$$\left[ \theta_\lambda \right] = M^0 \theta_\lambda / 10lc$$
Where $\theta_\lambda$ is the observed ellipticity at wavelength $\lambda$, $M^\circ$ is mean residue weight of the protein, $c$ is the protein concentration in gm/cm$^3$ and $l$ is the path length of the cell in cm.
Computational Methods for Docking: Computational analysis of binding of glucose with myoglobin was carried out using AutoDock4 tool which is open software tool and maestro visualizer (schrodinger-version 10.6) software for docking and for 2D visualization interaction ligplot+, respectively. AutoDock4 is automated software tool, which mostly used in drug discovery. The protein data bank (PDB) repository was applied for fetching the crystal structure myoglobin which have protein identifier is (1YMB). Before docking we need some input file was prepared by using Chemdraw while MM2 force field for Modeling and minimizing the energy of geometry of glucose. The whole water molecules taken away from the PDB of intact protein. The size of grid box of myoglobin was 57 x 52 x 52 A°, with grid spacing is 0.351 A°. Using the Lamarckian genetic algorithm (LGA) to quest the optimal binding position of myoglobin and glucose were examined. After the execution of the AutoDock4 we have generated nine spatial orientation of glucose with different docking energy. Afterward, myoglobin-glucose complex were recognize as lower most binding energy is the best orientation with our receptor here is our receptor is myoglobin. Finally, the dock complex is finally visualize by either Pymol or Ligplot+.
Results
We know that the heme group is buried in a hydrophobic pocket within the protein’s interior in myoglobin. The interaction of heme with structural feature of the protein results in a strong absorbance peak in the visible spectrum at 409 nm. Myoglobin was denatured at 85 °C and thermal stability was measured in the absence and presence of glucose.
Effect of Glucose on the Tertiary Structure of Myoglobin
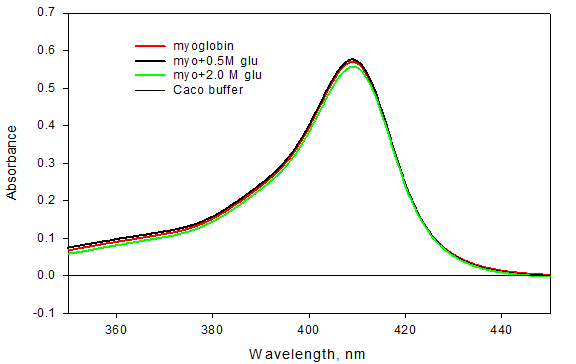
Absorption spectra of native myoglobin were taken in the absence and presence of different concentration of glucose. Figure 1 shows the absorption spectra of myoglobin in the absence and presence of different concentration of glucose at pH 7.0 and 25°C. It was observed that there is no significant change in the value of absorbance at 409 nm wavelength as we go on increasing the concentration of glucose. This result explains that glucose is not affecting the tertiary structure of myoglobin.
Absorption spectra of denatured myoglobin were also taken in the absence and presence of different concentrations of glucose. Figure 2 shows the absorption spectra of denatured myoglobin in the absence and presence of different concentration of glucose at pH 7.0 and 25°C.
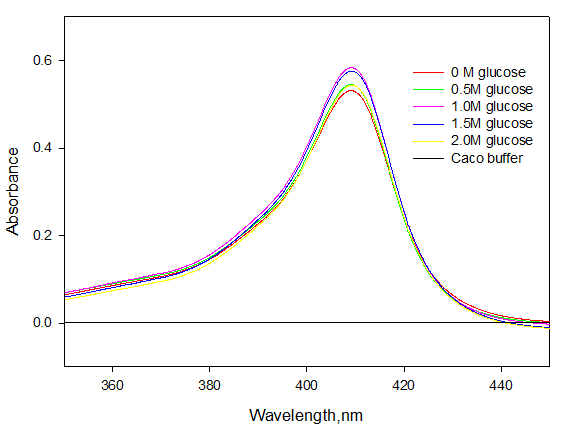
Figure 2 shows that there is no significant change in the value of absorbance at 409 nm wavelength as we go on increasing the concentration of glucose. This result explains that glucose is not affecting the tertiary structure of denatured myoglobin.
Effect of Glucose on the Secondary Structure of Myoglobin
To find out the effect of glucose on secondary structure of protein myoglobin, we have monitored the far-UV CD spectra of the native myoglobin in absence and presence of different concentration of glucose at pH 7.0.
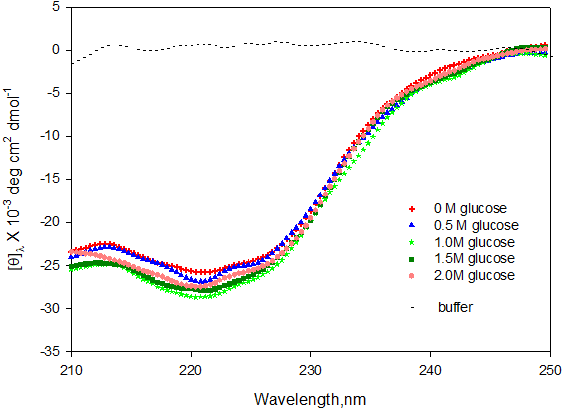
We know that unique CD absorption bands are observed depending on the type of protein secondary structure present within the protein molecule: either α-helical or β-strand type. Proteins such as myoglobin that have a high percentage of α-helical secondary structure will show a strong CD absorbance minimum at 208 nm and 222 nm. Figure 3 shows the far-UV CD spectra of myoglobin in the presence of 0 M, 0.5 M, 1.0 M, 1.5 M and 2.0 M glucose.
It was observed that there is almost no significant change in the value of mean residual ellipticity at different concentration of glucose. We can thus conclude that glucose is not affecting the secondary structure of native myoglobin.
Thermal Denaturation Studies of Myoglobin in Absence and Presence of Different Concentration of Glucose Using Absorption Spectroscopy
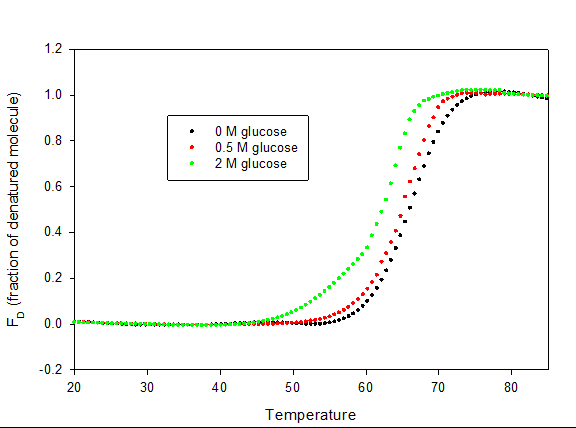
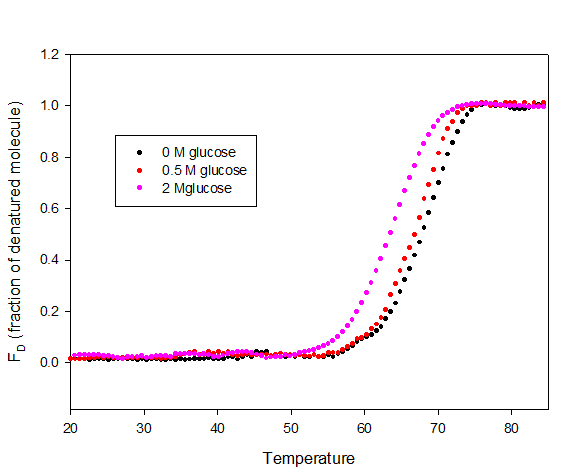
Heat-induced denaturation of myoglobin was carried out in absence and presence of glucose at pH 7.0 by following changes in molar absorption coefficient (M-1 cm-1) at 409 nm. Figure 4 shows plot of fraction of denatured molecule, _f_D as a function of temperature in the absence and presence of glucose at pH 7.0. Denaturation at this pH was reversible in the entire range of glucose.
Each transition curves, in the absence and at different concentration of glucose was analyzed for ∆_H_m and _T_m using Origin Pro software. Values of ∆_H_m and _T_m are given in Table 1. It is seen in this table that _T_m as well as ∆_H_m decreases with increase in glucose concentration. ∆_G_D° is calculated according to equation 6. All the thermodynamic parameters in the absence and presence of different concentrations of glucose are given in Table 1.
| Glucose, M | Tm (°C) | ∆Hm (kcal mol-1) | ∆CP (kcal mol-1 K-1) | ∆GD° (kcal mol-1) |
|---|---|---|---|---|
| 0 M | 81.5 ± 0.4 | 110 ± 0.6 | 1.5 | 11.02 ± 0.11 |
| (81.6 ± 0.3)* | (112 ± 0.5)* | (1.5)* | (10.98 ± 0.10)* | |
| 0.5 M | 80.7 ± 0.4 | 107± 0.4 | 1.5 | 10.68 ± 0.08 |
| (80.6 ± 0.2)* | (108 ± 0.4)* | (1.5)* | (10.64 ± 0.07)* | |
| 2.0 M | 78.3 ± 0.2 | 100 ± 0.3 | 1.5 | 8.10 ± 0.04 |
| (78.2 ± 0.3)* | (99 ± 0.4)* | (1.5)* | (8.13 ± 0.05)* |
Table 1: Thermodynamic parameters of myoglobin in the absence and presence of different concentrations of glucose at pH 7.0 using
Thermal Denaturation Studies of Myoglobin in the Presence of Glucose Using Circular Dichroism
Heat-induced denaturation of myoglobin were carried out in absence and presence of glucose at pH 7.0 by following changes in mean residual ellipticity at 222 nm, as a function of temperature. Figure 5 shows the representative denaturation curves of myoglobin in the absence and presence of glucose at pH 7.0. Denaturation at this pH was reversible in the entire range of glucose.
Each transition curves, in the absence and presence of glucose was analyzed for ∆_H_m and _T_m using Origin Pro software. Values of ∆Hm and Tm are given in Table 1. It is seen in these tables that Tm as well as ∆_H_m decrease with increasing concentration ofglucose. ∆_G_D° is calculated according to equation 6. All the thermodynamic parameters in the absence and presence of different concentrations of glucose are given in table 1.
Investigating the Molecular Docking: Molecular docking often is organized for an enhanced understanding of protein ligand interactions. Myoglobin–glucose interaction was carried out by out using AutoDock4 software. Glucose was docked to myoglobin for the detailed investigation of interaction between glucose and myoglobin at atomic level, the computational analysis shows the binding interaction between glucose and myoglobin is Compound glucose-open was subjected to docking analysis, it presented a binding affinity value of -4.1 Kcal mol-1 and a pKi value of 3.01 towards the receptor 1ymb.
It also possesses a ligand efficiency of 0.273 kcal mol-
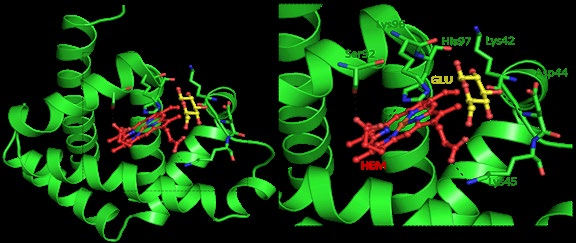
1 non-H atom-1. Glucose was docked to myoglobin for the detailed investigation of interaction between glucose and myoglobin at atomic level, which is represented in Figures 6 & 7.
Table 2 lists the final specifics of intermolecular energy, the hydrogen bond, overall amount of internal energy, types of binding energies and amino acid interactions in docking processed glucose–myoglobin complexes.
| Name of the ligand | Binding Free Energy (kcal/ mol) | pKi | Ligand Efficiency (kcal/mol/non-H atom) | Torsional Energy |
|---|---|---|---|---|
| Glucose | -4.1 | 3.01 | 0.273 | 1.8678 |
Table 2: Various parameters like intermolecular energy, the hydrogen bond, overall amount of internal energy, types of binding en
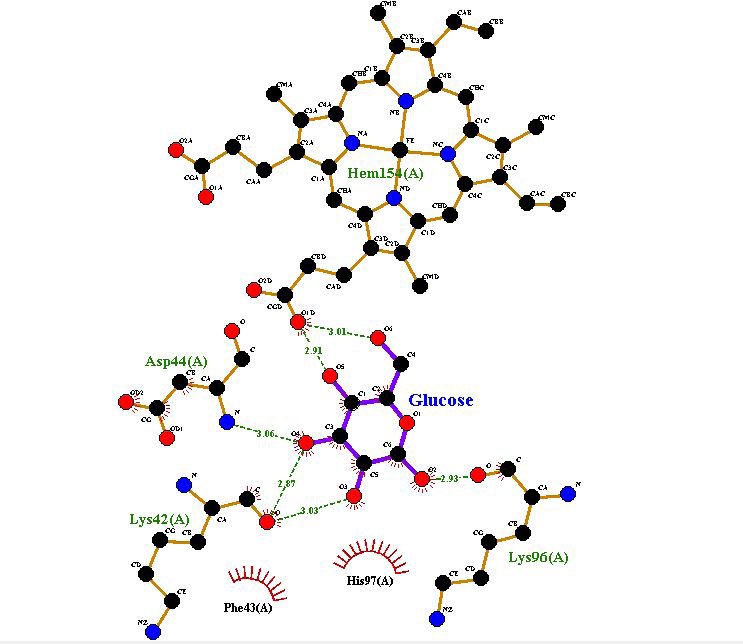
Figure 6 depicted the interaction mode, H-bond and hydrophobic interactions of ligand glucose and myoglobin. Based on Figure 6, Lys 42 and 96, Asp 44 and Heme group had interaction with myoglobin by H-bond. Besides, Phe 43, His 97 hydrophobically interacted with protein (Figure 7). It also shows that The docking results studies showed that myoglobin interacts with the heme and Lys 42 via two hydrogen bonds and with Lys 96 and Asp 44 via single hydrogen bond.
Discussion
Effect of Glucose on the Structure and Stability of Myoglobin
Protein stability is defined as the decrease in Gibb’s free energy of a structure less polypeptide chain when it folds to give a native protein molecule in water/buffer. The stability of these intricate structures in solution is usually measured by their resistance to denaturation in the presence of either heat or chemical denaturants. Heat-induced transition curves of myoglobin were monitored by following change in Δε409 or [θ]222 values in the presence of various concentrations of glucose at pH 7.0 and 25°C. These curves were used to estimate the value of ∆_G_D in the range -1.3<∆_G_D, kcal/mol<1.3 as a function of temperature. All denaturation curves were measured at least in triplicate. Each data is equal to the average of all measurements.
We monitor heme protein interaction at 409 nm and polypeptide backbone at 222 nm. It seems that the glucose molecule is destabilizing protein heme interaction as well as destabilising overall peptide backbone. Stability of the protein reduced from 11.02 kcal mol-1 to 8.10 kcal mol-1 by glucose molecule. Although, there was no change in secondary structural as observed by CD and UV-vis spectroscopy, molecular docking suggests that one may not completely ignore soft interactions. The interaction between heme group of myoglobin and glucose destabilises the protein and the thermal stability is reduced.
One of the study on myoglobin shows that glucose perturbs the stability of myoglobin which results in increase of its function. They have shown that myoglobin becomes more active in activating H2O2 at high concentration of glucose, due to modification of the heme active site which is expected due to increase in the distance of distal His64 to heme iron center. Various studies have also shown that binding of glucose can also affect other myoglobin function e.g. oxygen binding capacity and nitrite reductase activity, which are directly related to the microenvironment and conformation of active heme site. Few years back people have studied the effect of fructose, which is a structural isomer of glucose, on myoglobin. They found that fructose alters metmyoglobin to oxymyoglobin (oxygen-myoglobin complex) which indicates that the interaction of protein to sugar changes the binding property of myoglobin. Lin, et al. have shown that metal ions along with distal histidine residue are responsible for the regulation of nitrite reductase activity of myoglobin, which implies that monosaccharide affect the function of myoglobin. In another report it was shown that the crowder- induced structural change of V1sE also enhances the function of V1sE. Relating the above fact, we can predict that the structure change of myoglobin in crowded environment might also enhance the function of myoglobin. In order to provide an atomic view of glucose-myoglobin interactions, we performed molecular docking of myoglobin in the presence of gluocose. Moreover, we performed spectroscopy study of myoglobin in order to reveal the structural alteration of myoglobin by glucose-myoglobin interaction. The simulation in combination with spectroscopic study provides general information for gluocse-heme myoglobin interaction.
Previously it was thought that volume exclusion arises from steric repulsion among protein and crowder. One of the report shows that lysozyme is able to alter the environment of heme while small molecules such as sucrose, glucose and ethylene glycol showed no effect on the heme environment. Altogether these facts prove that in addition to volume exclusion (which depends on the size and shape) additional factor such as interaction of crowder with the protein plays very important role. On the other hand, the effect of lysozyme on the stability of myoglobin provides information on how the interaction of lysozyme with myoglobin is different with the interaction of myoglobin with BSA. Kundu, et al. reported that BSA (pI - 4.7) does not affect the native structure of myoglobin (pI - 7.1) but lysozyme (pI – 11.2) greatly affects the heme environment. They suggested that BSA interacts with myoglobin mainly through hydrophobic interaction while in case of lysozyme and myoglobin the electrostatic interaction dominates.
We should put emphasis on the point that since glucose disrupts the stability of myoglobin by disrupting the heme polypeptide interaction, which in turn might be responsible for the reduction in its stability.
References
-
Zav’yalov VP, Troitsky GV, Khechinashvili NN, Privalov PL (1977) Thermally induced conformational transitions of Bence-Jones protein IVA and its proteolytic fragments. Biochim Biophys Acta 492(1): 102-111.
-
Creighton TE (1990) Protein folding. Biochemical Journal 270(1): 1-16.
-
Creighton TE (1993) Proteins: Structure and molecular properties. 2nd (Edn.), New York, pp: 244-249.
-
Ellis RJ (1994) Roles of molecular chaperones in protein folding. Current Opinion in Structural Biology 4(1): 117- 122.
-
Weissman JS, Rye HS, Fenton WA, Beechem JM, Horwich AL (1996) Characterization of the Active Intermediate of a GroEL–GroES-Mediated Protein Folding Reaction. Cell 84: 481-90.
-
Levinthal C (1968) Are there pathways for protein folding? J Chim Phys 65: 44-45.
-
Doig AJ, Williams DH (1991) Is the hydrophobic effect stabilizing or destabilizing in proteins?: The contribution of disulphide bonds to protein stability. Journal of Molecular Biology 217(2): 389-398.
-
Cooper A, Eyles SJ, Radford SE, Dobson CM (1992) Thermodynamic consequences of the removal of a disulphide bridge from hen lysozyme. J Mol Biol 225(4): 939-943.
-
Anfinsen CB (1973) Principles that Govern the Folding of Protein Chains. Science 181(4096): 223-230.
-
Dong SS, Du KJ, You Y, Liu F, Wen GB, et al. (2013) Peroxidase-like activity of L29H myoglobin with two cooperative distal histidines on electrode using O2 as an oxidant. Journal of Electroanalytical Chemistry 708: 1-6.
-
Meng FG, Hong YK, He HW, Lyubarev AE, Kurganov BI, et al. (2004) Osmophobic Effect of Glycerol on Irreversible Thermal Denaturation of Rabbit Creatine Kinase. Biophysical journal 87: 2247-2254.
-
Gramer MJ, Maas J, Lieberman MM (2003) Use of hollow fiber systems for rapid and direct scale up of antibody production from hybridoma cell lines cultured in CL- 1000 flasks using BD Cell MAb medium. Cytotechnology 42: 155-162.
-
Fulton AB (1982) How crowded is the cytoplasm? Cell 30(2): 345-347.
-
Minton AP (1983) The effect of volume occupancy upon the thermodynamic activity of proteins: some biochemical consequences. Mol Cell Biochem 55: 119- 140.
-
Zimmerman SB, Trach SO (1991) Estimation of macromolecule concentrations and excluded volume effects for the cytoplasm of Escherichia coli. J Mol Biol 222(3): 599-620.
-
Medalia O, Weber I, Frangakis AS, Nicastro D, Gerisch G, et al. (2002) Macromolecular architecture in eukaryotic cells visualized by cryoelectron tomography. Science 298(5596): 1209-1213.
-
Ellis RJ, Minton AP (2003) Cell biology: join the crowd: Nature 425(6953): 27-28.
-
Rivas G, Ferrone F, Herzfeld J (2004) Life in a crowded world. EMBO Repo 5(1): 23-27.
-
Furie B, Eastlake A, Schechter AN, Anfinsen CB (1973) The interaction of the lanthanide ions with staphylococcal nuclease. J Biol Chem 248(16): 2821-2825.
-
Yancey PH, Clark ME, Hand SC, Bowlus RD, Somero GN (1982) Living with water stress: evolution of osmolyte systems. Science 217: 1214-1222.
-
Timasheff SN (1993) The Control of Protein Stability and Association by Weak Interactions with Water: How Do Solvents Affect These Processes?. Annual Review of Biophysics and Biomolecular Structure 22: 67-97.
-
Bolen DW, Baskakov IV (2001) The osmophobic effect: natural selection of a thermodynamic force in protein folding. Journal of Molecular Biology 310(5): 955-963.
-
Jaenicke R (1991) Protein stability and molecular adaptation to extreme conditons. European Journal of Biochemistry 202(3): 715-728.
-
Welsh DT (2000) Ecological significance of compatible solute accumulation by micro-organisms: from single cells to global climate. FEMS Microbiology Reviews 24(3): 263-290.
-
Krasensky J, Jonak C (2012) Drought, salt, and temperature stress-induced metabolic rearrangements and regulatory networks. Journal of Experimental Botany 63(4): 1593-1608.
-
Yancey PH (2005) Organic osmolytes as compatible, metabolic and counteracting cytoprotectants in high osmolarity and other stresses. Journal of Experimental Biology 208: 2819-2830.
-
Burg MB, Ferraris JD (2008) Intracellular Organic Osmolytes: Function and Regulation. The Journal of biological chemistry 283(12): 7309-7313.
-
Davis-Searles P, Saunders A, Erie D, Winzor D, Pielak G (2001) Interpreting the effects of small uncharged solutes on protein-folding equilibria. Annu Rev Biophys Biomol Struct 30: 271-306.
-
Sykes PA, Shiue H-C, Walker JR, Bateman Jr RC (1999) Determination of Myoglobin Stability by Visible Spectroscopy. J Chem Educ 76(9): 1283.
-
Boyle J (2005) Lehninger principles of biochemistry. In: Nelson D, Cox M, Biochemistry and Molecular Biology Education 33(1): 74-75.
-
Voet D, Voet JG, Pratt CW (1999) Fundamentals of biochemistry: Life at the Molecular Level. 5th(Edn.), Biochemistry (Chemical Biology). Willey online library, pp: 1184.
-
Stevens JA, Link JJ, Kao YT, Zang C, Wang L, et al. (2010) Ultrafast Dynamics of Resonance Energy Transfer in Myoglobin: Probing Local Conformation Fluctuations. J Phys Chem B 114(3): 1498-1505.
-
Luo Y, Kay MS, Baldwin RL (1997) Cooperativity of folding of the apomyoglobin pH 4 intermediate studied by glycine and proline mutations. Nature Structural & Molecular Biology 4: 925-930.
-
Schechter AN, Epstein CJ (1968) Spectral studies on the denaturation of myoglobin. J Mol Biol 35(3): 567-589.
-
Jones CM (1997) An Introduction to Research in Protein Folding for Undergraduates. J Chem Educ 74(11): 1306.
-
Kendrew JC, Bodo G, Dintzis HM, Parrish RG, Wyckoff H, et al. (1958) A three-dimensional model of the myoglobin molecule obtained by x-ray analysis. Nature 181: 662-666.
-
You Y, Liu F, Du KJ, Wen GB, Lin YW (2014) Structural and functional alterations of myoglobin by glucose-protein interactions. Journal of Molecular Modeling 20(7): 2358.
- Sense, Gravity, Parity & Chirality in Mathematical Physics
- Quantum Lattice Simulations PHYSICS: Microcircuit Particle Formation and Observable Macroscopic Irreversible Time - A Discrete Lagrangian with Cellular Automata Framework
- Quantum Biology from Biomacromolecule to Cell, and Central Dogma Described by Quantum Theory
- Focus, Agility, Speed and Technology (FAST) for Sustainability and Growth
- Square Root Metric Geometry and Pati-Salam Model in Curved Space-Time
- A Simple System Demonstrating the Mpemba Effect in Classical Mechanics