Evidence of an Adaptive Force on Rs9310709 due to Average Environmental Temperature
A biophysical formulation that defines genomic potentials from the frequencies of allelic variants (SNPs) in homeostatic populations is utilized to examine potential correlations with quantified ancestral environmental parameters. Mathematical functions were autonomously fitted to blindly search for any significant correlation between these potentials and the environmental parameters, and the rate of change in any flagged genomic potential due to environmental migration (i.e., between populations) was determined. In this sense, we quantify the outcomes of the genomic optimization due to the human experiment of migratory adaptation. Out of over a hundred SNPs (mostly associated with autoimmune responses) as well as over twenty environmental parameters, the rs9310709 variant only flagged with average temperature. This demonstrates a quantifiable “adaptive force†that favors decreased conservation of the C (risk) allele in geographical regions with increasing average air temperature.
Introduction
The human genome is a living system that communicates information necessary to optimize survival and the overall health of a population. Over generations, the distribution of allelic variants changes as a mechanism of adaptation of the population as a whole. From the health perspective of individuals, this sometimes results in the maintenance of inherited alleles that seem non-advantageous to the individual (e.g., sickle cell disease, etc.) yet optimizes population health. Understanding the adaptive reasoning that results in these genomic distributions can provide academic insight which has the potential to suggest therapies for individual health outcomes through the examination of whole genome response to environmental stimuli.
Typical genome wide association studies (GWAS) examine clusters related to specific diseases (in individuals) in order to develop purely mathematical correlations. Our approach establishes physical units for dimensional analysis that can be used to compare the population’s genomic response to the various environmental stressors. Establishing a universal “genomic forcing unit” allows meaningful relationships of the relative affect of quantified environmental stimuli to be developed. In addition, our approach focuses on natural selection towards overall population health, and as such does not label variants as associated with disease specifically. Thus, the environment of residence for a population in homeostasis can be considered as the causal agent of the population’s genomic distribution.
Genodynamics is an area in biological physics where physical concepts are used to analyze and explain adaptive outcomes in a settled population. The formulation describes the dynamics of the change in the allelic frequencies of the various genomic variants amongst populations that have reached genomic homeostasis with their ancestral environments. This dynamics is quantified in terms of a universal genomic energy unit (GEU) specifying that a bi- allelic non-linked single nucleotide polymorphism (SNP) with maximum variation (i.e. the occurrence probability is 50% for each allele) be assigned an allelic potential of 1 GEU [1]. The adaptive force due to variance in an environmental parameter is chosen to be in the direction that lowers the allelic potential according to , a fa µ $$ = - \frac {\partial \mu}{\partial \lambda} $$ (1) λ where a µ is the allelic potential measured in genomic energy units (GEUs), and λ quantifies the environmental parameter. A positive adaptive force drives populations toward more conservation of the allele, in the analogous manner that a gravitational force drives a mass down the gradient towards lower potential energy. Whatever the sign of the adaptive force, the genomic distribution always optimizes the overall survivability of the population [2].
Material and Methods
Genomic variation in a population maintains a particular degree of order when the population is in homeostasis. Maintained order can be expressed in terms of the degree of disorder (i.e. entropy (S)) relative to the maximum degree of disorder (Smax). Entropy for a non-linked bi-allelic SNP can be expressed in terms of probabilities (frequencies) of occurrences of each of the alleles.
$$ S ^ {(H)} = - \sum_ {h} ^ {2 ^ {n} (H)} P _ {h} ^ {(H)} \log_ {2} P _ {h} ^ {(H)} \tag {2} $$ where ( ) H S is the measure of haploblock entropy, ( ) H n is the number of SNPs locations in a haploblock (H), and ( ) H Ph is the probability of haplotype h in the population. The entropy of several SNPs can be determined through simple addition. Homeostasis of a population requires the minimization of the genomic free energy ( ) H F SdT dN h h E h µ ∑ = − + , where h represents a general haplotype that can include linked SNPs. In this equation, TE is a state variable that represents the environmental potential (i.e. the analog of the temperature in equilibrium thermodynamics) that quantifies the overall agitation of the whole genome. It is defined in terms of the maintained order of the whole genome.
For generally linked SNPs in a haploblock (H), the allelic potential of the haplotype (h) is given by:
$$ \mu_ {h} ^ {(H)} = \left(\check {\mu} - T _ {E}\right) n ^ {(H)} - T _ {E} \log_ {2} P _ {h} ^ {(H)} \tag {3} $$ where µ( = 1 GEU. For non-linked SNPs,
$$ n ^ {(H)} = 1. $$ The populations chosen from the original HapMap
project for our study were genotyped in their ancestral
environments. The genomic data in this research came from
phase 3 HapMap data including Han Chinese in Beijing China
$$ \begin{array}{l} \text {(C H B)} \text {w i t h} T _ {E} = 1. 1 0 8, \\ T _ {E} = 1. 1 0 8. \mathrm {L u h v a} \mathrm {i n} W \\ \end{array} $$
, Japanese in Tokyo Japan (JPT) with
1.108 E T =
, Luhya in Webuye Kenya (LWK) with
1.22 E T = ,
Toscani in Italia (TSI) with
$$ \begin{array}{l} T _ {E} = 1. 1 2, \\ 1 9. \mathrm {W e c h o}. \\ \end{array} $$
, and Yoruba in Ibadan
Nigeria (YRI) with
1.19 E T =
. We chose the oldest available
environmental data that has not significantly changed
since ancestral times. These include altitude, climatologic
variables, UV-B, and parasites, which were quantified, and
generally yearly averages were utilized.
The environmental data were collected from various cities chosen based on the ancestral regions to best identify the environmental parameters that have affected the genomic distribution of the selected populations. Locations that were used to represent the populations are shown in Table 1.
| Population | Cities |
|---|---|
| CHB | Beijing, Tianjin, Shanghai, Wuhan, Chengdu |
| JPT | Tokyo, Osaka, Sapporo, Fukuoka |
| TSI | Florence, Livorno, Grosseto |
| LWK | Webuye, Busia, Kakamega |
| YRI | Lagos, Ibadan, Ilorin, Save |
Table 1: The selected cities for the populations.
In this study, we attempted to use the oldest available data for most of the environmental parameters. Several codes were developed to flag relationships between ancestral environmental data and the potentials. Quantified relationships between all environmental data and allelic potentials were examined, and only those relationships with relative root mean square deviation ∆ less than or RMS µ max equal to 5%.
Results
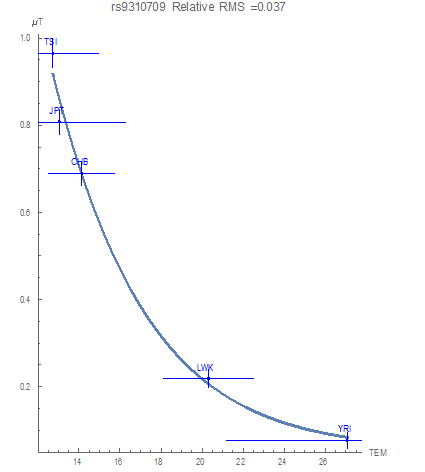
In the results that follow, the y-axes will represent the values of allelic potentials for the populations, while the x-axes will represent values of environmental parameters associated with those populations. As previously mentioned, lower potential values are associated with greater conservation.
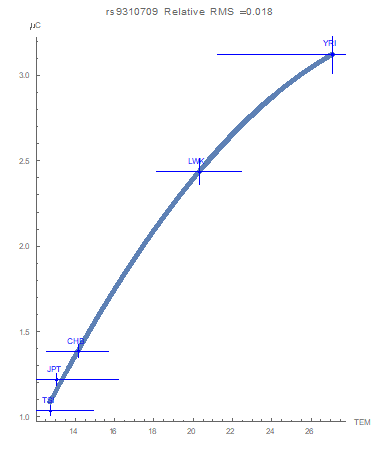
rs9310709 Relative RMS 0.018
rs9310709
| C |
The SNP rs9310709 on chromosome three only flagged a relationship with average environmental temperature, with a very small RMS degree of fluctuation equal to 0.018, as demonstrated in Figure 1. The plot illustrates a mathematical functional association between the SNP potential and the average environmental temperature in degrees Celsius (°C) for the five populations. According to the graph, the maximum variation of the SNP was found in populations living in areas with the lowest temperatures (i.e. the SNP becomes more conserved with increasing temperature). The result suggests this temperature dependency of the rs9310709 variation as an adaptive pressure.
Similarly, a flagged functional relationship between the T allelic potentials and the average temperature values is demonstrated in Figure 2. As the environmental temperature increases, the T allele is driven toward more conservation. Furthermore, a flagged functional relationship for decreased conservation of the C allele with increasing temperature was found (Figure 3). At the lowest temperatures examined neither allele is favored (as quantified through the equal values of all allelic potentials at 1 GEU).
It is important to note that rs9310709 is not in linkage disequilibrium with other SNPs in the five HapMap populations. Thus, rs9310709 seems to have a simple biological dependency on average temperature that is not linked to another genomic polymorphism.
Discussion
In this paper, we explored the variations of the genomic distributions of ancestral HapMap populations induced by environmental stresses utilizing biophysical equations. Using this approach, the populations are considered as statistical ensembles in which the genomic free energies are minimized due to the genome-environment interactions so as to optimize the overall health of the population as a whole. The SNP distribution of the entire genome that has resulted from long term environmental agitation determines the information content of the whole genome. As such, direct experimentation on human populations to establish causation of the genomic distribution cannot be done.
The probability of occurrence of an allele in a polymorphism provides the basis to develop allelic potentials ( )s a µ , which quantify the genomic ‶energy″ cost associated with that allele in a particular site. These potentials can be influenced by an environmental parameter ( ) λ . A formulation utilizing the frequencies of allelic occurrences has the advantage of assigning a universal unit (GEU) to quantify and compare the allele occupancies between homeostatic human populations. This genodynamic approach of describing evolutionary driving forces of human adaptation, then, develops adaptive forces to quantify the rate of change in the SNP distribution as functions of environmental parameters [2].
The SNP rs9310709 is located on chromosome three at the position 23052083. The closest 5` and 3` genes to this SNP are RPL24P7 and SALL4P5. RPL24P7 is described as a ribosomal protein L24 pseudogene 7, while SALL4P5 is described as a spalt like transcription factor 4 pseudogene 5, according to the GWAS catalog [3]. The SNP has two variants T and C, where C is the minor allele. This polymorphism is an intergenic variant located in a regulatory region on the genome [4]. According to the genome-wide association studies catalog, SNP rs9310709 is associated with chronic kidney disease and serum creatinine levels. The C allele is the risk allele with a p-value [3].
General mathematical functional forms only flagged associations between the yearly average temperature over thirty years and the potentials of this SNP (Figure 1, 2 and 3). The curves demonstrate that as the average temperature increases, the T allele becomes more conserved. As previously mentioned, a C allele in this location presents an increased risk of chronic kidney disease. We claim that an adaptive force due to average temperature optimizes population health by decreasing the risk of developing chronic kidney disease due to the environment they live in. Decreasing the occurrences of the C allele in populations living in higher- temperature regions provides an example of human genomic adaptation. This “adaptive force” against the C allele of about -0.14 𝐺𝐸𝑈⁄°C thereby suggests selective purpose to the smooth variation of the allelic occurrences with average environmental temperature.
Several studies have demonstrated that high environmental temperature is also associated with the increase in risk of developing chronic kidney disease. However, our approach quantifies the degree of adaptive optimization due to the presence of the risk alleles of a specific SNP within the population. Obviously direct experimentation on human populations to establish causation is implausible. The citations that follow are not given as a demonstration of causative proof of the results we obtained, only as examples supporting the feasibility of the presence of risk alleles in overall population health.
A study in Adelaide, South Australia associated an increase in seasonal temperature with a rise in the cases of most renal disease. This conclusion was based on studying of 83,519 cases from the emergency department and 42,957 inpatient admissions in 3927 days. The study found that there was an increase in renal admissions in the period from January to March, the warmest months in Australia [5]. Similarly, during the heat wave of 2006 in California, acute renal failure, nephritis and nephrotic syndrome were among the leading causes of excess hospitalizations [6]. The correlation observed here between SNP rs9310709 and average temperature indicates an adaptive ancestral explanation for the relationship between high temperature and kidney dysfunctions associated with this SNP.
Acknowledgment
We acknowledge King Saud bin Abdulaziz University for Health Sciences in Saudi Arabia for funding Daniah Alsufyani as a PhD student. We are grateful for Dr. Kareem Washington for valuable discussion, and his help with the SNP exploring. We also thank Dr. Georgia Dunston and Dr. Mones Abu-Asab for their support and practical suggestions.
Declarations
Funding: Dissertation funding through King Saud bin Abdulaziz University for Health Sciences in Saudi Arabia. The authors have no conflicts of interest to declare that are relevant to the content of this article. Availability of data and material: HapMap data is open access. The meteorological data used was flagged was taken from the period 1901 to 1930 from the site the climate change knowledge portal (CCKP) Code availability: Not applicable, formulas can be coded using any programming platform. Conflicts of interest: Authors declare that there is no conflict of interest. Ethical approval: Data in this research was obtained from an open access source, and it is publicly available. Informed consent: Data in this research was obtained from an open access source, and it is publicly available.
References
-
Lindesay J, Mason TE, Hercules W, Dunston GM (2014) Development of Genodynamic Metrics for Exploring the Biophysics of DNA Polymorphisms. J Comput Biol Bioinform Res 6(1).
-
Hercules W, Lindesay J, Mason TE, Dunston GM (2014) Information Dynamics of Whole Genome Adaptation. Nat Sci (Irvine) 6(15): 1228-1231.
-
Buniello A, MacArthur JAL, Cerezo M, Harris LW, Hayhurst J, et al. (2019) The NHGRI-EBI GWAS Catalog of Published Genome-Wide Association Studies, Targeted Arrays and Summary Statistics 2019. Nucleic Acids Res 47(D1): D1005-D1012.
-
Zerbino DR, Achuthan P, Akanni W, Amode MR, Barrell D, et al. (2018) Ensembl 2018. Nucleic Acids Res 46(D1): D754-D761.
-
Borg M, Peng B, Nitschke M, Williams S, McDona S (2017) The Impact of Daily Temperature on Renal Disease Incidence: An Ecological Study. Environ Health 16(1): 114.
-
Knowlton K, Rotkin-Ellman M, King G, Margolis HG, Smith D, et al. (2009) The 2006 California Heat Wave: Impacts on Hospitalizations and Emergency Department Visits. Environ Health Perspect 117(1): 61-67.
- Sense, Gravity, Parity & Chirality in Mathematical Physics
- Quantum Lattice Simulations PHYSICS: Microcircuit Particle Formation and Observable Macroscopic Irreversible Time - A Discrete Lagrangian with Cellular Automata Framework
- Quantum Biology from Biomacromolecule to Cell, and Central Dogma Described by Quantum Theory
- Focus, Agility, Speed and Technology (FAST) for Sustainability and Growth
- Square Root Metric Geometry and Pati-Salam Model in Curved Space-Time
- A Simple System Demonstrating the Mpemba Effect in Classical Mechanics