A Theoretical Study on the Cell Differentiation Forming Stem Cells in Higher Animals
The recent genome sequencing of multicellular diploid eukaryotes reveals an enlarged repertoire of protein genes for signal transmission but it is still difficult to elucidate the network of signal transmission to drive the life cycle of such an eukaryote only from biochemical and genetic studies. In the present paper, a theoretical study is carried out for the cell differentiation, the formation of stem cells and the growth from a child to the adult in the higher animal. With the intercellular and intracellular signal transmission in mind, the cell differentiation is theoretically derived from the process by the transition of proliferated cells from proliferation mode to differentiation mode and by both the long-range interaction between distinctive types of cells and the short-range interaction between the same types of cells. As the hierarchy of cell differentiation is advanced, the original types of self-reproducible cells are replaced by the self-reproducible cells returned from the cells differentiated already. The latter type of self-reproducible cells are marked with the signal specific to the preceding differentiation and become the stem cells for the next stage of cell differentiation. This situation is realized under the condition that the differentiation of cells occurs immediately after their proliferation in the development. The presence of stem cells in the respective lineages of differentiated cells strongly suggests another signal transmission for the growth of a child to a definite size of adult that the proliferation of stem cells in one lineage is activated by the signal from the differentiated cells in the other lineage(s) and is suppressed by the signal from the differentiated cells in its own lineage. This style of signal transmission also explains the metamorphosis and maturation of germ cells in higher animals.
Introduction
The life of a higher animal consists of the proliferation of a fertilized egg by mitosis, the differentiation of proliferated cells to form organs and tissues, growth to adult, production of germ cells by meiosis and death. This curious phenomenon has been studies from several approaches. The first approach is the experimental embryology that inquires into the initiation of cell differentiation by cutting an embryo and/ or transplanting some part to other regions in the embryo at various stages of development. This approach finds in the newt embryo that the dorsal vegetative guadrant of gastrula becomes the first organizer to induce the other types of cells [1, 2]. Similar approach is then extended to the embryo from asymmetrical Xenopus egg [3, 4], to Drosophila embryo by focusing on surrounding cells [5, 6], and to the embryo from symmetrical mammalian egg [7, 8]. Such approach also reveals a common pattern of forming body plan that the cells proliferated from a fertilized egg first differentiate into the ectoderm and the endoderm and then between them, the mesoderm appears.
The DNA replication, chromosome segregation and auxiliary molecular machine upon the mitosis and meiosis are visualized by optical microscopy of living cells and by electron microscopy of fixed and stained cells [9]. The biochemical studies find that the mitosis is triggered by the activity of MPF kinase to increase the phosphorylation of specific proteins [10, 11], while the Map kinase is reported to signal the pathway in oocyte meiosis [12, 13]. A close relation of cell division with phosphorylation is also reported [14].
The recent gene and genome sequencing is revealing a notable feature that most cells of a multicellular diploid eukaryote each carry the enlarged repertoire of protein genes for intercellular and intracellular signal transmission such as receptors and kinases as well as for cell adhesion [15, 16, 17, 18]. Moreover, many kinds of proteins including transcriptional regulators carry long stretches of serine and threonine residues, which are known to be the sites for phosphorylation [9] and glycosylation [19] to change the activity and specificity of the proteins. The transmission pathways of phosphorylation signal are partly followed experimentally from the receptor accepted ligand to transcriptional regulators in some examples of differentiated cells [9], but they are not simply linear relay chains but branch to activate many interaction components that operate in parallel, forming interconnected signal network. This complexity of signal transmission prevents the elucidation of cell behavior in a multicellular eukaryote only from the biochemical and genetic approaches.
Thus, theoretical studies are needed towards the comprehensive understanding of the cell behavior. In the previous paper [20], the basic condition for cell differentiation is theoretically formulated by the transition from proliferation mode to differentiation mode and by both the long-range interaction between distinctive types of cells and the short-range interaction between the same type of cells. In the present paper, this theoretical formulation is extended to the higher hierarchy of cell differentiation forming the stem cells in higher animals. Although the stem cells are indicated only for the renewal of corresponding lineage of differentiated cells [21], the signal transmission to stimulate and suppress the proliferation of stem cells will be also proposed to explain the growth curve of a higher animal including the metamorphosis and the maturation of germ cells.
Theoretical Formulation of Cell Differentiation
Several stages of cell differentiation forming the stem cells are schematically shown in Figure 1. Along this line, the cell differentiation and the formation of stem cells will be theoretically formulated in this and succeeding sections, respectively.
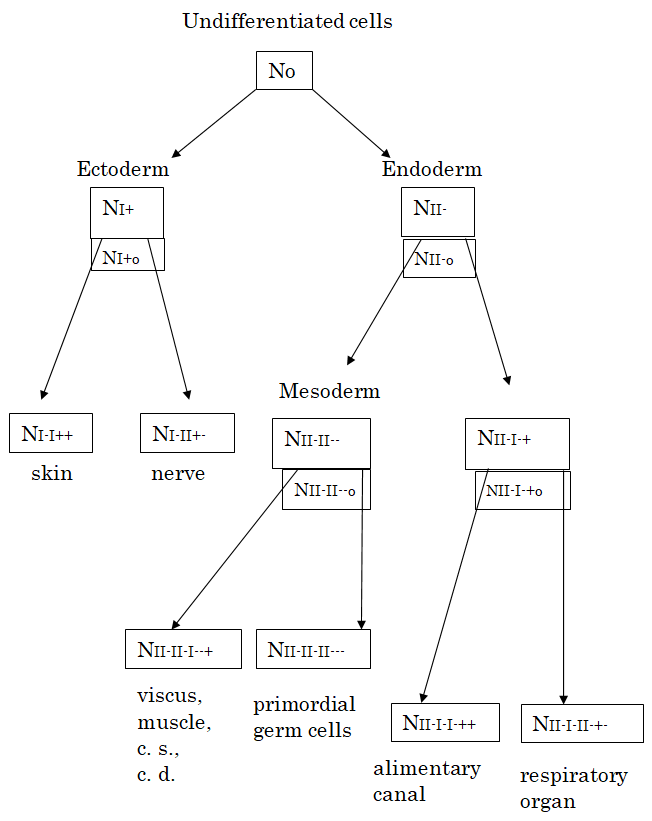
Figure 1: A schematic representation of cell differentiation forming stem cells in the development of the vertebrate. As the number No of self-reproducible undifferentiated cells increases, most of these cells first differentiate to form the ectoderm and endoderm each consisting of NI+ cells and NII- cells, respectively. Then, the ectoderm further differentiates to form the skin and nerve each consisting of NI-I++ cells and NI-II+- cells, respectively. During the first stage of cell differentiation, some of the I+ type cells return to the self-reproducible I+o type of stem cells NI+o which easily become I-I++ and I-I+- types of cells. In parallel, the endoderm further differentiates into NII-I-+ cells and NII-II- - cells, the former of which differentiates to form alimentary canal and respiratory organ and the latter of which is called the mesoderm to yield viscus, muscle, circulatory system (c. s.) and chorda dorsalis (c. d.) as well as primordial germ cells. In this lineage II- of cell differentiation, the self-reproducible cells marked with the character specific to the preceding stage of differentiated cells also increase as the stem cells for the next stage of differentiation, in contrast to the decrease in the number No of original undifferentiated cells. The numbers of such stem cells are also denoted by NII-o, NII-I-+o and NII-II--o in the figure.
When the number of proliferated cells becomes N, the first stage of cell differentiation into two types, + and -, occurs. This process of cell differentiation proceeds more rapidly than the proliferation, and can be analyzed considering that the total number N of cells is almost constant. As shown previously [20], the mathematical formulation of cell differentiation process starts from the master equation of the probability $P(N_{I^+}, N_{I^-}, N_{II^+}, N_{II^-}, N_o^; t)$, with which we find $N_{I^+}$ cells of + type and $N_{I^-}$ cells of - type in region $I$, $N_{II^+}$ cells of + type and $N_{II^-}$ cells of - type in region $II$, and $N_o$ self-reproducible undifferentiated cells at time $t$. The master equation expresses the time-change in this probability due to the following terms. The first kind of terms are transition probability $e^{aI}$ from an undifferentiated cell to + or - type of cell in the region $I$ and the transition probability $e^{aII}$ from an undifferentiated cell to + or - type of cells in the region $II$. The probabilities of reverse transition from these differentiated cells to the undifferentiated cells are denoted by $e^{-aI}$ and $e^{aII}$, respectively. Using the Ising model [22] that the + type of cell takes the value of +1 and the - type of cell takes the value of -1, the second kind of terms express that the cells in the same region tend to take the same type by the short-range interaction with the strength $\beta_I$ in the region $I$ and that with the strength $\beta_{II}$ in the region $II$, while the cells in the region $I$ tend to take the type different from the type of cells in the region $II$ by the long-range interaction with the strength $\gamma$.
When the total number of cells is $N (= N_{I^+} + N_{I^-} + N_{II^+} + N_{II^-} + N_o)$, we focus on the following four quantities defined by
$$Y_I = \frac{N_{I^+} + N_{I^-}}{N}, Y_I = \frac{N_{I^+} + N_{I^-}}{N}, y_I = \frac{N_{I^+} - N_{I^-}}{N}, y_I = \frac{N_{I^+} - N_{I^-}}{N}$$
(1)
Then, the master equation of the probability $P(N_{I^+}, N_{I^-}, N_{II^+}, N_{II^-}, N_o^; t)$ is changed into the equation of probability density function $p(Y_I, Y_{II^-}, y_I, y_{II^-}; t)$. If the $N$ is sufficiently large, it is obtained from the equation of probability density function that the most probable values of above four quantities mainly obey the following time-change equations [20].
$$\frac{d}{dt} Y_I = -Y_I e^{-aI} \cosh(\beta_I y_I - y_{II^-}) + 2(1 - Y_I - Y_{II^-}) e^{aI} \cosh(\beta_I y_I - y_{II^-})$$
(2)
$$\frac{d}{dt} Y_{II} = -Y_{II} e^{-aI} \cosh(\beta_{II} y_{II} - y_{II^-}) + 2(1 - Y_{II} - Y_{II^-}) e^{aI} \cosh(\beta_{II} y_{II} - y_{II^-})$$
(3)
$$\frac{d}{dt} y_I = 4Y_I \sinh(\beta_I y_I - y_{II^-}) - 4y_I \cosh(\beta_I y_I - y_{II^-})$$
(4)
$$\frac{d}{dt} y_{II} = 4Y_{II} \sinh(\beta_{II} y_{II} - y_{II^-}) - 4y_{II} \cosh(\beta_{II} y_{II} - y_{II^-})$$
(5)
Here, the following relation also holds
$$N(1 - Y_I - Y_{II}) = N_o(6)$$
The set of Equations (2-5) shows the behavior of cells towards the following differentiation. For the positive values of $a_I$ and $a_{II}$, $Y_I$ and $Y_{II}$ direct to the stationary values $Y_{II}$ and $Y_{II}$ which satisfy $dY/I/dt = 0$ and $dY_{II}/dt = 0$ in Equations (2) and (3), respectively. Then, the following relations hold between $Y_{II}$ and $Y_{II}$.
$$Y_{II} = 2(1 - Y_{II} - Y_{II}) e^{2aI}$$
(7)
$$Y_{IIst} = 2(1 - Y_{II} - Y_{II}) e^{2aII}$$
(8)
From Equations (7) and (8), $Y_{II}$ and $Y_{II}$ are expressed in terms of the transition probabilities $e^{aI}$ and $e^{aII}$ by the following way.
$$Y_{IIst} = \frac{2e^{2aI}}{1 + 2e^{2aI} + 2e^{2aII}}$$
(9)
$$Y_{IIst} = \frac{2e^{2aII}}{1 + 2e^{2aII} + 2e^{2aII}}$$
(10)
The relation between $Y_{II}$ and $y_I$ and that between $Y_{II}$ and $y_{II}$ at the stationary state are obtained from Equations (4) and (5), respectively, by setting $dy_I/dt = 0$ and $dy_{II}/dt = 0$. That is,
$$y_I = Y_{IIst} \tanh(\beta_I y_I - \gamma y_{II})$$
(11)
$$y_{II} = Y_{IIst} \tanh(\beta_{II} y_{II} - \gamma y_{II})$$
(12)
The solution of $y_I$ and $y_{II}$ satisfying Equations (11) and (12) are estimated as $y_{IIst}$ and $y_{IIst}$ respectively, by the graphical method shown in Figure 2, indicating the cell differentiation that $y_{IIst}$ becomes a positive value when $y_{IIst}$ takes a negative value. In particular, $y_{IIst}$ and $y_{IIst}$ become nearly equal to $Y_{IIst}$ and $Y_{IIst}$ that is, to $N_{I^+}/N$ and $-N_{II^+}/N$, respectively, when the interaction strength, $\beta_I, \beta_{II} > 0$ and $\gamma > 0$, is sufficiently strong.
The long-range interaction is probably caused by the pair-wise ligand-receptor relationship; the $I^+$ type of cell secretes the ligand $l_{II}$ which is accepted by the receptor $r_{II}$ on the surface of $II^+$ type of cell, while the $II^-$ type of cell secretes the ligand $l_{II}$ to be accepted by the receptor $r_{II}$ on the surface of $I^+$ type cell. The receptor $r_{II}$ accepted the ligand $l_{II}$ induces the expression of the gene(s) characteristic to the + type cell through the intracellular signal transmission to the transcriptional regulator(s), and the receptor $r_{II}$ accepted the ligand $l_{II}$ induces the expression of the gene(s) characteristic to the - type cell. The short-range interaction arises from the direct contact between the same type of cells to stabilize the intracellular signal transmission induced by the long-range interaction through the cytoskeleton.
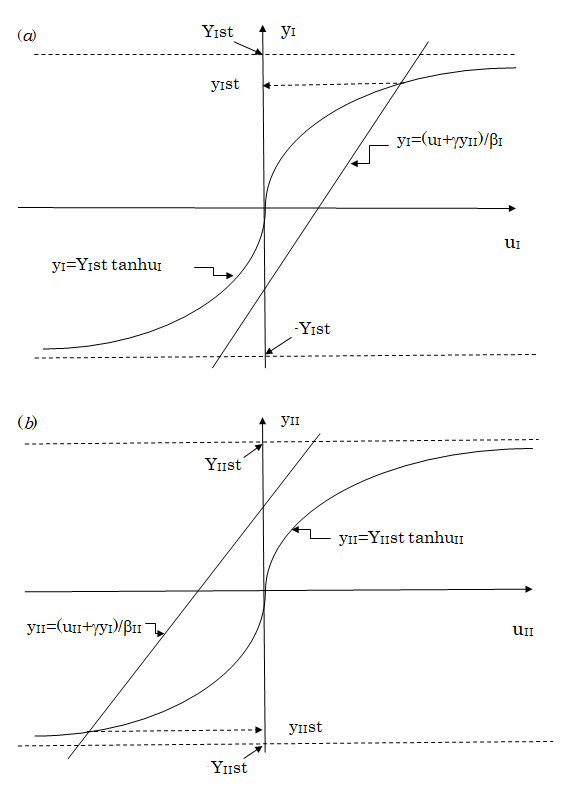
variable uI is introduced by
$$ u _ {I} = \beta_ {I} y _ {I} - \gamma y _ {I I}, $$
, Equation (11) is rewritten into yI = YIst tanh uI. The values of yI are plotted against
the values of uI according to the first equation under a constant value of yII and to the second equation. The value of yIst satisfying
Equation (11) is obtained as the ordinate of the crossing point of the straight line expressed by the first equation with the
curve expressed by the second equation. This value of yIst becomes positive when the value of yII is chosen to be negative. (b)
Introducing a new variable uII defined by
$$ u _ {I I} = \beta_ {I I} y _ {I I} - \gamma y _ {I} $$
, Equation (12) is rewritten into yII = YIIst tanh uII. The values of yII
are plotted against the values of uII according to these two equations under a constant value of yI. The value of yIIst satisfying
Equation (12) is obtained as the ordinate of the crossing point of the straight line with the curve expressed by the above two
equations. As seen in the figure, the value of yIIst thus obtained becomes negative when yI is chosen to be a positive value. This
is consistent with the result of (a).
At the stage when the number $N_{i+}$ of I+ type cells becomes larger, the I+ type of cells further differentiate into I-II+ and I-II- types of cells. By the procedure similar to that of the first stage, the second stage of cell differentiation is mathematically expressed in the following way. In the lineage I+, new variables $Y_{i+}, Y_{i+II}, y_{i+I}$ and $y_{i+II}$ are defined by
$$Y_{i+I} = \frac{N_{i-II++} + N_{i-II+}}{N_{i+}}, Y_{i-II} = \frac{N_{i-II++} + N_{i-II+}}{N_{i+}}, Y_{i-II} = \frac{N_{i-II++} - N_{i-II+}}{N_{i+}}$$
(13)
using the number $N_{i+II+}$ of ++type cells and the number $N_{i+II+}$ of ++type cells in the region I-I, and the number $N_{i+II+}$ of ++type cells in the region I-II. Here, $N_{i+}$ is the number of all cells in the lineage I+. The quantity $N_{i+0}$ defined by
$$N_{i+0} = N_{i+}(1 - Y_{i-I} - Y_{i-II})$$
(14)
is the number of stem cells in the lineage I+, which will be investigated in the next section. $Y_{i+I}$ and $Y_{i+II}$ are directed to the following stationary values $Y_{i+IIst}$ and $Y_{i+IIst}$ determined by the transition probabilities $e^{aII}$ from I+ type cells to I-II++ and I-II+ types of cells in the I-I region and by the transition probability $e^{aIII}$ to I-II++ and I-II+ types of cells in the I-II region.
$$Y_{i-IIst} = \frac{2e^{2aII-I}}{1 + 2e^{2aII-I} + 2e^{2aII-II}}$$
(15)
$$Y_{i-IIst} = \frac{2e^{2aII-II}}{1 + 2e^{2aII-II} + 2e^{2aII-II}}$$
(16)
The fractions $y_{i+I}$ and $y_{i+II}$ in the regions I-I and I-II are determined by the long-range interaction strength $Y_{i-III}$ between the cells in the region I-I and those in the region I-II as well as by the short-range interaction strength $\beta_{i+I}$ and $\beta_{i+II}$ in the respective regions, as follows.
$$y_{i-I} = Y_{i-IIst} \tanh(\beta_{i-I} y_{i-I} - \gamma_{i-I;I-II} y_{i-II})$$
(17)
$$y_{i-II} = Y_{i-IIst} \tanh(\beta_{i-II} y_{i-II} - \gamma_{i-I;I-II} y_{i-II})$$
(18)
By the graphical procedure similar to Equations (11) and (12), the cell differentiation of $y_{i+Ist} \sim N_{i+I+}/N_{i+}$ and $y_{i+Ist} \sim -N_{i+I+}/N_{i+}$ are obtained from Equations (17) and (18).
In parallel, II- type of cells also differentiate into II-I+ and II-II- types of cells according to the following set of equations.
$$Y_{II-I} = \frac{N_{II-II+} + N_{II-II-}}{N_{II-}}, Y_{II-II} = \frac{N_{II-II+} + N_{II-II-}}{N_{II-}}$$
(19)
$$y_{II-I} = \frac{N_{II-II+} - N_{II-II-}}{N_{II-}}, y_{II-II} = \frac{N_{II-II+} - N_{II-II-}}{N_{II-}}$$
(20)
$$N_{II-0} = N_{II-}(1 - Y_{II-I} - Y_{II-II})$$
(21)
$$Y_{II-Ist} = \frac{2e^{2aIII-I}}{1 + 2e^{2aIII-I} + 2e^{2aIII-II}}$$
(22)
and
$$y_{II-I} = Y_{II-Ist} \tanh(\beta_{II-I} y_{II-I} - \gamma_{II-I;I-II} y_{II-II})$$
(23)
$$y_{II-II} = Y_{II-IIst} \tanh(\beta_{II-II} y_{II-II} - \gamma_{II-I;I-II} y_{II-II})$$
(24)
The values of $y_{II-Ist}$ and $y_{II-Ist}$ satisfying Equations (23) and (24) are also obtained by the graphical procedure.
In this way, the first and second stages of cell differentiation shown in Figure 1 are reproduced mathematically. The mathematical expression for the succeeding stages of cell differentiation are also possible as the extension of the present formulation.
Formation and Property of Stem Cells
In this section, the changes in self-reproduducible cells will be theoretically investigated in a longer time scale than the process of cell differentiation at each stage. During the first stage, the number $N_{i+}$ of type cells in the region I changes with time in the following relation to the number $N_{o}$ of self-reproducing undifferentiated cells.
$$\frac{d}{dt} N_{I+} = e^{aI} N_{o} - e^{-aI} N_{I+}$$
(25)
In the same way, the number $N_{II-}$ of type cells in the region II changes with time by the following equation.
$$\frac{d}{dt} N_{II-} = e^{aII} N_{o} - e^{-aII} N_{II-}$$
(26)
Meanwhile, the number $N_{o}$ of undifferentiated cells also changes with time according to the following equation.
$$\frac{d}{dt} N_o = \lambda_o N_o - e^{aI} N_o - e^{aII} N_o \quad (27)$$
Here, $\lambda_o$ is the proliferation rate of undifferentiated cells. By formally integrating Equation (25) with respect to time $t$, the following expression of time dependency of $N_{i+}$ is obtained.
$$N_{i+}(t) = \exp\left(-e^{aI}(t - t_0)\right)$$
$$\int_{t_0}^{t} e^{aI} N_o(\tau) \exp\left(e^{-aI}(\tau - t_0)\right) d\tau + N_{i+}(t_0) \quad (28)$$
From Equation (27), the time dependence of $N_o(t)$ is expressed as
$$N_o(t) = N_o(t_0) \exp\left(\lambda(t - t_0)\right) \quad (29)$$
Here,
$$\lambda = \lambda_o - e^{aI} - e^{aII} \quad (30)$$
For the formation of stem cells, it is necessary for $\lambda$ to be nearly equal to zero, that is, the proliferated cells immediately change to the differentiation mode. Then, $N_o(t)$ in the integral of Equation (28) is regarded as almost constant $N_o$ independent of time within the range of $t_o < \tau < t$, and this equation is reduced to
$$N_{i+}(t) \approx e^{2aI} N_o\left[1 - \exp\left(-e^{aI}(t - t_0)\right)\right]$$
$$+ N_o \exp\left(-e^{aI}(t - t_0)\right) \quad (31)$$
Thus, $N_{i+}(t)$ increases from $N_o$ to $e^{2aI} N_o$ with time. During this period, the number $N_{i+}$ of self-reproducible cells having returned from $I+$ type of cells increases first according to
$$\frac{d}{dt} N_{I+o}(t) = e^{-cI} N_{I+}(0) = e^{-aI} N_o \quad (32)$$
but finally increases according to the equation.
$$\frac{d}{dt} N_{I+o}(t) = e^{-aI} N_{I+}(t) = e^{aI} N_o \quad (33)$$
In the similar way, the number $N_{II+o}$ of self-reproducible cells having returned from the $II$-type cells increases finally according to the equation.
$$\frac{d}{dt} N_{II+o}(t) = e^{aII} N_o \quad (34)$$
Thus, the numbers $N_{I+o}$ and $N_{II+o}$ becomes larger than $N_o$ at the later period of the first stage of cell differentiation. If the $I_{+o}$ and $II_{o}$ types of self-reproducible cells still carry the receptor-ligands $r_{I+I_{II}}$ and $r_{II+I_{II}}$ as well as the corresponding intracellular signal transmitters, respectively, they are easier to become the second stage of differentiated cells, $I-I++$ and $I-II++$ types of cells, and $II-I++$ and $II-II++$ types of cells, respectively, than the original self-reproducible cells $N_o$. Thus, $N_{I+o}$ cells and $N_{II+o}$ cells correspond to the stem cells for the second stage of cell differentiation.
At the second stage of cell differentiation, the term of $-e^{aI-1} + e^{aII-1} N_{I+o}$ is added to the right hand side of Equation (33) and the increase in $N_{I+o}$ is stopped. Instead, new types of stem cells having returned from $I-I++$ and $I-II++$ types of cells increase in their numbers $N_{I+o+o}$ and $N_{I-II+o}$ by the following way
$$\frac{d}{dt} N_{I-II+o}(t) = e^{aI-1} N_{I+o} \quad (35)$$
$$\frac{d}{dt} N_{I-II+o}(t) = e^{aI-II} N_{I+o} \quad (36)$$
In the same way, the numbers $N_{II+o+o}$ and $N_{II-II+o}$ of self-reproducible stem cells increase with time according to the following equations
$$\frac{d}{dt} N_{II-II+o}(t) = e^{aII-II} N_{II-o} \quad (37)$$
$$\frac{d}{dt} N_{II-II+o}(t) = e^{aII-II} N_{II-o} \quad (38)$$
The stem cells formed in this way are advantageous to advance the cell differentiation towards the higher hierarchy, although the regeneration of a lost organ containing the stem cells becomes harder.
**Regulation and Control on the Proliferation Rates of Stem Cells in Different Lineages**
After the development of an embryo, the born child grows to a definite size of adult, taking preys. During this growth, the organs and tissues are enlarged by the proliferation of stem cells in the respective lineages. Thus, it is necessary to consider the problem how the proliferation of stem cells in different lineages is coordinately regulated and controlled to form a definite size of adult suitable for preying activity and breeding. The following two cases are considerable for this problem, alternatively. (i) The proliferation rate of stem cells in one lineage is raised by the signal from the differentiated cells in other lineage(s) and it is suppressed by the signal from the differentiated cells in its own lineage. (ii) The proliferation rate of stem cells in one lineage is raised by the signal from the differentiated cells in its own lineage and is suppressed by the signal from the differentiated cells in other lineage(s).
It is a simple model scheme for the case (i) that the differentiated cells in the i-th lineage stimulate the proliferation of stem cells in (i+1)-th lineage (i = 1, 2, ....,k and k+1=1) and the proliferation of stem cells in each lineage is suppressed by the differentiated cells in its own lineage. Mathematically, this is expressed by the following set of equations concerning the time change in the numbers N1, N2, ......., and Nk of differentiated cells in the lineages 1, 2, ........, and k.
$$ \frac {d}{d} N _ {1} = a _ {1 k} N _ {k} - r _ {1} N _ {1} ^ {m 1} \tag {39} $$ $$ \frac {d}{d t} N _ {2} = a _ {2 1} N _ {1} - r _ {2} N _ {2} ^ {m 2} $$ (40) ..........................
$$ \frac {d}{d t} N _ {k} = a _ {k k - 1} N _ {k - 1} - r _ {k} N _ {k} ^ {m k} $$ (41) Here, aii+1’s, ri ‘s and mi’s are assumed to be constant for simplicity. Then, the numbers of differentiated cells in all lineages increase with time towards a stable stationary state, in which Nist’s are written in terms of ai,i-1’s, ri’s and mi’s as follows.
a a a a N r r r r
2 2 3 2 3....... 1 1/( 1 2 3......... 1) 32 43 1 21 1
2 3 4 1 {( )( ) ( ) ..........( ) } m m m m m mk mk m m m mk k st $$ = \left\{\left(\frac {a _ {2 1}}{r}\right) \left(\frac {a _ {3 2}}{r}\right) ^ {m 2} \left(\frac {a _ {4 3}}{r}\right) ^ {m 2 m 3} \dots \dots \dots \dots \left(\frac {a _ {1 k}}{r}\right) ^ {m 2 m 3 \dots m k - 1 m k} \right\} ^ {1 / (m 1 m 2 m 3 \dots m k - 1)} $$ (42) $$ N _ {2 s t} = \left\{\left(\frac {a _ {3 2}}{r _ {3}}\right) \left(\frac {a _ {4 3}}{r _ {4}}\right) ^ {m 3} \left(\frac {a _ {5 4}}{r _ {5}}\right) ^ {m 3 m 4} \dots \dots \dots \left(\frac {a _ {2 1}}{r _ {2}}\right) ^ {m 3 m 4 \dots \dots m k m 1} \right\} ^ {1 / (m 1 m 2 m 3 \dots \dots m k - 1)} $$ (43) ........................................................................................................ 1 1 2 1 2 3....... 1 1/ 1 2 3........ 1) 1 32 1 21 a a a d a N dt r r r r
1 2 3 {( )( ) ( ) .........( ) } m m m m m m mk m m m mk k kk kst $$ = \left\{\left(\frac {a _ {1 k}}{r}\right) \left(\frac {a _ {2 1}}{r}\right) ^ {m 1} \left(\frac {a _ {3 2}}{r}\right) ^ {m 1 m 2} \dots \dots \dots \left(\frac {a _ {k k - 1}}{r}\right) ^ {m 1 m 2 m 3 \dots \dots m k - 1} \right\} ^ {1 / m 1 m 2 m 3 \dots \dots m k - 1)} $$ k (44) As seen from this result, aii+1> ri and mi > 1 are necessary for Nist’s to represent an enlarged body size of the adult. The stability of this stationary state is illustrated in Figure 3 for the simplest model of k = 2 and m1 =m2 =2. In the case when the values of aii-1’s, ri’s and mi’s are so adjusted as to retain the ratio of differentiated cells determined by the transition probabilities eα’s and the long-range and short- range interaction strength in the development, almost the same body shape is retained during the growth from a child to the adult. On the contrary, the body shape is considerably changed during the growth, when the values of some of aii-
1’s, ri’s and mi’s are changed, for example, by the secretion of hormones. The metamorphosis is an extreme case of such example, as will be discussed in the last section. At any rate, the case (i) is compatible with the growth to a definite size of adult.
In contrast to the case (i), no stable growth point is obtained for the case (ii). This result is instructive in considering the stability of a population consisting of interacting elements under birth and death process.
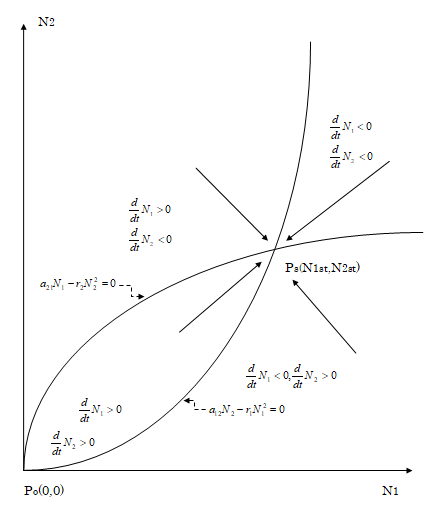
$$ \frac {d}{d t} N _ {2} = a _ {2 1} N _ {1} - r _ {2} N _ {2} ^ {2} $$
$$ \frac {d}{d t} N _ {1} = a _ {1 2} N _ {2} - r _ {1} N _ {1} ^ {2}, $$
The two curves each obtained by setting the right hand of each of the above equations to be zero are plotted on the plane expanded by rectangular axes N1 and N2. These curves have two crossing points Po(0, 0) and Ps(N1st, N2st). Here, N1st = {(a21/r1)(a12/r2)2}1/3 and N2st={(a12/r2)(a21/ r1)2}1/3. The positive or negative value of dN1/dt and dN2/ dt is denoted in the four regions divided by the above two curves, and the corresponding increase or decrease in N1 and N2 is shown by an arrow in each region. As seen in the figure, the cell assembly consisting of N1 and N2 near the point Po is directed towards the stable stationary state represented by the point Ps(N1st, N2st).
Biological Activity
The biological activity $BA$ proposed previously [23] gives a useful measure for a whole state of an animal during the growth. This thermodynamic quantity is defined as follows, using the temperature $T$.
$$BA \equiv E_a(\{N_i\}, S_n(\{N_i\})) - E_s(\{N_i\}) - TS_n(\{N_i\})$$
(44)
The difference between the energy $E_a$ acquired by the cooperative action of differentiated cells and the energy $E_s$ stored in the set $\{N_i\}$ of differentiated cells is released as heat to compensate for the negative entropy $-S_s(\{N_i\})$ of systematization of differentiated cells, being consistent with the second law of thermodynamics. The acquired energy, which is first given from female parent but then acquired by taking preys, is mainly used to increase the numbers of differentiated cells during the growth but it is gradually accumulated to raise the biological activity (probably in the form of ATP and/or GTP molecules) as the increase in the numbers of differentiated cells slows down. The raised biological activity then stimulates the metamorphosis and the maturation of primordial germ cells through the secretion of hormones. As the animal ages, its biological activity decreases as will be discussed in the last section.
Conclusions and Discussion
In the present paper, a theoretical study is carried out for the cell behavior, mainly focusing on the cell differentiation, formation of stem cells and the regulation on the proliferation of stem cells to explain the growth from an embryo to a definite size of adult. This theory contains the signal transmission pathways still unidentified as well as experimentally identified ones. For the future identification of the former, the signal transmission indicated in the present study will be first summarized into the following four categories $(A) \sim (B)$.
(A) Signal for the transition between the proliferation mode and the differentiation mode. Recently, a technological method to convert differentiated cells into self-reproducible undifferentiated ones is devised by injecting the four kinds of genes, $Oct3/4$, $Sox 2$, $Klf4$ and $c-Mty-c$ [24, 25]. Originally, these genes are expressed specifically in the embryonic stem $(ES)$ cell, and the products of these genes may play the role in erasing the signals for the long-range and short-range interactions and in converting $\alpha'$s in the transition probabilities to negative values. This also suggests the presence of genes whose products suppress the expression of the above four genes and promote the transition to the differentiation mode in response to the increase in the density of cells.
(B) The signal transmission responsible for cell differentiation. This type of signal transmission causes the long-range interaction between distinctive types of cells and the short-range interaction between the same type of cells. In addition to the identification of this signal transmission, it is also a future problem to ascertain whether the advanced form of differentiated cells, e.g. denoted by $II-II+$, are under the influence of double pairs of long-range interaction and short-range interaction, or indicate the two steps of molecular events to express the specific gene(s), first under the interaction pair characterized by the state - and then changes under the second interaction pair characterized by the state +.
(C) Signal transmission in response to raised biological activity. The gonadotrophic hormones are known to stimulate the proliferation of primordial germ cells leading to the meiosis by the intracellular phosphorylation due to Map kinase [12, 13]. The metamorphosis is also the representative example that the proliferation of stem cells and cell differentiation in one group of lineages are changed to those in another group of lineages in response to the raised biological activity. In many species of insects, most of cells forming the larva are led to programmed death or apoptosis and are used as the material and energy source for the stem cells in another group of lineages to form the adult by the action of prothoraciatrophic hormone and prothoracid hormone [26], although the adult hardly enlarges and dies soon after breading. The evolution from fish to land vertebrates can be traced in the metamorphosis from the tadpole to the frog by the action of thyroid hormone [27]. This kind of hormone also plays an important role in maintaining various organs of other land vertebrates [28]. In such land vertebrates, the metamorphosis occurs during the fetus and the signal transmission to regulate and control the proliferation of stem cells described in the fourth section takes place from the born child to the adult, while most species of fish grow without the metamorphosis.
(D) Signal transmission for raising and suppressing the proliferation rate of stem cells. Besides the hormones to cause the metamorphosis, the growth hormone synthesized in and secreted from the anterior lobe of pituitary gland [29] may play a central role in raising the proliferation rate of stem cells during the growth. Although the signal to suppress the proliferation of stem cells in its own lineage is not identified yet, the autonomic nervous system might be associated with such suppression. Anyway, the proliferation of stem cells becomes restricted to renew the cells of organs and tissues after the adult reaches a definite size.
As the renewal ability of stem cells is lowered, the senile weakness occurs leading to death. It is reasonable that the life span of an animal is regulated to be finite in this way.
because any survived organism has maintained and extended their negative entropy to acquire the material and energy from the outside by reproducing children including mutants and by the selection of them [30, 31]. Even if we confine ourselves to the base change in DNA genes arising from the mis-repair of damaged bases, its change rate amounts to 10-9 per site per year [32, 33]. Even by such point mutation, receptors, kinases and the proteins each carrying serine- threonine repeat easily change their activity and specificity. Although many of such changes are defective, some others contribute to expand the repertoire of these protein genes by occurring in the counterpart of their duplicated genes. In this sense, the signal transmission is an important factor in the evolution, especially with respect to the ratio of organs, body size, life span and the adaptation to the environment. This may explain the difference between human and chimpanzee, which diverged only about 7x10⁶ years ago [34].
References
-
Spemann H, Mangold H (1924) Über Induktion von Embryonalagen durch Implantation artfrem der Organisatoren. Archiv für mikroskopiche Anatomie und Entwicklungsmechanik 100: 599-638.
-
Spemann H (1938) Embryonic Development and Induction. Yale University Press, New Haven, CT, USA.
-
Smith WC, Knecht AK, Wu M, Harland RM (1993) Secreted noggin protein mimics the Spemann organizer in dorsalizing Xenopus mesoderm. Nature 361(6412): 547-549.
-
Bae CJ, Hang CS, Saint-Jeanet JP (2018) Anosmin-I is essential for neural crest and cranial placodes formation in Xenopus. Biochem Biophys Res Commun 495(3): 2257-2263.
-
St. Johnston D, Nüsslein-Volhard C (1992) The origin of pattern and polarity in Drosophila embryo. Cell 68(2): 201-219.
-
Kronia L, Whitefield ZJ, Yuan B, Dzeyk K, Kirkpatrick J, et al. (2014) Quantitative proteomics reveals the dynamics of protein changes during Drosophila oocyte maturation and oocyte-to-embryo transition. Proc Natl Acad Sci USA 111(45): 16023-16028.
-
Tarkowski AK (1959) Experiments on the development of isolated blastomeres of mouse eggs. Nature 184: 1286-1287.
-
Robertson EJ (1986) Pluripotential stem cell line as a route into the mouse germ line. Trends in Genetics 2: 9-13.
-
Alberts B, Bray D, Lewis J, Raff M, Roberts K, et al. (1994) Molecular Biology of the Cell. 3rd(Edn.), Garland Publishing Inc, New York & London.
-
Newport JW, Kirschner MW (1984) Regulation of the cell cycle during early Xenopus development. Cell 37(3): 731-742.
-
Lohka MJ, Hayes MK, Maller JI (1988) Purification of maturation-promoting factor, an intracellular regulator of early mitotic events. Proc Natl Acad Sci USA 85(9): 3003-3013.
-
Murray AW (1998) Map kinases in meiosis. Cell 92(2): 157-159.
-
Fan H, Tong C, Cham D, Sun Q (2002) Roles of Map kinase signal pathway in oocyte meiosis. Chinese Science Bulletin 47: 1157-1162.
-
Hans F, Dimitror S (2001) Histone H3 phosphorylation and cell division. Oncogene 20: 3021-3027.
-
C. elegans genome sequencing consortium (1998) Genome sequence of the nematode C. elegans: A platform for investigating biology. Science 282(5396): 2012-2018.
-
Adams MD, Ceiniker SE, Holt RA, Evans CA, Gocayne JD, et al. (2000) The genome sequence of Drosophila melanogaster. Science 287(5461): 2185-2195.
-
The Arabidopsis genome initiative (2000) Analysis of the genome sequence of the flowering plant Arabidopsis theliana. Nature 408: 796-815.
-
Vanter JC, Adams MD, Myers EW, Li PW, Mural RJ, et al. (2001)The sequence of the human genome. Science 291(5507): 1304-1351.
-
Hart GW (1997) Dynamic O-linked glycosylation of nuclear and cytoskeletal proteins. Annual Review of Biochemistry 66: 315-335.
-
Otsuka J (2020) A mathematical model of the cell differentiation in multicellular eukaryotes. Applied Mathematics 11(3): 157-171.
-
Cairnie AB (1976) Stem Cells of Renewing Cell Population. 1st(Edn.), Academic Press, New York, USA.
-
Ising E (1925) Beitrag zur theorie des ferromagnetismus. Zeitschrift für Physik 31: 253-258.
-
Otsuka J (2017) The concept of biological activity and its application to biological phenomena. Journal of Physical Chemistry & Biophysics 7(1): 235-240.
-
Takahashi K, Yamanaka S (2006) Induction of pluripotent stem cells from mouse embryonic and adult fibroblast cultures by defined factors. Cell 126(4): 663-676.
-
Tanabe K, Nakamura M, Narita M, Takahashi K, Yamanaka S (2013) Maturation, not initiation, is the major roadblock during reprogramming toward pluripotency from human fibroblasts. Proc Natl Acad Sci USA 110(30): 12172-12179.
-
Klowden MJ (2007) Physiological Systems in Insects. 2nd (Edn.), Academic Press, USA.
-
Tata JR (1998) Amphibian metamorphosis as a model for studying the developmental actions of thyroid hormone. Cell Research 8: 259-272.
-
Mullur R, Liu YY, Brent GA (2014) Thyroid hormone regulation of metabolism. Physiol Rev 94(2): 355-382.
-
Li S, Bemat B, Pàl G, Kossiakoff A, Li WH (2002) Functional promiscuity of squirrel monkey growth hormone receptor toward both primate and non-primate hormone. Molecular Biology and Evolution 19(7): 1083- 1092.
-
Otsuka J (2018) A mathematical formulation of evolution and innovation II. From unicellular monoploid eukaryotes to multicellular diploid eukaryotes. Phy Sci & Biophy J 2(2): 1-11.
-
Otsuka J (2018) The negative entropy in organisms; its maintenance and extension. Journal of Modern Physics 9(12): 2156-2169.
-
Kimura M (1980) A simple method for estimating evolutionary rate of base substitutions through comparative studies of nucleotide sequences. J Mol Evol 16(2): 111-120.
-
Otsuka J, Terai G, Nakano T (1999) Phylogeny of organisms investigated by the base-pair changes in the stem regions of small and large ribosomal subunit RNAs. J Mol Evol 48(2): 218-235.
-
Otsuka J, Kawai Y, Sugaya N (2001) The influence of selection on the evolutionary distance estimated from the base changes observed between homologous nucleotide sequences. J Theor Biol 213(2): 129-144.
- Sense, Gravity, Parity & Chirality in Mathematical Physics
- Quantum Lattice Simulations PHYSICS: Microcircuit Particle Formation and Observable Macroscopic Irreversible Time - A Discrete Lagrangian with Cellular Automata Framework
- Quantum Biology from Biomacromolecule to Cell, and Central Dogma Described by Quantum Theory
- Focus, Agility, Speed and Technology (FAST) for Sustainability and Growth
- Square Root Metric Geometry and Pati-Salam Model in Curved Space-Time
- A Simple System Demonstrating the Mpemba Effect in Classical Mechanics