Efficiency of Grid-Connected Photovoltaic System in the Dairy Farms: Case Study in the Mediterranean Region (Tlemcen)
With the growth of greenhouse gases in the atmosphere, renewable energies have become a promising solution to reduce global warming and pollution. One of the government’s goals is to introduce renewable energy in all sectors, especially the agricultural sector, which relies heavily on fossil fuels to operate milking cooling systems and other systems. This article presents a real study on the feasibility and efficiency of Grid connected PV system on a dairy farm, in Tlemcen province. It’s a typical farm that consumes about 42MWh / year of electrical energy. On this basis, we will dimension the system using the HOMER software, to feed this farm. A Grid connected PV system of 30W could produce 54.03MWh/yr, with Renewable Fraction of 53%, and 28.54kWh/yr was generated from the PV array, and 25.44kWh/yr is the amount of electricity purchased by the grid, while, the energy injected into the grid was estimated at 8.430 MWh/yr. In order to show the feasibility of this system we will proposed another system based on diesel generator, so that we can economically compare between the two systems, the lowest net present cost (NPC) of Diesel system of 25kW was estimated at 826$, with a cost of energy (COE) of 1.51$/kWh, while, the highest net present cost (NPC) of PV-Grid system (40kW) is 233$, and the cost of energy (COE) is 0.42$/ kWh. Therefore, this study shows the effectiveness of the grid-PV system in economic and environmental terms, t
Introduction
Electricity is an important element in the development of countries, as the consumption of electricity in Algeria is increasing annually about 9.5% [1]. According SONELGAZ, the number of customers increased from 6.04 million in 2007 to 7.42 million in 2012 [2], this is due to economic growth and demographic growth. Therefore, the Algerian government is seeking to stimulate the renewable energies, and one of the state’s objectives is to install solar power plants and wind energy, estimated at 22 GW, by 2030 [3]. The sunshine duration in Algeria varies from 2000h to 3500 h per year [4].
Renewable energies have great advantages on the farmers in Algeria. On the one hand, the renewable energy generation in rural villages to power their homes farm operations, especially, for pumping water, cooling and refrigeration, on the other hand, to help dairy farmers to produce larger amounts of milk. Because the ventilation of any dairy housing structure is of paramount importance, dairy cows need a healthy fresh air for them to achieve their production potential. Moreover the fans installed in the barn will reduce the heat stress and encourage the cows to come to eat, in addition to that, cows can breathe easier and maintain their body temperature, once the temperature goes above 25°C cows will reduce feed intake [5].
In the literature, several researchers discussed the impact of renewable energies on the development of the agricultural sector. In all developed a countries, electricity is critical to many farm operations. A New York state dairy farm study in 2003, was estimated that an average electrical use of 781kWh per cow per year [6]. Maammeur, et al. [7] have chosen a typical farm in Chlef, then they calculated the daily amount of electricity consumed by the agricultural equipment, then they proposed a grid-connected PV system to feed the needs of the farm. Nacer, et al. [8] analyzed the performance of a grid-connected PV system on family farms in rural areas. Bey, et al. [9] did a study that was done in a dairy farm south of Tlemcen, the methodology of this study is to optimize irrigation and lighting, using a grid connected photovoltaic system. Another study was carried out in India by chel and kaushik [10], to promote renewable and clean energies in the agricultural sector. A similar review was conducted in Turkey by Bayrakci and Koçar [11], which plans to promote and apply the different forms of renewable energy in agriculture. Houston, et al. [12] assessed the positive impact and efficient of the use of renewable energies in small dairy farms. Another study on the technical-economic impact of a hybrid PV / wind turbine system on a medium-sized farm in the desert of Algeria using HOMER software [13]. In the same context, there is a technical-economic analysis in California that influence on the uses of renewable energy on farms [14]. Dairy buildings often need ventilation to change the air inside Shen, et al. Suggested a computational Fluid Dynamics (CFDs) to provide natural ventilation on a dairy farm [15]. In north-western coast of Sicily, Tudisca, et al. conducted an economic study of four photovoltaic devices for farm buildings in four farms, the purpose of this system is to meet the total needs of these four farms, in addition to selling electricity to the grid [16]. There was sufficient theoretical research evidence regarding the application of renewable energy on farms.
Milk comprises almost 90 percent water, so it’s not surprising that a cow’s water intake has a major effect on her milk production. The quality of this fresh water is fundamental to encourage the animals to drink and eat more and therefore to produce more milk. Cows need at least three liters of water to produce one liter of milk. This means that high yielding dairy cows are in need of more than 150 liters of fresh water each day. Most researchers feel the ideal drinking water temperature is between 15°C and 17°C. Cows like to drink clean and fresh water. In addition, the dairy farmer expects a lot of its cows; however, the cows cannot meet dairy farmer needs if they did not live under optimal conditions [5].
Electricity and oil products are the two primary energy sources consumed in agricultural farm, livestock and conservation of farming products. There has been a great deal of research in this area. The main objective of this study is to promote renewable energies in the field of agriculture, especially on dairy farms, and secondary objectives.
- Calculating the daily, monthly and annual electricity consumption which includes: ventilation, milking, water pumping, agricultural product storage, milk cooling, and lighting, to predict the size of photovoltaic system that can reduce the purchase of electricity from the grid.
- Comparison on the technical and economic level, between the proposed Grid-connected Photovoltaic system and the most used system (diesel).
Methodology
Description of the Site
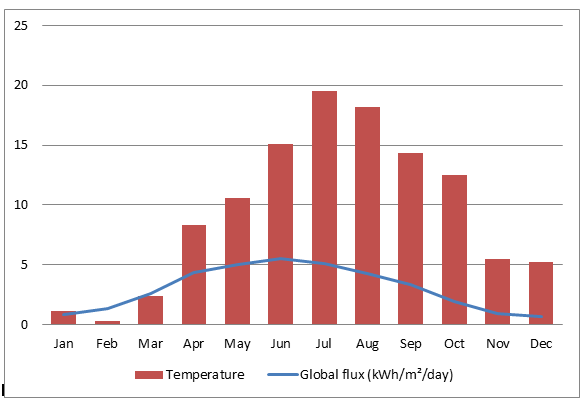
Remchi is a town and commune, is located in a north of Tlemcen province (35°04’N, 1°26’W). Remchi is characterized by a Mediterranean climate; it is also located on fertile agricultural lands. The irradiation and temperature are shown in Figure1.
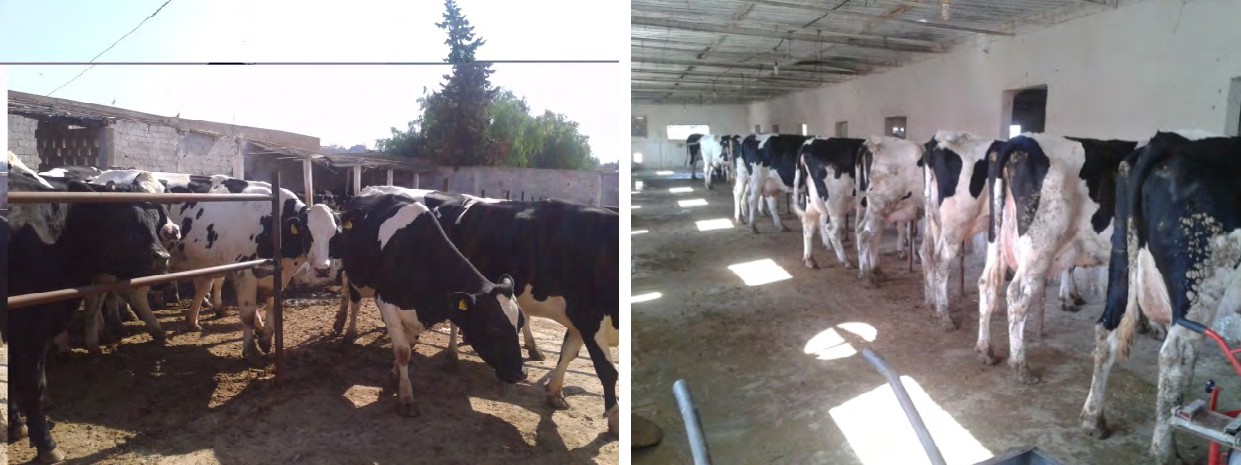
This study was conducted on a traditional farm, that we visited to know the equipment that works by electricity and the most important problems faced by farmers such as the electricity cuts. The area of this farm is about 450m² where there is a milking parlour, a storage room of agricultural produce and the largest area was for grazing, there are 50
Electricity Consumption at Dairy Farm
The dairy farm electricity consumption was required for different usages: Lighting, Ventilation, Milking, Cooling milk and Refrigeration for agricultural products storage, water pumping.
Lighting: A natural lighting is not sufficient in a dairy farm; it must be supplemented by artificial lighting. Dairy cows that are given 16 hours of light continuously each day will increase milk production from 5 to 16% with feed intake up 6% and they will maintain reproductive performance, when compared to cows receiving 13.5 hours of light or less [5]. The daily electrical consumption of lighting is given by the following equation:
$$ E _ {L i g h} = N _ {L a m p} P _ {L a m p} t _ {L i g h} \tag {1} $$
Where, Ligh E is the daily electrical consumption of lighting (Wh/day), Lamp P is the power of the lamp (W), Lamp N is the total number of lamps and Ligh t is the time of lighting.
Ventilation: During the warm period, providing fresh air in the farm is very important, moreover the fans installed in the barn will reduce the heat stress and encourage the cows to come to eat, and hence for producing more of the milk. However, in November, December, January and February, there is no need to operate the fans. The daily electrical consumption of ventilation is given by the following equation:
vent fan fan fan E N P t = (2)
Where, vent E is the daily electrical consumption of ventilation dairy cows that feed on maize grass. As shown in the picture below Figure 2.
(Wh/day), fan P is power of the fan (W), fan N is the total number of fans.
Milking: Cows are usually milked twice a day, although some farms are milking three times a day. More frequent milking results in higher milk production if adequate nutrition is provided. The daily electrical consumption of milking is given by the following equation:
$$ E _ {M i l k} = N _ {C o w s} P _ {M i l k} t _ {M i l k} \tag {3} $$
Where, Milk E is the daily electrical consumption of milking (Wh/day), Milk P is power of the milking machines (W), Cows N is the number of dairy cows, Milk t is the time of milking.
Cooling milk and refrigeration for agricultural products storage: Cooling and Refrigeration are a critical component of the dairy operation. This requires a sanitized and empty tank, to maintain milk temperature at 4°C. And the cold rooms to conserve agricultural products after harvest. The daily electrical consumption of cooling and refrigeration is given by equation:
$$ E _ {C \& R} = P _ {c} t _ {c} + N _ {R M} P _ {R M} t _ {R} \tag {4} $$
Where, & C R E is the daily electrical consumption of cooling and refrigeration (Wh/day), cP is the power of the tank, ct is the cooling time, RM N is the number of refrigeration machines, RM P is the power of refrigeration machine (W), and Rt is the time of refrigeration.
pumping. The time of pumping can be given by equation:
$$ t _ {p u m p} = \frac {Q _ {w a t e r}}{Q _ {p u m p}} \tag {7} $$
water pump pump
- water
- Cows
- Cows
- Hyg
- Q
- Q
- N
- Q
- =
- + (5)
- The daily consumption required for water pumping is calculated by equation: pump pump pump
- E
- P t
- = (6)
- Where, pump
- E is the daily consumption required for water pumping, pump
- P is the power of pump, and pump t the time of
- Equipment Type
- Operation h/day
- Power (W)
- Number of
- Lighting
- 16 (in Winter)
- 30
- 10 lamp (fluorescent lighting)
- Ventilation
- 16 (in Summer)
- 750
- 5
- Milking
- 3
- 550
- 5
- Cooling
- 14
- 1235
- 3
- Refrigeration
- 24
- 980
- 1 cold room [20] pumping
- 5
- 450
- 1
Table 1: Power rating of appliances and the corresponding operational hour.
Power Generation of Photovoltaic System in Dairy Farm
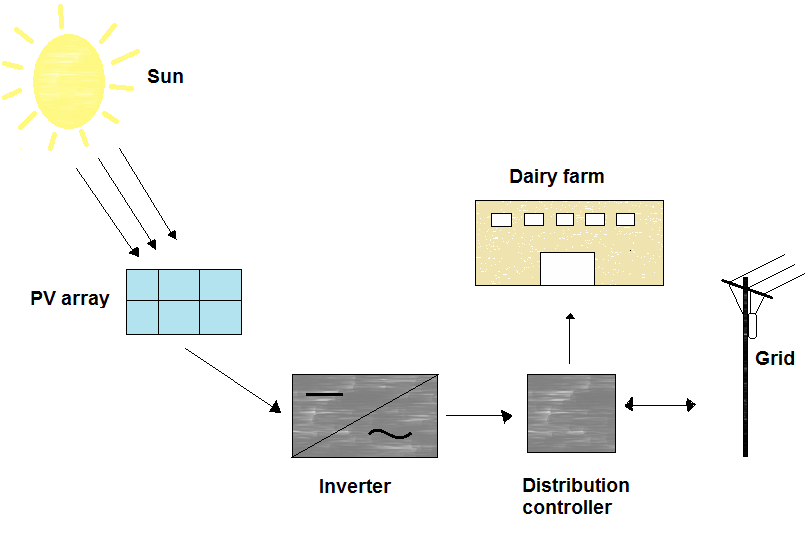
As Mediterranean region has very good resources in most locations. Given the sun availability, and the annual electricity consumption of the farm of approximately 42.34 MWh, implementation of a solar energy system is considered. The average electricity being consumed by the dairy farm was estimated at 122kWh/day. The PV system to fully meet the load demand, it includes of a solar PV panels, inverter, DC and AC consumers, as shown in the Figure 3.
The peak power of the PV system is calculated by the following equation:
$$ , = \frac {E _ {d e m a n d} \times P _ {i}}{R _ {g} \times F \times \eta_ {i n v}} \tag {9} $$ E P P R F η demand i P g inv Where, P P is the peak power of the PV system (kWp), iP is the solar at STC (1 kW/m², 25°C), g R is the global solar radiation, which is equal to 5.48kWh/m²/day, in the most favorable month. F is the PV derating factor, which is between 0.85 and 0.90, is the inverter yield (95%). The daily consumption of electricity was estimated at 157.59kWh/ day; in the summer period. We use equation (9), to calculate the value of the peak power of the PV system, the value found is 37.83 kWp, at standard conditions.
The HOMER software has been used to calculate the energy output from photovoltaic system, using the following equation [7]:
G E C f T T G α = + −
( ) , 1 PV PV PV T PV PV SC SC
(10)
Where, $C_{pv}$ is the nominal capacity of PV array; $f_{pv}$ is the PV module efficiency; $\alpha_T$ is the coefficient of the temperature of power (%/°C); which is between -0.5%/°C and -0.3%/°C in crystalline silicon [17]. $G$ is the solar radiation on a tilted plan module ($kW/m^2$), $G_{SC}$ is the solar radiation at standard conditions ($1kW/m^2$). $T_{pv}$, $T_{pv,STC}$ These are the temperature of the PV module and the temperature of the PV module at standard conditions (25 °C), respectively.
When PV power exceeds demand, the PV system has to sell the excess energy to grid. According the following equation:
$$E_{Sold} = E_{PV} - E_{demand} \tag{11}$$
When, electrical need exceeds PV energy, therefore, the PV system could not to address the needs of farm, and then, the energy required must be purchased by grid.
$$E_{grid} = E_{demand} - E_{PV} \tag{12}$$
The energy consumed by the farm during 8760h, and the Energy Efficiency are calculated according to the following equations:
$$E_{8760} = E_{PV} + E_{grid} \tag{13}$$
$$EE = \frac{E_{PV}}{E_{8760}} \tag{14}$$
Where, $E_{pv}$ is the energy produced by PV system (kWh/yr), $E_{grid}$ the energy consumed by grid (kWh/yr), RF is the Renewable Fraction, $E_{8760}$ is the energy consumed by the farm (kWh/yr).
The Cost of the Photovoltaic Installation
We will use a simplified method of calculation of the cost of photovoltaic installation. First, we calculated the life cycle cost LCC analysis uses a combination of the initial capital cost, operation, maintenance costs and replacement costs. The life cycle cost can be calculated using the following formula:
$$C_{ann,tot} = C_{acap} + C_{aO&M} + C_{arep} - C_{sal} \tag{15}$$
Where, $C_{acap}$ is the annualized capital cost ($$), $C_{aO&M}$ is the operation and maintenance costs ($$/yr), $C_{arep}$ is the salvage costs ($$)[18, 19].
The annualized capital cost can be calculated by following equation [18]:
$$C_{acap} = C_{cap}CRF(i, R_{proj}) \tag{16}$$
Where, $C_{cap}$ is the initial capital cost of the component ($$).
CRF capital recovery factor, $i$ is the interest rate, $R_{proj}$ is the project lifetime.
The capital recovery factor can be calculated by following equation [18]:
$$CRF(i, N) = \frac{i(1+i)^N}{(1+i)^N - 1} \tag{17}$$
Where, $i$: real interest rate, $N$: Number of year.
HOMER uses the following equation to calculate each component’s annualized replacement cost [18]:
$$C_{arep} = C_{rep}f_{rep}SFF(i, R_{comp}) - S.SFF(i, R_{proj}) \tag{18}$$
Where SFF: Sinking Fund factor.
$f_{rep}$, a factor arising because the component lifetime can be different from the project lifetime, is given by [18]:
$$f_{rep} = \begin{cases} \frac{CRF(i, R_{proj})}{CRF(i, R_{rep})} & R_{rep} > 0 \\ 0 & R_{rep} = 0 \end{cases} \tag{19}$$
$R_{rep}$, the replacement cost duration, is given by [18]:
$$R_{rep} = R_{comp}INT\left(\frac{R_{proj}}{R_{comp}}\right) \tag{20}$$
Where INT $\left(\frac{R_{proj}}{R_{comp}}\right)$ is the integer function, returning the integer portion of a real value.
HOMER assumes that the salvage value of the component at the end of the project lifetime is proportional to its remaining life. Therefore the salvage value $S$ is given by [18]:
$$S = C_{rep}\frac{R_{rem}}{R_{comp}} \tag{21}$$
Where $R_{rem}$, the remaining life of the component at the end of the project lifetime, is given by [18]:
$$ R _ {r e m} = R _ {c o m p} - \left(R _ {p r o j} - R _ {r e p}\right) \tag {22} $$ comp R : Lifetime of the component, proj R : project lifetime.
The total net present cost of a system is the present value of all the costs that it incurs over its lifetime, minus the present value of all the revenue that it earns over its lifetime. Costs include capital costs, replacement costs, O&M costs, fuel costs, emissions penalties, and the costs of buying power from the grid. Revenues include salvage value and grid sales revenue.
HOMER calculates the total net present cost using the following equation [18]:
$$ C _ {N P C} = \frac {C _ {a n n , t o t}}{C R F \left(i , R _ {p r o j}\right)} \tag {23} $$ , , ann tot NPC ( ) proj And for cost of energy is calculated by [18]:
$$ C O E = \frac {C _ {a n n , t o t}}{E _ {d e m a n d}} \tag {24} $$
, ann tot demand
Results and Discussion
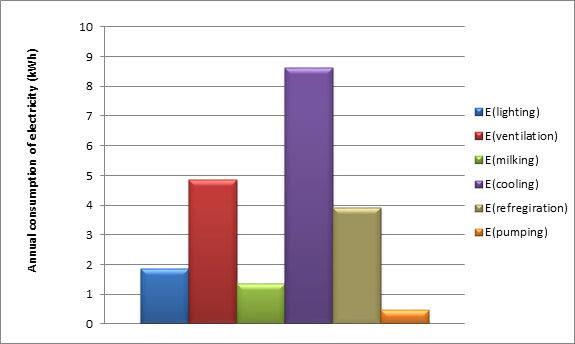
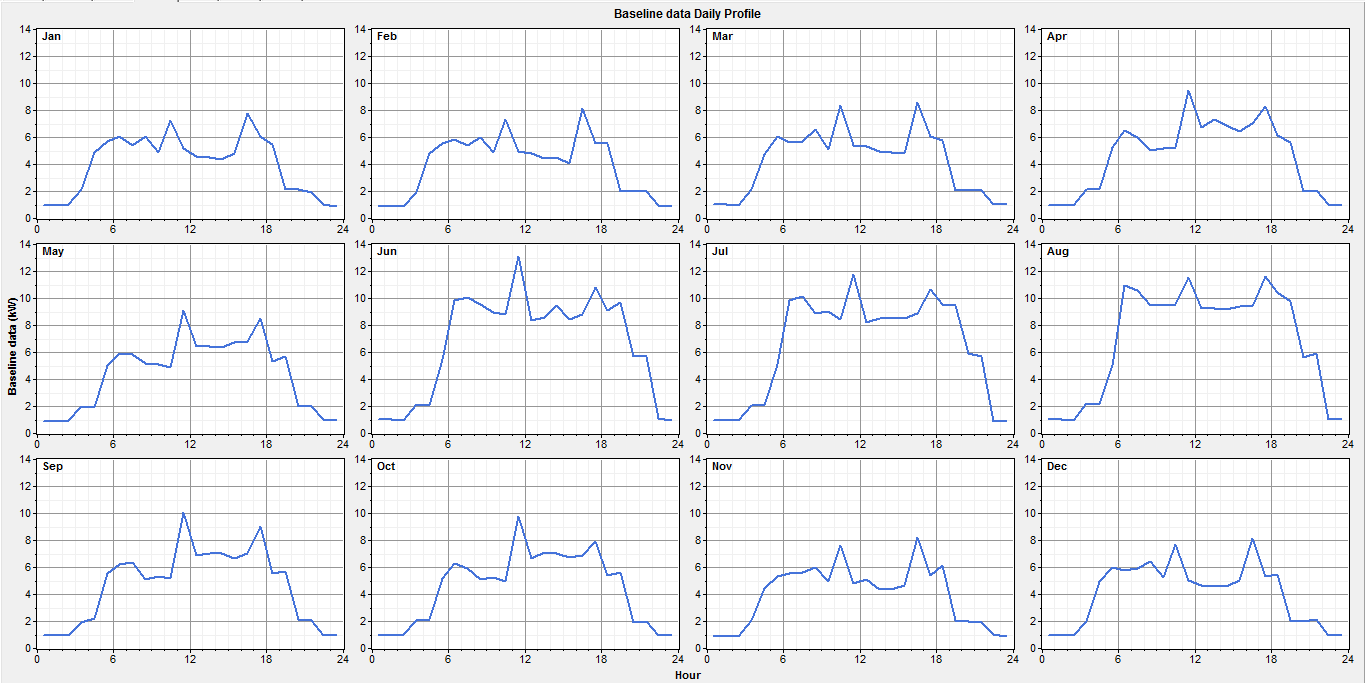
The average annual consumption of electrical energy for the farm Figure 4, was calculated using the equations derived above. The high consumption of electricity is meant for cooling equipments, where it was estimated at 8.64kWh/yr, which included three cooling tanks from 330 liter. As well we have annual electricity consumption equal to 4.87kWh/yr, destined to the ventilation; it was precisely because we want to minimize stress of the cows, consequently, milk production increases. Whereas, the lower energy consumption for pumping, because, we have just one water pump , which is used only to ensure clean water for cows, and for hygiene applications, which equals 0.87kWh/yr. on the other hand, refrigeration equipments consumes around 3.92kWh/yr, respectively, which included one positive cold room with an continuous operation. And then, the average consumption of electricity for milking was estimated at 1.37kWh/yr, that we have five vacuum pumps (550 W). For lighting, the average consumption of electricity was estimated at 2.07kWh/ yr, and we have opted for the fluorescent lighting because they consume less energy, whereas, we avoided using an incandescent lighting because consume more energy, also emit a significant amount of heat [20].
The farm’s consumption is divided in three parts, according to the following illustration Figure 5:
Small Consumptions (January, February, Mars, November, December)
During the day, we have a three milking per day, and the milking process can take from 1 hour to 1:30 hour, and just after, it takes a cooling and storage of milk before the sale, in addition, the operation of the other equipments (lighting, pumping, and refrigeration) except for the ventilation.
Therefore, the daily consumption is 99.09kWh/day, in the night the consumption is almost null. Medium Consumption (April, May, September, October) In this period, the daily consumption could up to 110.84kWh/day. In addition to milking, cooling and storing milk, lighting, pumping, and refrigeration, we also need ventilate the barn from 12:00 P.M to 17:00 P.M, because at that time the temperature can rise to 39°C.
High consumption ( June, July, August)
Nothing will change for the consumption of this period, except the time of the ventilation increases, from 5 hours to about 16 hours, because this region is characterized hot summers. Therefore, the daily consumption is estimated at 157.59kWh/day.
The peak power of the PV system is PP= 37.83kWP (equation 2), the monthly average temperatures, and the daily radiations, are used to the simulation with HOMER software, we have four power of PV system (25, 30, 35, 40 kW), four power of converter (25, 30, 35, 40 kW), and a single power of grid (1000kW), that give 16 simulation results, they are shown in the following Figure 6.
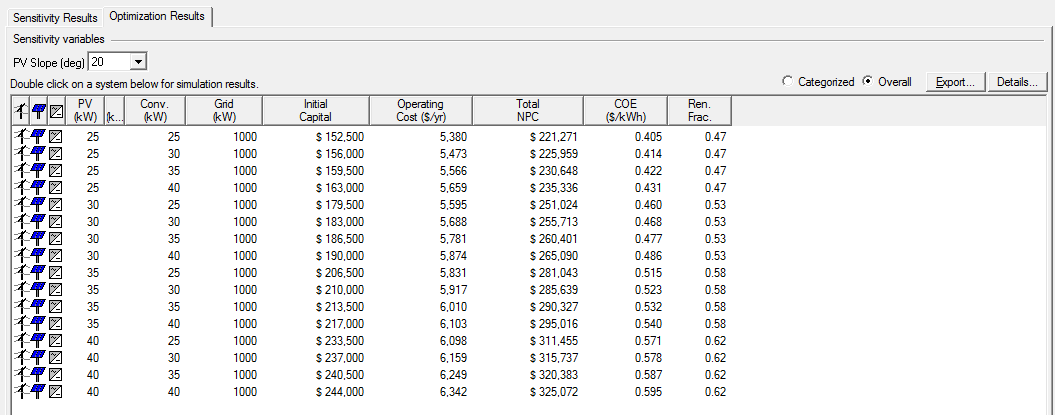
The tilt angle of 20° has given a best value of renewable fraction RF, and then a best production of PV energy, if we compare them with 25°, 30°, and 35°. After having the optimal tilt, we have therefore simulated the grid-PV system with different PV powers; we have opted for a PV system power which allowed the equality between the total production of PV system, and the total consumption from the grid, in the year. The Table 2 below summarizes our main results of simulation, the four power of PV system (25, 30, 35, 40 kW), the total production of PV system, the total consumption from the grid, the renewable fraction, and the annual consumption of the farm. We found that the 30 kWp can generate a production of PV system nearly equal to grid energy consumption, where, 53% produced by PV array and 47% of grid purchases.
| PV system power (kWp) | PV energy (MWh/yr) | Grid energy (MWh/yr) | Total production (MWh/yr) | Renewable fraction (%) | Farm consumption (MWh/yr) |
|---|---|---|---|---|---|
| 25 | 23.786 | 26.873 | 50.659 | 47 | 42.705 |
| 30 | 28.543 | 25.447 | 53.99 | 53 | 42.705 |
| 35 | 33.3 | 24.297 | 57.597 | 57 | 42.705 |
| 40 | 38.057 | 23.35 | 61.407 | 62 | 42.705 |
Table 2: The variation of the renewable fraction according to the photovoltaic power.
When we made the annual energy balance for 30kWp, we have the following results shown in table (2). The amount of energy supplied from PV-grid system is 53.99MWh/yr, 28.543 MWh/yr was generated from the PV array, and 25.44MWh/ yr is the amount of electricity purchased by the grid. On the other hand, the energy injected into the grid was estimated at 8.43MWh/yr, while, the annual energy consumption of the farm was estimated at 42.70MWh/yr, and the renewable fraction is found equal to 53%.
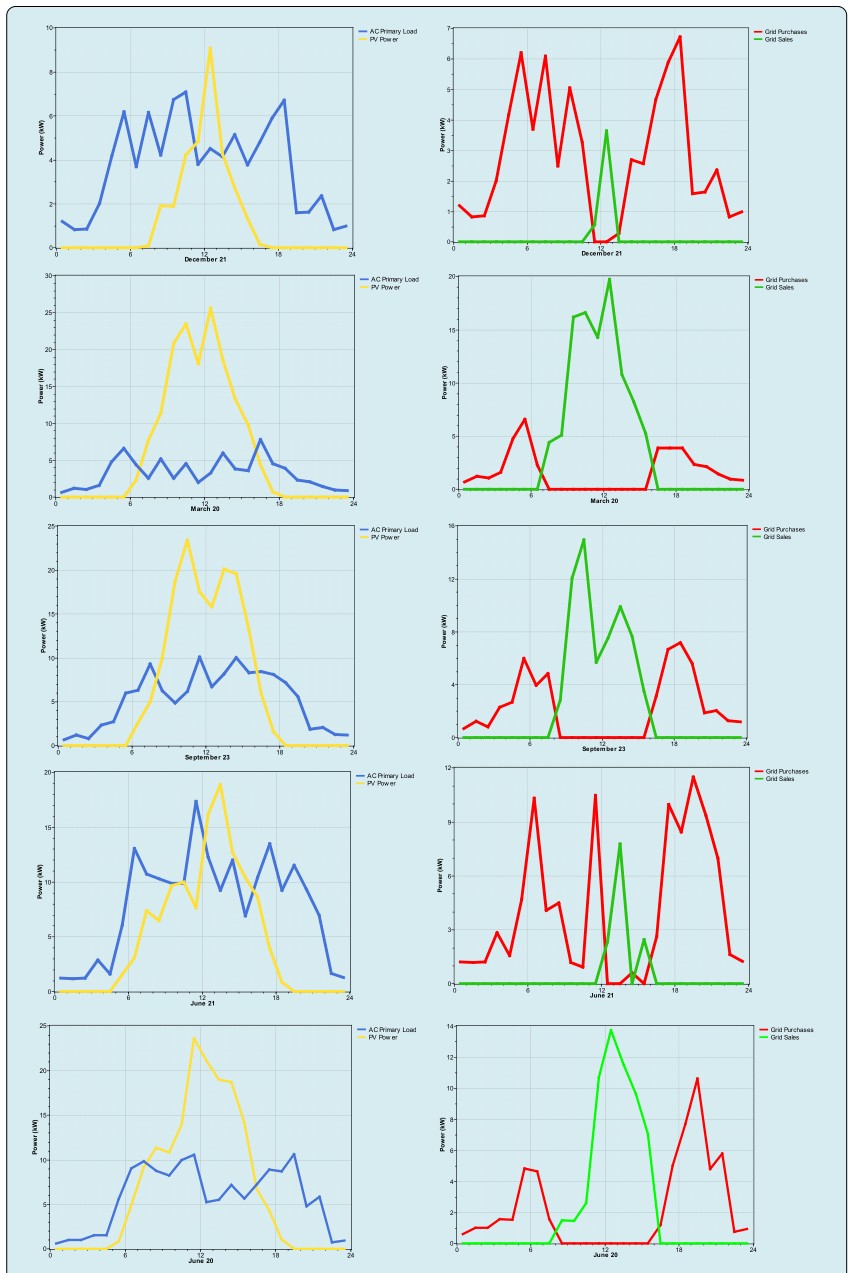
The hourly photovoltaic and grid energy consumption, and the energy sold to grid of each period, were illustrated in Figure 8. For 21th December, from 00.00 to 06.00 a.m, and from 18.00 p.m to 00.00, there was no photovoltaic energy production, therefore, we will need to purchase from grid. From 09.00 a.m to 16.00 p.m, there is a production of photovoltaic energy, at 12:00 thr EPV is higher than the load of the farm; we must therefore to sell to grid. However, the purchased energy is higher than the sold energy.
For 20th March and 23th September, from 00.00 to 06.00 a.m, and from 17.00 p.m to 00.00, there was no photovoltaic energy production, therefore, we will need to purchase from However, the monthly average electrical productions by PV array of 30kWP, and the purchased energies from the grid, are shown in Figure 7. We found that the PV system of 30kWp covers over half of the farm load within 7 months (Marsh, April, May, June, July, August, and September), in fact, there was also the PV energy production, within the following 5 months, January, February, October, November, and December, but it is not sufficient. This is because, the duration of sunshine in summer is very important compared to winter.
PV Grid
grid. While, from 07.00 a.m to 17.00 p.m the photovoltaic energy is higher than the load of the farm; we must therefore to sell to grid. Thus, the sold energy is significantly higher than the purchased energy.
For 20th June, from 00.00 to 05.00 a.m and from 19.00 p.m to 00.00, there was no photovoltaic energy production, therefore, we will need to purchase from grid. While, from 07.00 a.m to 17.00 p.m the photovoltaic energy is higher than the load of the farm; we must therefore to sell to grid. Thus, the sold energy is significantly higher than the purchased energy.
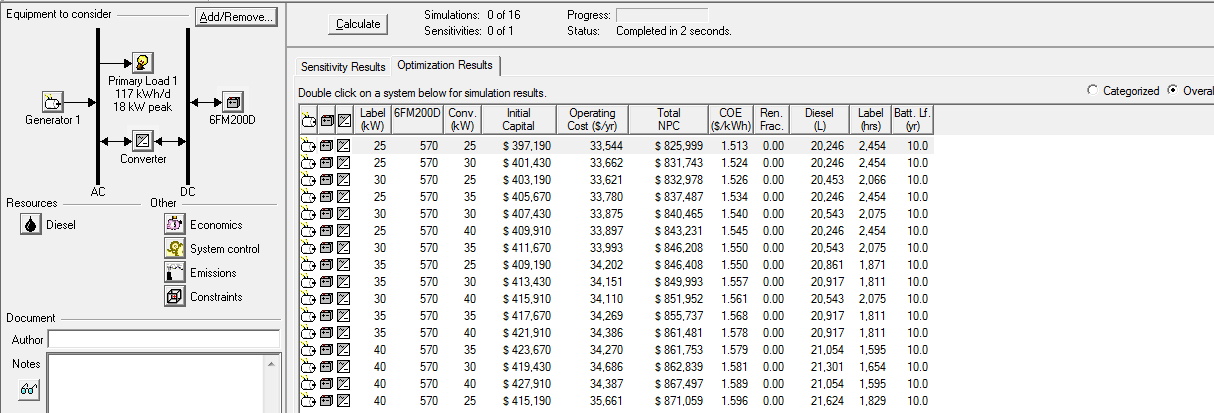
Autonomous Diesel System
We have proposed a second system which is the autonomous diesel system, to compare them with the PV- grid system. The simulation results in Figure 9, show that the lowest net present cost (NPC) was estimated at $826, with a cost of energy (COE) of 1.51$/kWh, and the annual diesel consumption is 20,24Liter/yr, where, the number of hours worked is 2,45 hours, which reduces the lifetime of generator, while, the highest net present cost (NPC) of PV- Grid system is 233$, and the cost of energy (COE) is 0.42$/ kWh, Knowing we took the size of an array at 40 W instead of 30W. Therefore, the diesel system is not economical, which confirms and shows the interest of the PV-grid system. In addition, negative environmental impacts resulting from the diesel system such as greenhouse gas emissions (Table 3).
| PV-Grid | Diesel | Farm consumption (MWh/yr) | ||||
|---|---|---|---|---|---|---|
| Power (kW) | Total NPC ($) | COE ($/yr) | Power (kW) | Total NPC ($) | COE ($/yr) | 42.7 |
| 40 | 233 | 0.4 | 25 | 826 | 1.5 |
Table 3: The economic comparison between the Diesel system and the Grid-PV system.
Conclusion
The purpose of this article is to conduct a real study on the feasibility and efficiency of Grid connected PV system on a dairy farm, in Tlemcen province. It’s a typical farm that consumes about 42.34 MWh / year of electrical energy. On this basis, the system was dimensioned using the HOMER software, to feed this farm. A Grid connected PV system of 30W could produce 54.03 MWh/yr, with Renewable Fraction of 53%, and 28.54kWh/yr was generated from the PV array, and 25.44kWh/yr is the amount of electricity purchased by the grid, while, the energy injected into the grid was estimated at 8.43MWh/yr.
And to show the feasibility of this system we have proposed another system based on diesel generator, so that we can economically compare between the two systems, the lowest net present cost (NPC) of Diesel system of 25kW was estimated at $826, with a cost of energy (COE) of 1.51$/kWh, while, the highest net present cost (NPC) of PV-Grid system (40kW) is 233$, and the cost of energy (COE) is 0.42$/kWh. We can therefore conclude that the PV system is an economic and promising approach to develop agriculture in Algeria and the Mediterranean countries, in addition, to save the planet from pollution for future generations.
References
-
(2015) Evolution de l’Energie Produite par les Centrales Electriques, Algerian Ministry of Energy and Mining.
-
(2015) SONELGAZ Société Nationale de l′Electricité et de Gaz. Rapports d′activités et comptes de gestion consolidés 2007, 2008, 2009, 2010, 2011 et 2012.
-
(2017) Agence Nationale de Développement de l′Investissement ANDI.
-
Stambouli AB (2011) Promotion of renewable energies in Algeria: strategies and perspectives. Renew Sustain Energy Rev 15(2): 1169-1181.
-
Delaval (2006) Guide du confort de la vache Delaval. pp : 3-75.
-
Ludington D, Johnson E (2003) Dairy farm energy audit summary. New York State Energy Research and Development Authority (NYSERDA). Albany, USA.
-
Maammeur H, Hamidat A, Loukarfi L, Missoum M, Abdeladim K, et al. (2017) Performance investigation of grid-connected PV systems for family farms: case study of North-West of Algeria. Renewable and Sustainable Energy Reviews 78: 1208-1220.
-
Nacer T, Hamidat A, Nadjemi O, Bey M (2016) Feasibility study of grid connected photovoltaic system in family farms for electricity generation in rural areas. Renewable Energy 96(part A): 305-318.
-
Bey M, Hamidat A, Benyoucef B, Nacer T (2016) Viability study of the use of grid connected photovoltaic system in agriculture: Case of Algerian dairy farms. Renewable and Sustainable Energy Reviews 63: 333-345.
-
Chel G, Kaushik (2011) Renewable energy for sustainable agriculture. Agron Sust Dev 31: 91-118.
-
Bayrakcı AG, Kocar G (2012) Utilization of renewable energies in Turkey’s agriculture. Renew Sustain Energy Rev 16(1): 618-633.
-
Houston C, Gyamfi S, Whale J (2014) Evaluation of energy efficiency and renewable energy generation opportunities for small scale dairy farms: a case study in Prince Edward Island, Canada. Renew Energy 67: 20-29.
-
Nacer T, Hamidat A, Nadjemi O (2015) Techno-economic impacts analysis of a hybrid grid connected energy system applied for a cattle farm. Energy Procedia 75: 963-968.
-
Beckman J, Xiarchos IM (2013) Why are Californian farmers adopting more (and larger) renewable energy operations. Renew Energy 55: 322-330.
-
Shen X, Zhang G, Wu W, Bjerg B (2013) Model-based control of natural ventilation in dairy buildings, Comput Electron Agric 94: 47-57.
-
Tudisca S, Di Trapani AM, Sgroi F, Testa R, Squatrito R (2013) Economic analysis of PV systems on buildings in Sicilian farms. Renewable and sustainable energy reviews 28: 691-701.
-
Fuentes M, Nofuentes G, Aguilera J, Talavera DL, Castro M (2007) Application and validation of algebraic methods to predict the behaviour of crystalline silicon PV modules in Mediterranean climates. Sol Energy 81: 1396-1408.
-
www.homerenergy.com
-
Bélanger-Gravel J (2012) Analyse technico-économique d’un système hybride éolien-photovoltaïque en comparaison avec les systèmes photovoltaïque et éolien seuls. Ecole Polytechnique, Montreal Canada, pp: 1-198.
- Sense, Gravity, Parity & Chirality in Mathematical Physics
- Quantum Lattice Simulations PHYSICS: Microcircuit Particle Formation and Observable Macroscopic Irreversible Time - A Discrete Lagrangian with Cellular Automata Framework
- Quantum Biology from Biomacromolecule to Cell, and Central Dogma Described by Quantum Theory
- Focus, Agility, Speed and Technology (FAST) for Sustainability and Growth
- Square Root Metric Geometry and Pati-Salam Model in Curved Space-Time
- A Simple System Demonstrating the Mpemba Effect in Classical Mechanics