Studying Some of Physical Properties of a Lead Doping Titanium Dioxide TiO₂: Pb with Different Ratios
Titanium dioxide TiO2 has witnessed great interest in international research laboratories due to its excellent properties. To study the changes in its physical properties, the structural properties of pure and lead-doped titanium dioxide powder samples were examined with different ratios (x = 0.2 - 0.5 - 0.7 - 0.9 g). The results of X-ray diffraction showed the participation of samples of anatase and rutile of the tetragonal crystal system and brookite of the orthorhombic crystal system based in the titanium dioxide compound with the peaks corresponding to the crystalline levels (110), (012), (040), (111), (211), (123), (112)The preferred orientation is (110) in all pure and doped samples. The relative intensities, distance between crystalline planes (d), crystal size (D), lattice parameters (a), (b) and (c), Initial cell size (V), dislocation density (δ), and theoretical density of the X-ray diffraction spectrum for the powders (ρX-ray) were determined, and the number of atoms of a substance per unit volume (n) and the average distance between atoms (L).
Introduction
Titanium dioxide TiO2 has gained great attention, especially under the conditions of the COVID-19 pandemic. After the sun’s rays fall on this material, active oxygen is generated, which in turn purifies water from pollutants, bacteria, fungi, germs, organic materials, as well as toxic elements such as arsenic As and Chromium Cr [1, 2, 3]. Titanium was first discovered in 1971 by an English chemist and geologist William Gregor And years later, titanium dioxide TiO2 was manufactured for use as a whitening ingredient used in toothpastes, a multifaceted compound used as a strong photocatalyst capable of breaking any organic compound if exposed to the sun [4, 5, 6, 7, 8, 9, 10, 11, 12, 13, 14, 15], and therefore can be used in cleaning and bleaching fabrics and purifying water / waste water and air [16] and in many other industrial applications such as the iron, electronics and chemicals industry, all the way to the manufacture of cosmetics, batteries and solar cells [17] and hydrogen production because of its important physical and chemical properties. It has chemical stability and is chemically non-toxic [2, 3] and a high static permittivity, and is characterized by an Eg energy gap ranging between 3.04-3.46 eV [18], as it has A high resistivity estimated at 1012 Ω.cm at a temperature of 25C°. It also has high transparency in the visible field, high refractive index, and high luminescence, which expands its uses as a paint in all types of paint and as a food additive for pharmaceutical materials [7, 19]. Titanium dioxide TiO2
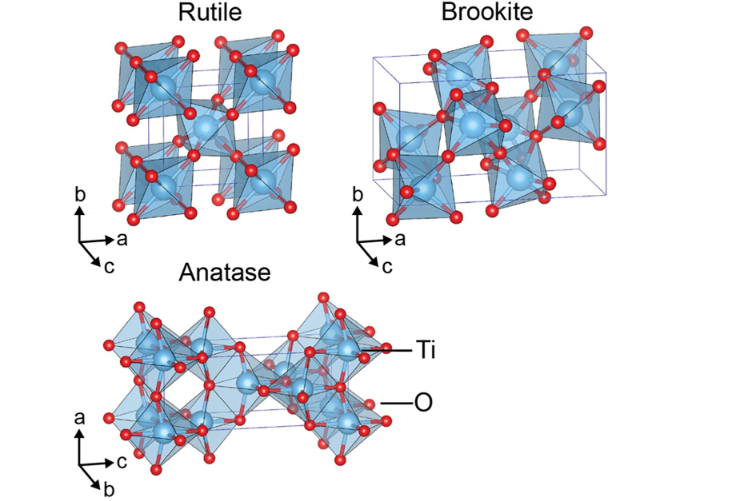
also has structural properties, as it is found under different crystalline phases: Anatase with a tetragonal crystal system, brookite with a orthorhombic crystal system, and rutile with a tetragonal crystal system as in Figure 1 [20].
All of these properties have expanded its uses in the modern era to include gas detectors such as H2 , O2, CO and C2H5OH [21] and in medicine such as artificial heart valve and semiconductors and storing capacitors in dynamic random memories and in integrated circuits and assistants. We chose the Pb element as an impurity in the compound TiO2 and it is an element known since ancient times. Statues and tools made of it were found in the tombs of the ancient Egyptians, as were found in antiquities dating back to the Aegean civilization 1400-1100 BC [22] in southern Greece Figure 2 shows some of its physical properties that distinguish it from the rest of the elements.
In this research, we prepared samples of leaded titanium dioxide in different proportions, Pb:TiO2, and then we crushed these samples separately, sieved them and calcined them from 0 C° to 200 C° to remove moisture and used X-ray diffraction device (XRD) in order to study the properties The structural properties of these samples in order to improve the physical properties and expand the effectiveness and areas of use of titanium dioxide after many researchers have doped it with different chemical elements and compounds using each of the XRD, SEM, DRS, EDS, FT-IR devices and others, which showed the displacement of the radiation absorption field from ultraviolet rays to include raising the efficiency of absorption of these rays as well as light rays, narrowing the band gap, and thus increasing the photocatalytic property [23], electrical conductance and other electronic, physical and microscopic properties [2, 4, 7, 10, 12, 13, 14, 15, 18, 19, 24, 25, 26].
Experimental Method
We weighed powders of pure and lead doped TiO2 with different ratios according to (x = 0.2 – 0.5 – 0.7 – 0.9 g) Ti1-x PbxO2 using solid-state interaction method [27] and [28], and it was mixed and crushed well using (Agate mortar and pestle) to turn it into powders very fine and then sieved through a sieve giving the size of the opening of the sieve 90 microns. The mixtures were ground for two hours for all powder samples in order to obtain a homogeneous and well-distributed powder. To remove moisture, the crushed samples were heated to 200 °C by an incinerator, as all the preparation process took place in the physics and chemistry laboratories at the Faculty of Science at Tishreen University.
Results and Discussion
X-ray Diffraction Test
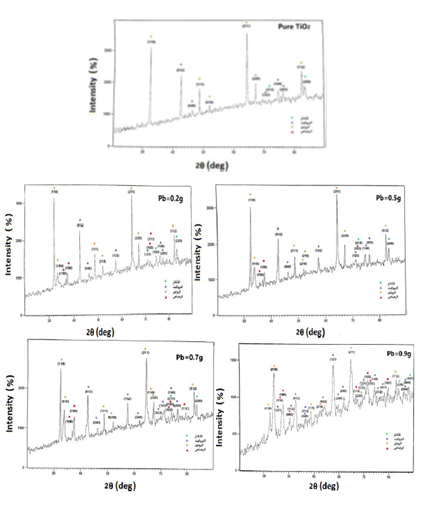
The XRD pattern show the participation of all the undoped and Pb doped TiO2 powders with the peaks corresponding to the crystalline levels (110), (012), (040), (111), (211), (123), (112), (220). Preferred orientation is (110) in all undoped and Pb doped samples, while the peaks corresponding to levels (210), (213), (160), (203) disappear or shift in The similar sample whose percentage of lead equals 0.9 g, while the corresponding peak of the level (220) disappears or shifts in the similar sample whose percentage of lead equals 0.7 g. It was also noted with different doping ratios that there is an absence of some peaks corresponding to pure titanium dioxide and the appearance of new peaks due to lead impurity (Figure 2).
We calculated the relative intensity of the pure and lead-dominated TiO2 powders. The distance values between crystal planes were calculated using the following Bragg’s law [29]:
2d sin = n θ λ (1)
Where d is the distance between crystal planes in angstroms (A°) and θ is Braggs’s angle in radians (rad) and ë is the wavelength of the x-rays ( ë = 1.78897 A°) and we calculated the crystallite size from Scherrer’s quation [30]:
cos k D λ β θ = (2)
where D is the crystal size in nanometer (nm).
K is Scherrer’s constant, so for a cubic crystal system it takes the value 0.94, and for a non-cubic crystal system it takes the value 0.89 and therefore the value we use is the last value [31].
λ is the wavelength of x-rays measured in angstrom (A°). β is the full width at half maximum intensity (FWHM) measured in radians.
θ is the Braggs’s angle, also measured in radians.
The dislocation density ä is defined as the length of the dislocation lines per unit volume and is calculated from the following equation [32]:
1
2 D δ = (3)
The lattice constants a (A°), b (A°) and c (A°) a for the tetragonal crystal system of the anatase, rutile and orthorhombic crystal system of the brookite phase were determined from the equations (4) and (5), respectively [18] & [33]:
2 2 2
2 2 2 2 1 h k l d a b c = + + (5)
where a = b ≠ c; for anmatase and rutile phases just .
where d is the distance between two successive one angstroms of crystal planes in angstroms (A°) and (hkl) are the Miller indices. The grid constants a (A°), b (A°) and c (A°) a given in Tables 1, 2, 3 were also calculated, which match well with the JCPDS data. were also calculated, for brookite,( a = 5.455 A°, b = 9.18 A°, c = 142 A°), and for rutile (a = b = 4.593 A°, c = 2.959A°), and for anatase (a= b = 3.785 A°, c = 9.513 A°), and for lead Pb(a= b=3.265 A° , c = 5.387 A°) . The change in peak intensity is mainly due to the replacement of Ti+4 ions by Pb+4 ions in the TiO2 lattice. We also computed initial cell size from relation [34]:
V = a . b . c (6)
where a , b , c are the crystal lattice constants given in Tables 2-6.
This process leads to the movement of Pb+4 ions into the substitution sites. It was observed that the increase in the doping ratio increases the size of the primary cell, the size of the crystal, the relative intensity, and the density of the dislocation decreases, and this is consistent with the researchers [26] and [35]. We observed from Tables 2, 3 & 4 that 0.2g lead-doped TiO2 is the closest value to the undoped sample.
| Sample | 2θ (deg) | (hkl) | d (A°) | Rel. Int. (%) | β (deg) | D (nm) | D (nm) | δ 1015 Line/m2 | Lattice Constants for Phases | Phases Cell Size V(A°)3 | ||
|---|---|---|---|---|---|---|---|---|---|---|---|---|
| a (A°) | b (A°) | c (A°) | ||||||||||
| Pure TiO 2 | 32.1 | (110) | 3.236 | 100 | 0.4 | 23.732 | 1.776 | |||||
| 42.355 | (012) | 2.477 | 25 | 0.355 | 27.559 | 118.236 for anatase | 1.317 | |||||
| 46 | (040) | 2.29 | 5 | 0.3 | 33.035 | 0.917 | 3.794 | 3.794 | 9.408 | 135.352 for anatase | ||
| 48.5 | (111) | 2.178 | 25 | 0.4 | 25.014 | 1.599 | ||||||
| 51.8 | (210) | 2.048 | 10 | 0.2 | 50.706 | 40.303 Lilbrooke | 0.389 | |||||
| 64.4 | (211) | 1.679 | 60 | 0.25 | 43.123 | 0.538 | 5.539 | 9.16 | 5.139 | 260.74 Lilbrooke | ||
| 67 | (220) | 1.621 | 20 | 0.4 | 27.35 | 1.337 | ||||||
| 71 | (123) | 1.541 | 7 | 0.25 | 44.822 | 35.08 Lalrutel | 0.498 | |||||
| 73.7 | (213) | 1.492 | 4 | 0.1 | 114.003 | 0.077 | ||||||
| 74.9 | (160) | 1.472 | 4 | 0.2 | 57.456 | 64.54 For Phases Togather | 0.303 | 4.577 | 4.577 | 2.946 | 61.72 Lalrutel | |
| 76.2 | (203) | 1.45 | 12 | 0.3 | 38.642 | 0.67 | ||||||
| 83 | (112) | 1.35 | 12 | 0.3 | 40.602 | 0.607 | ||||||
| 83.7 | (220) | 1.341 | 60 | 0.1 | 122.468 | 0.067 |
Table 1: The results of the structural values of pure TiO2 sample.
Lattice Constants for Phases Phases Cell Size V(A°)3 a(A°) b(A°) c(A°)
- Sample
- 2θ δ 1015 β (deg)
- (hkl) d(A°) Rel. Int.
- (%)
- D (nm)
- D (nm)
- Line/m2 (deg)
- 32.1
- (100) 3.236
- 100
- 0.425
- 22.355
- 2.002
- 33.6
- (110) 3.095
- 100
- 0.03
- 317.642
- 0.01
- 36.7
- (100) 2.842
- 75
- 0.1
- 96.113
- 0.109
- 37.4
- (100) 2.79
- 75
- 0.2
- 48.155
- 82.696
- Anatase
- 0.432
- 3.793
- 3.793
- 9.408
- 135.352
- 42.36 (012) 2.477
- 25
- 0.3
- 32.612
- 0.941
- 46
- (040) 2.29
- 5
- 0.18
- 55.058
- 0.33
- 48.5
- (111) 2.178
- 25
- 0.5
- 20.011
- 2.498
- 51.8
- (210) 2.048
- 10
- 0.1
- 101.412
- 47.849
- Brookite
- 0.098
- 57.7
- (210) 1.854
- 10
- 0.2
- 52.077
- 0.369
- 64.4
- (211) 1.679
- 60
- 0.3
- 35.936
- 0.775
- Lead-doped
- TiO2(x=0.2g)
- 67
- (220) 1.621
- 20
- 0.24
- 45.583
- 0.482
- 5.539
- 9.16
- 5.146
- 261.094
- Brookite
- 71
- (123) 1.541
- 7
- 0.18
- 62.253
- 0.259
- 71.9
- (512) 1.524
- 5
- 0.24
- 46.954
- 83.105
- Rutile
- 0.454
- 72.4
- (103) 1.515
- 20
- 0.12
- 94.207
- 0.113
- 73.7
- (013) 1.492
- 4
- 0.18
- 63.335
- 0.25
- 4.577
- 4.577
- 2.945
- 61.695 Rutile
- 74.9
- (160) 1.472
- 4
- 0.18
- 63.839
- 0.246
- 76.2
- (203) 1.45
- 12
- 0.22
- 52.694
- 0.361
- 83
- (112) 1.35
- 12
- 0.28
- 43.502
- 0.529
- 83.7
- (220) 1.341
- 6
- 0.12
- 102.057
- 0.961
Table 2: Results of the structural values of the lead-doped TiO2 sample (x = 0.2 g).
- (deg)
- (hkl) d(A°)
- Rel.
- Int.
- (%)
- Sample
- 2θ δ 1015 β
- D (nm)
- D (nm)
- Line/m2 (deg)
- 32.1
- (110) 3.236 100
- 0.3
- 31.642
- 0.999
- 33.6
- (110) 3.095 100
- 0.3
- 31.765
- 0.992
- 3.793
- 3.793
- 9.408
- 135.352
- Anatase
- 36.7
- (100) 2.842 75
- 0.05
- 192.226 88.324 Anatase
- 0.028
- 37.4
- (100) 2.79
- 75
- 0.2
- 48.155
- 0.432
- 42.355 (012) 2.477 25
- 0.2
- 48.917
- 0.418
- 46
- (040) 2.29
- 5
- 0.2
- 49.552
- 0.408
- 48.5
- (111) 2.178 25
- 0.3
- 33.352 99.547 Brookite
- 0.899
- 5.539
- 9.16
- 5.146
- 261.094
- Brookite
- 51.8
- (210) 2.048 10
- 0.1
- 101.412
- 0.098
- 52.3
- (411) 2.03
- 7
- 0.1
- 101.628
- 0.097
- 57.7
- (132) 1.854 18
- 0.4
- 26.039
- 1.475
- 64.4
- (211) 1.679 60
- 0.2
- 53.904
- 0.345
- 67
- (220) 1.621 20
- 0.1
- 109.398
- 48.382 Rutile
- 0.084
- 71
- (103) 1.541 20
- 0.15
- 74.704
- 0.18
- 72.4
- (103) 1.515 20
- 0.08
- 141.311
- 0.051
- 73.7
- (213) 1.492
- 4
- 0.12
- 95.002
- 0.111
- 4.577
- 4.577
- 2.945
- 61.695
- Rutile
- 74.9
- (160) 1.472
- 4
- 0.05
- 229.821
- 78.752 For phases togather
- Lead -
- Doped TiO2
- (x=0.5g )
- 0.019
- 76.2
- (203) 1.45
- 12
- 0.2
- 57.963
- 0.298
- 83
- (112) 1.35
- 12
- 0.2
- 60.559
- 0.273
- 83.7
- (220) 1.341
- 6
- 0.15
- 81.646
- 0.151
- Sample
- 2 θ δ 1015 β (deg)
- (hkl)d(A°) Rel. Int.
- (%)
- D (nm)
- D (nm)
- Line/m2 (deg)
- 32.1
- (110)3.236
- 100
- 0.3
- 31.642
- 0.999
- 33.6
- (110)3.095
- 100
- 0.6
- 15.883
- 3.965
- 36.7
- (100)2.842
- 75
- 0.3
- 32.038
- 89.735
- Anatase
- 0.975
- 37.4
- (100) 2.79
- 75
- 0.4
- 24.078
- 1.725
- 42.355 (012)2.477
- 25
- 0.3
- 32.611
- 0.941
- 3.793 3.793 9.408
- 135.352
- Anatase
- 46
- (040) 2.29
- 5
- 0.4
- 24.776
- 1.63
- 48.5
- (111)2.178
- 25
- 0.24
- 41.69
- 49.802
- Brookite
- 0.576
- 51.8
- (210)2.048
- 10
- 0.34
- 29.827
- 1.125
- 57.7
- (132)1.854
- 18
- 0.2
- 52.077
- 0.369
- 62.3
- (240) 1.73
- 3
- 0.2
- 53.298
- 0.353
- 64.4
- (211)1.679
- 60
- 0.21
- 51.337
- 0.38
- 5.539
- 9.16
- 5.146
- 261.094
- Brookite
- 66.4
- (110)1.634
- 70
- 0.1
- 109.022
- 0.085
- Lead-doped
- TiO2(x=0.7g)
- 67
- (220)1.621
- 20
- 0.4
- 27.35
- 1.337
- 70
- (123) 1.59
- 7
- 0.1
- 111.366
- 32.598 Rutile
- 0.081
- 71
- (123)1.541
- 7
- 0.4
- 28.014
- 1.275
- 71.9
- (103)1.524
- 20
- 0.12
- 93.908
- 0.114
- 72.4
- (103)1.515
- 20
- 0.21
- 53.833
- 0.346
- 4.577 4.577 2.945
- 61.695 Rutile
- 73.7
- (213)1.492
- 4
- 0.2
- 57.002
- 0.308
- 74.9
- (160)1.472
- 4
- 0.3
- 38.304
- 0.682
- 76.2
- (203) 1.45
- 12
- 0.2
- 57.963
- 57.379
- For phases togather
- 0.298
- 79.5
- (112)1.399
- 35
- 0.2
- 59.327
- 0.285
- 83
- (112) 1.35
- 12
- 0.4
- 30.451
- 1.079
- 83.7
- (220)1.341
- 6
- 0.1
- 122.468
- 0.067
Table 3: Results of the structural values of TiO2 sample doped with lead (x = 0.5 g).
Lattice Constants for Phases Phases Cell Size V(A°)3 a (A°) b (A°) c (A°)
The preferred orientation along the plane (211) for all samples, as the reason for the peak corresponding to the previous plane is due to the presence of crystals from the rutile phase, regardless of the percentage of doping. And we note that brookite crystallizes in the direction (012) for all the pure and lead-doped samples. As for the lead – doped sample by x=0.9g, it crystallizes in the direction (121) and anatase crystallizes in the direction (200) for all samples except the lead - doped sample by x = 0.9g as it crystallizes according to the direction (220) and lead crystallizes according to the direction (100) for all samples except for the sample with a doping ratio of x = 0.9g, it crystallizes according to the direction (110) and the reason is that those samples maintained their direction up to the dopance ratio x = 0.9g is that at that ratio there was the largest increase in crystal size and the largest increase in cell size, and this explains that this alloy is likely to cancel some of the grain boundary when the grains coalesce to form crystals of larger size, as well as canceling the defects that exist after the occurrence of The process of natural growth of crystals and rearrangement of crystal grains , as the grains take enough energy for the natural growth of crystals and arrangement within that lattice, as these limits were impeding the movement of electrons and canceling some of them, the electrical conductivity in the metallic material increases due to diminished for electrical resistance [25].
Sample 2θ β (deg) (hkl) d(A°) Rel. Int. (%)
D (nm) D (nm)
(deg) Lattice Constants for Phases Phases Cell Size V(A°)3 a (A°) b (A°) c (A°)
δ 1015 Line/ m2
- 32.1
- (110) 3.236
- 100
- 0.5
- 18.986
- 2.775
- 33.6
- (110) 3.095
- 100
- 0.6
- 15.883
- 3.965
- 35.7
- (121) 2.919
- 90
- 0.2
- 47.92
- 0.436
- 36.7
- -100 2.842
- 75
- 0.15
- 64.076
- 0.244
- 37.4
- (100) 2.79
- 75
- 0.1
- 96.31
- 0.108
- 39.6
- (002) 2.641
- 30
- 0.2
- 48.479
- 0.426
- 3.793
- 3.793
- 9.502
- 136.704
- Anatase
- 42.355 (012) 2.477
- 25
- 0.2
- 48.917
- 62.565
- Anatase
- 0.418
- 46
- (040) 2.29
- 5
- 0.2
- 49.552
- 0.408
- 46.5
- (112) 2.266
- 8
- 0.1
- 99.289
- 0.102
- 48.5
- (111) 2.178
- 25
- 0.26
- 38.483
- 0.676
- 52.3
- (210) 2.03
- 10
- 0.04
- 254.07
- 0.016
- 53.5
- (032) 1.988
- 16
- 0.2
- 51.08
- 0.384
- 54.5
- (102) 1.954
- 10
- 0.21
- 48.864
- 0.419
- 57.7
- (102) 1.854
- 10
- 0.2
- 52.077
- 0.369
- 61.215 (240) 1.757
- 3
- 0.11
- 96.358
- 0.108
- 61.25 (332) 1.756
- 26
- 0.08 132.515
- 0.057
- 64.4
- (240) 1.679
- 3
- 0.1
- 107.80794.31Brookite 0.087
- 5.539
- 9.16
- 5.146
- 263.428
- Brookite
- 66.4
- (110) 1.634
- 70
- 0.2
- 54.511
- 0.337
- 67
- (220) 1.621
- 20
- 0.05 218.796
- 0.021
- Lead-doped
- TiO2(x=0.9g)
- 70
- (440) 1.56
- 5
- 0.08 139.208
- 0.052
- 71
- (123) 1.541
- 7
- 0.2
- 56.028
- 0.319
- 71.9
- (512) 1.524
- 5
- 0.1
- 112.69
- 0.079
- 72.4
- (103) 1.515
- 20
- 0.1
- 113.049 99.233 Rutile
- 0.079
- 74.9
- (160) 1.472
- 4
- 0.2
- 57.456
- 0. 3030
- 75
- (600) 1.47
- 2
- 0.2
- 57.494
- 0. 3026 4.577
- 4.577
- 2.945
- 61.695 Rutile
- 78.4
- (611) 1.416
- 9
- 0.08 147.149
- 0.047
- 79.5
- (112) 1.399
- 35
- 0.2
- 59.327
- 0.285
- 83
- (112) 1.35
- 12
- 0.3
- 40.602
- 0.607
- 83.7
- (220) 1.341
- 6
- 0.2
- 61.234
- 85.37 For phases togather
- 0.267
- 87.6
- (00)4 1.293
- 2
- 0.1
- 126.393
- 0.063
- 87.8
- (004) 1.29
- 2
- 0.05 253.211
- 0.016
- 88.9
- (107) 1.278
- <2
- 0.2
- 63.896
- 0.245
Table 4: Results of the structural values of TiO2 sample doped with lead (x = 0.9 g).
We also note that with the increase in the ratios of doping, new peaks appeared for the three phases and for lead, and most of the peaks were for the brookite phase among the three phases, which increased with the increase in the ratios of doping. (2θ) with an increase in the doping ratio and the explanation for this displacement is due to the small ionic radius of titanium (0.745 Ao) compared to the ionic radius of lead impurity (11.950 Ao). An ionic diameter greater than 0.8 Ao leads to a decrease in the crystal size of TiO2 due to a decrease in the distance between the crystalline levels (d) and then an increase in the diffraction angle, and thus the displacement of the characteristic peaks towards the right in the diffraction pattern because it has an inverse relation according to Bragg’s law [29] as stated in Pauling’s principle [36, 37, 38].
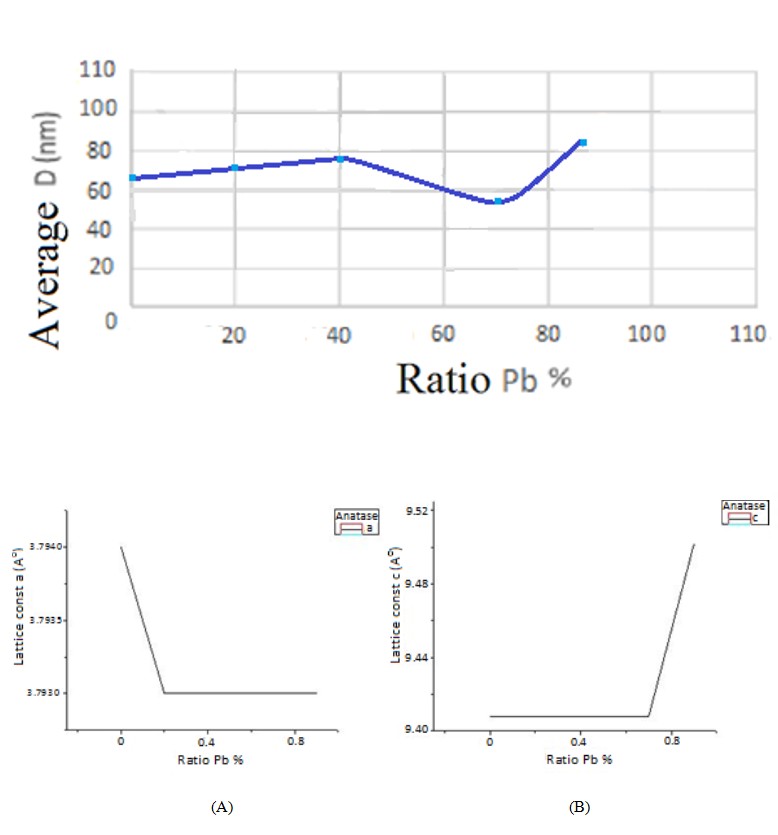
Figure 3 shows that the average crystal size of the 0.2g lead-doped sample is closer to that of the pure sample, However, the decrease in the average crystal size increase of 0.7g compared to the other similar samples and may be due to the linear increase in the average size The crystal starting from the pure compound and passing through each of the doping ratios with 0.5g and 0.2g lead indicates that the impurities effectively prevent the growth of the granules by forming dissimilar boundary regions and because of the increase in the doping ratio that causes the increase in the crystal size and this agrees with the researcher [8] It is known that the increase in the particle sizes reduces the stress in the grain boundaries resulting from the crushing process. These boundaries are suitable locations for the sites of defects and crystal impurities that lead to the enhancement of the electrical resistance and thus the electrical conductivity will increase [12] and Since the phases have no difference in chemical composition between them, while there is a change in the atomic arrangement and crystal orientation across the phase boundaries, the surfaces that separate them are not similar in energy and composition to the grain boundaries with a small inclination angle , It is possible that the presence of crystal defects in the dopant sample with a percentage of 0.7g is the reason for the change of the linear increase, as we noticed a decrease in the crystal size at it (57.379), where we note in Table 4. The decrease in the size of the grains in both brookite and rutile except for anatase [11]. The crystal size of the three phases together falls within the range [57.379- 85.370 nm], distributed over anatase [62.565-118.236 nm], brookite [40.303-94.310 nm] and rutile [35.080-99.233 nm] and this is consistent with the researcher Fouzia A and Bensaha R [26].
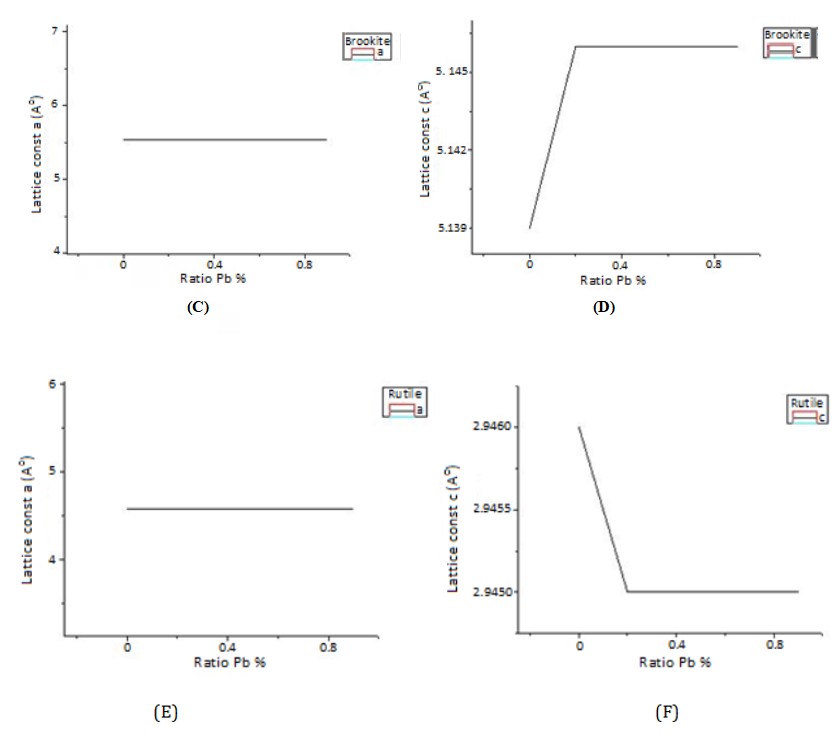
Figure 4: The crystal lattice constants a (AO), c (AO) in the anatase phase (A), (B), respectively, for the compound of pure and lead-doped titanium dioxide in different ratios (x = 0.2 - 0.5 - 0.7 - 0.9 g), the brookite (C) and (D) phase, respectively, for the compound of pure and lead - doped titanium dioxide in different ratios (x = 0.0 - 0.2 - 0.5 - 0.7 - 0.9 g), the rutile (E) and (F) phase, respectively, for the compound of pure titanium dioxide doped with lead in different proportions (x = 0.2 - 0.5 - 0.7 - 0.9 g).
It is possible that the increase in one of the crystal lattice constants a, b or c is due to the increase in vacanses, the stretching of the crystal lattice and the increase in the size of the primary cell and vice versa [39] (Figure 4). The expansion of the z-axis and this expansion in the basal plane is due to an increase in crystal vacancies and vice versa for rutile in which the constant c has decreased. Its decrease in anatase at the first rate of doping while maintaining a constant value until the last percentage of doping due to the contraction of each of the x and y axes and a decrease in the possibility of voids resulting from the occurrence of fualt stacking during the process of natural crystal growth of the material according to this level of the crystal structure of the material and the occurrence of shrinkage of the quaternary crystal lattice, and the increase in the lattice constants is due to the increase in the distance between the crystal levels, and this agrees with the researcher Yu J, et al. [5].
Then we calculated the Theoretical density of the X-ray diffraction spectrum for pure and dopant samples using the equation (7) [40] (Table 7):
Z M = N V ρ (7)
wt X-ray a
X-ray ρ : The theoretical density of the X-ray diffraction spectrum for powders is g/cm3. Where Z: The number of atoms per unit cell, which is 2 in the rutile phase, 8 in the brookite phase, and 4 in the anatase phase. Mwt: The molar mass is g/mol, which is 79.866 g/mol for the three phases of TiO2. Na: Avogadro’s number 6.023 x 10²³ mol-1. V: The initial cell size given in Tables (2-6) whose unit is (A°)3.
| ρ (g/cm3) X-ray | |||||
|---|---|---|---|---|---|
| Samples | Pure TiO 2 | Lead-doped TiO 2 | Lead-doped TiO 2 | Lead-doped TiO 2 | Lead-doped TiO 2 |
| (x=0.2g) | (x=0.5g) | (x=0.7g) | (x=0.9g) | ||
| Rutile | 4.297 | 4.299 | 4.299 | 4.299 | 4.299 |
| Anatase | 3.919 | 3.919 | 3.919 | 3.919 | 3.881 |
| Brookite | 4.069 | 4.063 | 4.063 | 4.063 | 4.027 |
| All phases | 4.096 | 4.094 | 4.094 | 4.094 | 4.069 |
Table 5: Theoretical density of pure and lead-doped TiO2 powders (0.2 - 0.5 - 0.7 - 0.9 g).
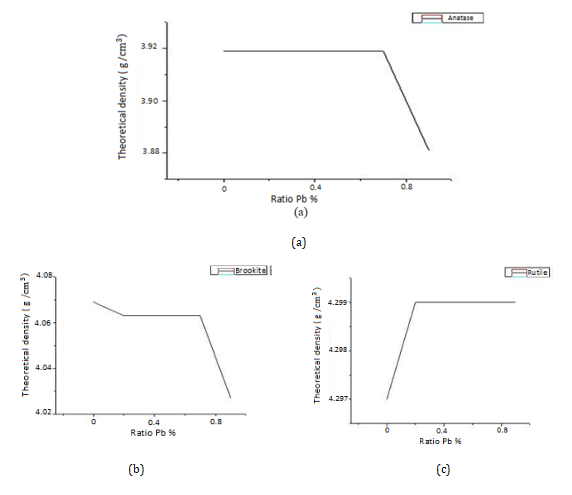
We note that the theoretical density X-ray ñ decreased with the increase of the dopance due to the increase in the cell size with the increase in the dopance from the inverse relationship between the two parameters [40] (Figure 5), because the cell size decreased by the same value for all ratios compared to pure rutile by increasing the dopant ratio, the lattice coefficients and the theoretical density, which we note that there is no change in it, remain constant until certain dot ratios. The change in the stability of the previous parameters [25].
The number of material atoms can also be calculated using the relation (8) [41] (Table 8):
ρ (8) X-ray a wt n = N M
n: the number of atoms of a substance in a unit volume of atom/cm3. Na: Avogadro’s number 6.02 x 10²³ mol-1 .
X-ray ρ : The theoretical density of the X-ray diffraction spectrum for powders is g/cm3. Mwt: The molar mass is g/mol, which is 79.866 g/mol for the three phases of TiO2.
| n 1022(atom/cm3) | |||||
|---|---|---|---|---|---|
| Samples | Pure TiO 2 | Lead-doped TiO 2 | Lead-doped TiO 2 | Lead-doped TiO 2 | Lead-doped TiO 2 |
| (x=0.2g) | (x=0.5g) | (x=0.7g) | (x=0.9g) | ||
| Rutile | 3.241 | 4.243 | 4.243 | 4.243 | 4.243 |
| Anatase | 2.956 | 2.956 | 2.956 | 2.956 | 2.927 |
| Brookite | 3.069 | 3.065 | 3.065 | 3.065 | 3.037 |
| All phases | 3.089 | 3.422 | 3.422 | 3.422 | 3.403 |
Table 6: the number of atoms of pure and lead-doped TiO2 powders (0.2 - 0.5 - 0.7 - 0.9 g).
We note the increase in the number of substance atoms per unit volume with an increase in the percentage of doping, but this increase slightly decreased at the doping percentage with lead g 0.9, and this is related to the previous changes that occurred in the theoretical density of the X-ray diffraction spectrum for powders due to the direct proportionality between these two parameters.
By calculating n, we can calculate the average distance between atoms in nanometer unit, for materials in which the number of atoms per unit volume is within n = 6 x10²² atom/ cm3 by substituting in the equation (9) [14] (Table 9):
L = (n)1/3 (9)
| L (nm) | |||||
|---|---|---|---|---|---|
| Samples | Pure TiO 2 | Lead-doped TiO 2 | Lead-doped TiO 2 | Lead-doped TiO 2 | Lead-doped TiO 2 |
| (x=0.2g) | (x=0.5g) | (x=0.7g) | (x=0.9g) | ||
| Rutile | 0.319 | 0.349 | 0.349 | 0.349 | 0.349 |
| Anatase | 0.31 | 0.31 | 0.31 | 0.31 | 0.309 |
| Brookite | 0.314 | 0.313 | 0.313 | 0.313 | 0.312 |
| All phases | 0.314 | 0.325 | 0.325 | 0.3247 | 0.3241 |
Table 7: The average distance between atoms of of pure and lead-doped TiO2 powders (0.2 - 0.5 - 0.7 - 0.9 g).
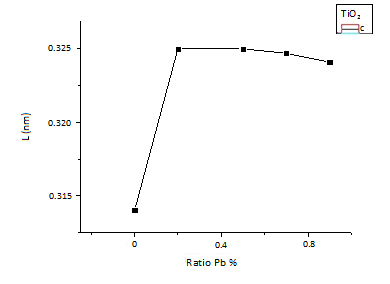
We notice the linear increase in the distance between the atoms in the two samples of pure and lead-doped titanium dioxide with a ratio of 0.2 g, then this increase was fixed at the dopance ratio of 0.5 g , while at the ratio of 0.7 g it took a decrease to reach the dopance ratio of 0.9 g. And with the decreasing distance between the atoms and their approach to the constants of the crystal lattice, the dissolution of the intermittent energy levels occurs and energy bands are formed, the width of which decreases as we go deeper inward towards the nucleus (Figure 6). The permissible energy bands separate, with forbidden bands Eg that cannot be occupied by electrons , and thus the interaction between them increases and the height and width of the voltage barrier between atoms decreases, as the decrease in height leads to the fall of the final atomic level above the voltage barrier, which makes the electron free to That level, as these electrons match perfectly with all atoms of the substance, forming a so-called electronic gas, which facilitates the passage of internal electrons (other than valence electrons) through the barriers that separate neighboring atoms and their movement within the crystal itself and the ability of electrons to meet . In our study, we take into consideration that the atoms are composed of spheres with a net positive charge resulting from the nucleus (Ti+4 and Pb+4) in addition to the electrons of the inner core of the atom, since the potential energy is closely related to the distance between the atoms. We note that at 0.9 g of doping of lead, the potential energy and bonding forces between the atoms are the largest compared to the other doping ratios due to the decrease in the distance between the atoms at this ratio of doping. When the atoms get close to each other, the orbitals overlap and the valence electrons begin to rearrange themselves until they reach to a more stable arrangement, and during this rearrangement, different types of bonds are formed between the atoms and this rearrangement causes an increase in the cohesion of the atoms and the formation of the solid state.
Conclusions
This paper presents a study of the structural properties that explain some physical properties of TiO2 powders doped with lead in different ratios.
XRD Patterns Confirmed. The XRD results showed that samples of anatase and rutile of the quaternary crystal system and brookite of the rhombic crystal system based in titanium dioxide have peaks corresponding to the crystalline levels (110), (012), (040), (111), (211), (123), (112), (220). All samples prefer the direction along the plane (110). The average crystal size (D) of the three phases together is in the range [57.379-85.370 nm]. And by calculating the distance between the crystalline levels (d), the lattice parameters (a), b) and c) and the size of the cell phases (V), the theoretical density of the X-ray diffraction spectrum of the powders X-ray ñ is within the range [4.69-4.096 g/cm3] And we calculated the number of atoms for each sample per unit volume (n), so the average distance between the atoms (L) for the three phases together within the range [0.3140-0.3250 nm] The lattice constants were a(A°), b (A°), c (A°) for all samples are nearly identical to the JCPDS values.
References
-
Mathur G (2022) COVID Killing Air Purifier Based on Uv & Titanium Dioxide Based Photocatalysis System. SAE Int J Adv & Curr Prac in Mobility 4(1): 143-150.
-
Schneider J, Matsuoka M, Takeuchi M, Zhang J, Horiuchi Y, et al. (2014) Understanding TiO2 Photocatalysis: Mechanisms and Materials. Chem Rev 114(19) 9919- 9986.
-
Elhalil A, Elmoubarki R, Sadiq M, Abdennouri M, Kadmi Y, et al. (2017) Enhanced photocatalytic degradation of caffeine as a model pharmaceutical pollutant by Ag-ZnO- Al2O3 nanocomposite. Desalin Water Treat 94: 254-262.
-
Di Paola A, Ikeda S, Marcì G, Ohtani B, Palmisano L (2001) Transition metal doped: physical TiO₂ properties and photocatalytic behavior. International Journal of Photoenergy 3: 6.
-
Yu J, Yu JC, Cheng B, Zhao X (2001) Photocatalytic Activity and Characterization of the Sol-Gel DerivedPb- Doped TiO2Thin Films. Journal of Sol-Gel Science and Technology 24: 39-48.
-
Long R, Dai Y, Menga G, Huanga B (2009) Energetic and electronic properties of X- (Si, Ge, Sn, Pb) doped TiO2from first-principles. Phys Chem Chem Phys 11: 8165-8172.
-
Yu-Chao T, Huang XH, Han-Qing Y, Li-Hu T (2012) Nitrogen-Doped TiO2 Photocatalyst Prepared by Mechanochemical Method: Doping Mechanisms and VisiblePhotoactivity of Pollutant Degradation. International Journal of Photoenergy, pp: 10.
-
Biying Li, Cheng X, Yu X, Yan L, Xing Z (2012) Synthesis and Characterization ofFe-N-S-tri-Doped TiO2Photocatalyst and Its EnhancedVisible Light Photocatalytic Activity. Advances in Materials Science and Engineering, pp: 5.
-
Lutic D, Petrovschi D, Ignat M, Cretescu I, Bulai G (2018) Mesoporous cerium-doped titania for the photocatalytic removal of persistent dyes. Catalysis Today 306: 300- 309.
-
Di Paola A, Bellardita M, Palmisano L (2013) Brookite, the Least Known TiO2 Photocatalyst. Cataiysts 3(1): 36-
-
Batttisha IK, Ahmed Farag IS, Kamal M, Ahmed MA, et al. (2014) Structural, Magnetic and Dielectric Properties of Fe-CoCo-Doped Ba 0.9 Sr 0.1 TiO3 Prepared by Sol-Gel Technique. New Journal of Glass and Ceramics 4(2): 19- 28.
-
Mardare D, Tasca M, Delibas M, Rusu GI (2000) On the Structural Properties and Optical Transmittance of TiO2 r.f. Sputtered Thin Films. Applied Surface Science 156(1- 4): 200-206.
-
Pérez E, Vittorio L, Torres MF, Sham E (2015) Nitrogen doped TiO₂ photoactivein visible light. revista Matéria 20(3): 561- 570.
-
Murcia Mesa JJ, Guarín Romero JR, Cely Macías AC, Rojas Sarmiento HA, Cubillos Lobo JA, et al. (2017) Methylene blue degradation over M-TiO2 photocatalysts (M= Au or Pt). Science in Development 8(1): 109-117.
-
Piątkowska A, Janus M, Szymański K, Mozia S (2021) C-,N- and S-Doped TiO2 Photocatalysts: A Review. Catalysts 11(1): 144.
-
Cardoso JC, Bessegato GG, Zanoni MVB (2016) Efficiency comparison of ozonation, photolysis, photocatalysis and photoelectro- catalysis methods in real textile wastewater decolorization. Water Res 98: 39-46.
-
Obina WM, Supriyanto A, Cari C, Sumardiasih S, Septiawan TY (2017) Time Variation of Insertion Cu On TiO2 Nanoparticles Layer Through The Electroplating Method In DyeSensitized Solar Cell (DSSC). J Phys Theor Appl 1(2): 137-144.
-
Long R, Dai Y, Menga G, Huanga B (2009) Energetic and electronic properties of X- (Si, Ge, Sn, Pb) doped TiO2from first-principles. Phys Chem Chem Phys 11: 8165-8172.
-
Zakrzewska K, Radecka M, Rekas M (1997) Effect of Nb, Cr, Sn Additions on Gas Sensing Properties of TiO2 Thin Films. Thin Solid Films 310(1-2): I61-166.
-
Eidsvåg H, Bentouba S, Vajeeston P, Yohi S, Velauthapillai D (2021) TiO2 as a Photocatalyst for Water Splitting-An Experimental and Theoretical Review. Molecules 26(6): 1687.
-
Sagadevan S, Vennila S, Singh P, Lett J A, Oh W C, et al. (2020) Exploration of the antibacterial capacity and ethanol sensing ability of Cu-TiO2 nanoparticles. Journal of Experimental Nanoscience 15(1): 337-349.
-
Sinclair FHM, Townsend VED (2022) Aegean civilizations. Encyclopedia Britannica, Chicago, USA.
-
Akpan UG, Hameed BH (2010) The Advancements in sol–gel Method of Doped-TiO2 Photocatalysts. Applied Catalysis A: General 375(1): 1-11.
-
Wang Z, Helmersson U, Per-Olov K (2002) Optical Properties of Anatase TiO2 Thin Films Prepared by Aqueous sol–gel Process at Low Temperature. Thin Solid Films 405(1-2): 50-54.
-
Maimaiti M, Zhao B, Mamat M, Tuersun Y, Mijiti A, et al. (2019) The Structural, Optical and Photocatalytic Properties of the TiO2 Thin Films. Mater Res Express 6(8): 086408.
-
Fouzia A, Bensaha R (2019) Optical Properties of Lead Doped Titanium Oxide of Thin Films Prepared by Sol- Gel Method at Low Temperature. Universal Journal of Materials Science 7(2): 25-33.
-
Kumar K , Sreekanth T (2005) Solid State Physics. S Chand Publishing, India, pp: 214-216.
-
Myers HP (1990) Introductory to Solid State physics. 2nd(Edn.), Taylar and Francis, Philadelphia.
-
Ali MA (2018) Preparation and studying of radiation effect on Bi2−xPbxSr2Can−1Cun−yNiyO2n+4+σ high temperature superconductor. M.Sc. thesis, University of Baghdad, College of Education for Pure Science.
-
Vinila VS, Jacob R, Mony A, Nair HG, Issac S, et al. (2014) XRD Studies on Nano Crystalline Ceramic Superconductor PbSrCaCuO at Different Treating Temperatures. Crystal Structure Theory and Applications 3(1): 1-9.
-
Leita˜o Muniz FT, Miranda MAR, Morilla-Santos C, Sasaki JM (2016) The Scherrer equation and the dynamical theory of X-ray diffraction. Acta Crystallographica Section A: Foundations and Advances 72(3): 385-390.
-
Turgut G, Keskenler EF, Aydin S, Sonmez E, Dogan S, et al. (2013) Effect Of Nb Doping On Structural, Electrical And Optical Properties Of Spray Deposited SnO2 Thin Films. Super lattices and Microstructures 56: 107-116.
-
Moloantoa RJ (2016) Studies of Structural and Optical Variations of Nanosized Tio2 Induced By Precious Metal Dopants (Au, Pt, Pd and Ag). Faculty of Science and Agriculture, University of Limpopo, South Africa, pp: 52.
-
Yousif MG (1987) Solid state physics. Volume 1, Ministry of Higher Education Printing presses, Volume 1.
-
Manafi S, Khosravipanah E (2016) Synthesis of lead titanate nanostructures by mechanical activation method and its effect on methyl orange decolorization. 5(1): 33-44.
-
Hu MZ, Lai P, Bhuiyan MS, Tsouris C, Gu B (2009) Synthesis and characterization of anodized titanium- oxide nanotube arrays. J Mater Sci 44(11): 2820-2827.
-
Chen M, Ma CY, Mahmud T, Lin T, Wang XZ (2011) Hydrothermal synthesis of TiO2 nanoparticles: process modelling and experimental validation. In: Wu CY, et al. (Eds.), Particulate materials: Synthesis, char- acterisation, processing and modeling. The Royal Society of Chemistry, Great Britain, pp: 28-33.
-
Hamadanian M, Reisi-Vanani A, Majedi A (2009) Preparation and characterization of S-doped TiO2 nanoparticles, effect of calcination temperature and evaluation of photocatalytic activity. Mater Chem Phys 116(2–3): 376-382.
-
Naik SPK, Santosh M, Raju PS (2018) Structural and Thermal Validations of Y3Ba5Cu8O18 Composites Synthesized via Citrate Sol-Gel Spontaneous Combustion Method. J Supercond Nov Magn 31(5): 1279-1286.
-
Hussain Qader FI (2014) Structure Rietveld Refinement Study of BaCo xTi xFe 12-2xO19 ferrite Using Powder XRD Analysis. Ibn Al-Haitham Jour for Pure & Appl Sci 27(2): 70-77.
-
More H (2020) Numerical Problems on Density of Solid. Physical Chemistry.
- Sense, Gravity, Parity & Chirality in Mathematical Physics
- Quantum Lattice Simulations PHYSICS: Microcircuit Particle Formation and Observable Macroscopic Irreversible Time - A Discrete Lagrangian with Cellular Automata Framework
- Quantum Biology from Biomacromolecule to Cell, and Central Dogma Described by Quantum Theory
- Focus, Agility, Speed and Technology (FAST) for Sustainability and Growth
- Square Root Metric Geometry and Pati-Salam Model in Curved Space-Time
- A Simple System Demonstrating the Mpemba Effect in Classical Mechanics